Published
What is Deep V Tracker 2.0?
Deep V Tracker 2.0 is one of six new Pro indicators DeepCharts presented in November 2026, and the next generation of the Deep V-Tracker. It filters the relevant zones out of all those the first version brought up. Version 1 splits two reads of the flow: patterns (acceleration, slowdown, exhaustion) and pressure and absorption zones.
Our link opens DeepCharts with code OFF already filled in at the Payment step. Arriving without it? Enter OFF in the promo code field yourself.
What DeepCharts has shown
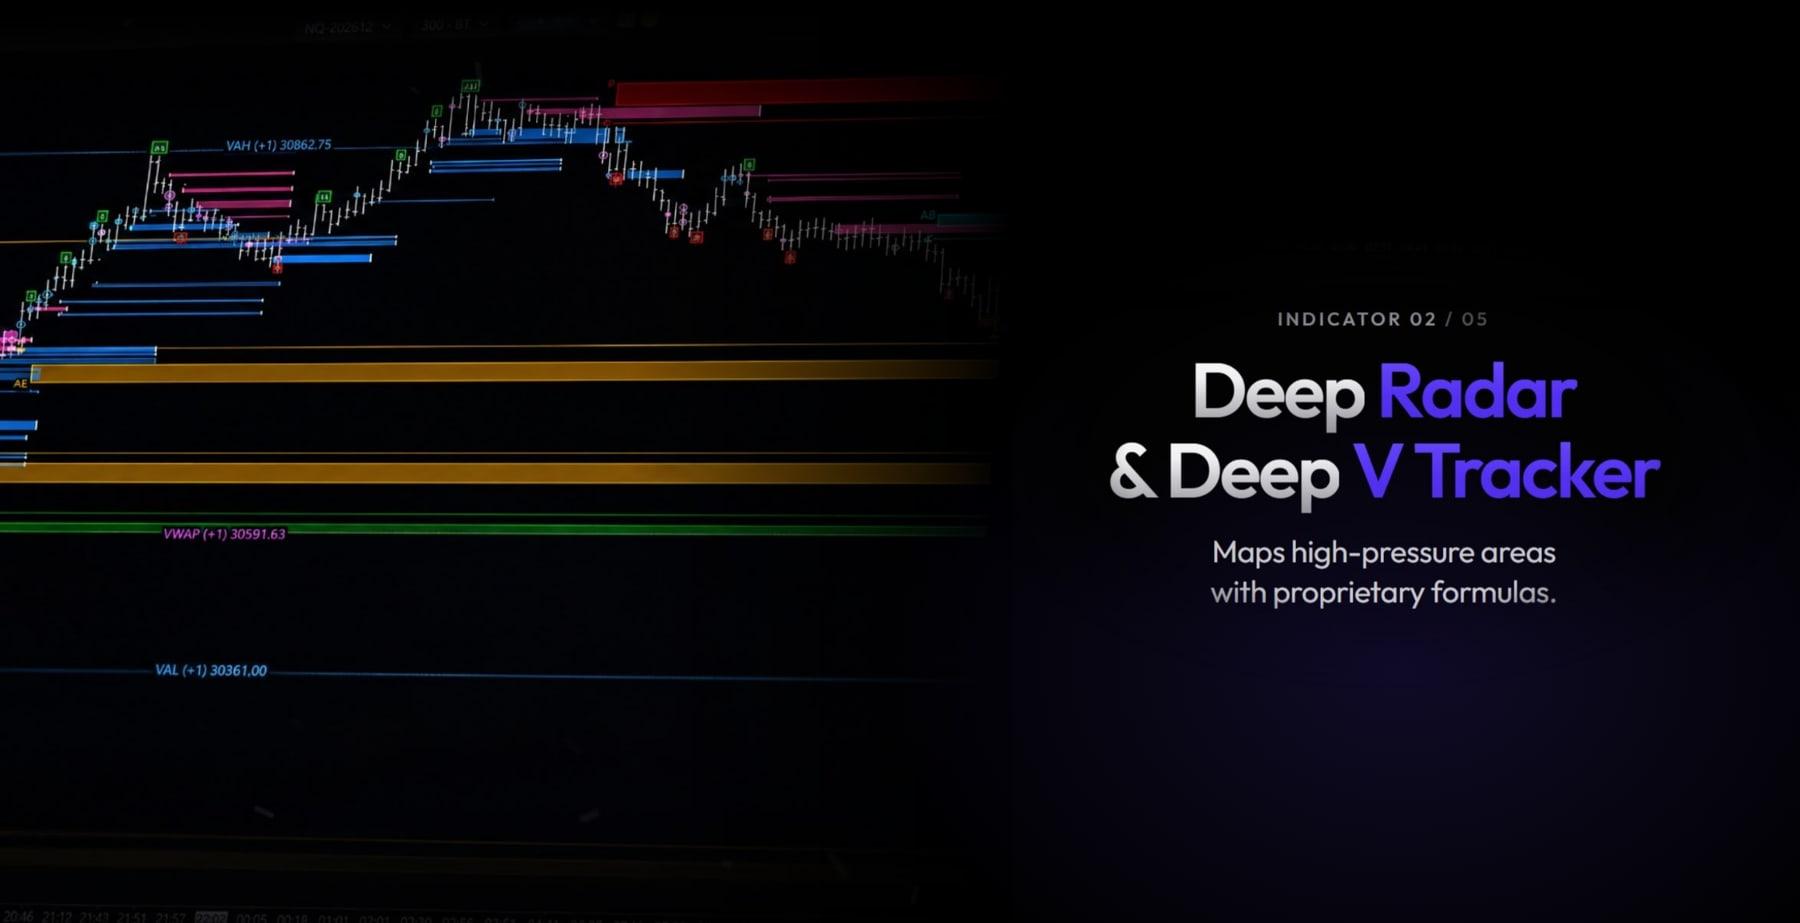
DeepCharts presents it with Deep Radar, under the slogan "Maps high-pressure areas with proprietary formulas". On the capture, on the NQ, high-pressure zones appear as coloured horizontal bands extended to the right, and one label from v1 is recognisable, AE (Absorption Extreme), which marks the level beyond which an absorption zone is invalidated. As a reminder, v1 frames accelerations, marks slowdowns and exhaustion, and draws purple lines (selling pressure at the bid) and green lines (buying pressure at the ask), labeled P or A, with C (Control) and E (Extreme) suffixes. On the grid, v1 is still listed among the premium features and 2.0 among the new studies: both coexist.
Using it day to day
Filtering is 2.0's promise: fewer zones on screen, better chosen. Before changing your method, run 2.0 next to v1, on the same chart or in Deep Replay. Compare three things: the number of zones per session, where the kept zones sit relative to v1's, and what happens to the ones 2.0 drops. If the dropped zones are the ones price ignored, the filter is doing its job.
Practical case: you trade NQ with v1 set to Strong and Conservative, and you still end up with absorption zones price cuts through without a glance. 2.0 comes out. You replay ten sessions with both versions on screen and note, for each v1 zone, whether 2.0 keeps it and whether price respected it. After ten sessions you know what the filter changes about your levels, not what the announcement says. The AE label stays your invalidation: beyond it, the zone is worth nothing.
⚠ The trap to avoid
The trap is changing tool and method at the same time: if your results move after the update, you won't know whether it's the tool or your execution. The second trap is believing a filtered zone is a guaranteed zone. Fewer zones means less noise, not more certainty: confirmation in the flow is still required.
Combine it with
Like v1, 2.0 is read with the liquidity heatmap, since an absorption zone should match size actually resting in the book, and with the iceberg detector, which tells you whether absorption reloads or runs dry. Deep Radar, presented alongside it, gives the balance of power around the same zones.
FAQ
What's the difference between Deep V-Tracker and Deep V Tracker 2.0?+
2.0 is the next generation: according to DeepCharts, it filters the relevant zones out of all those the first version brought up. Version 1 is documented (flow patterns, pressure and absorption zones); how 2.0 filters isn't documented yet.
What does the AE label mean?+
Absorption Extreme: a label inherited from v1, visible on the 2.0 capture, marking the level beyond which an absorption zone is invalidated.
Should I switch to Deep V Tracker 2.0 right away?+
Better to run it next to v1, in replay, over ten or so sessions before changing your method. An update is judged on your levels, not on the announcement.
Which DeepCharts plan includes it?+
The Pro plan, the only one that includes the six new studies (Deep Flow, Deep Radar, Deep V Tracker 2.0, Deep Trades Reversal, Deep Frame Engine and Deep Zones), according to the DeepChart grid checked on November 9, 2026.
Latest decoded trading sessions
A real trading day read live on the heatmap and the footprint: macro events, the levels that held, and every read with its DeepCharts screenshot.
- ESThursday, November 12, 2026Possible ouster of Jensen Huang drags Nvidia lower and weighs on the ES
- ESWednesday, November 11, 2026Tech takes back the lead behind Nvidia and CoreWeave, bond market closed
- NQWednesday, November 11, 2026Semiconductors lift the Nasdaq 100 after CoreWeave's results
Want to get better at order flow?
We discuss flow, liquidity and our trades live, every day, on the OrderFlowFutures Discord. Join us, it's free.
Join the Discord for free5 online·118 members·Free · instant access