Updated · first published
What is Deep V-Tracker?
Aggression at market says nothing on its own. What matters is its rhythm: is it accelerating, slowing, exhausting itself?, and what it runs into. Deep V-Tracker splits those two questions into two explicit modules instead of blending them into a single indicator.
What DeepCharts does better
The Patterns module boxes in cyan the candles where order flow suddenly accelerates, marks slowdown zones, and flags exhaustion points where aggressive participants deplete their orders. The Absorption & Pressure module draws horizontal lines over activity zones: purple for seller pressure at the BID, green for buyer pressure at the ASK, with labels P for pressure and A for absorption. The C (Control) and E (Extreme) suffixes mark key level boundaries and invalidation thresholds.
Using it day to day
The setting that changes everything is intensity. Patterns filter as Strong, Medium or Weak; pressure and absorption zones as Conservative, Medium or Aggressive. Start on Strong and Conservative: you will get few marks, but they will mean something. Line length is set in bars, and alerts can be attached to detections.
Typical case: price drops toward a level, the Patterns module boxes an acceleration in cyan, then marks a slowdown. At the same place a green line labeled A appears: buyer pressure absorbing the aggressive selling. The combination, acceleration, slowdown, absorption at the same price, describes a seller who has finished working and a buyer taking over.
⚠ The trap to avoid
The trap is treating every mark as a signal. A pressure zone is not an entry: it is a place where aggressive orders are being blocked by passive ones. While the block holds, the level is worth something; the moment it gives way, the same mark becomes a trap. The second trap is dropping intensity to Weak to see more: you will mostly see noise.
Combine it with
Read Deep V-Tracker alongside the liquidity heatmap: the absorption zone it marks should correspond to size actually resting in the book. If the line appears with nothing behind it, be skeptical. Cross it with the iceberg detector too: absorption that refills is a different animal from absorption that exhausts.
FAQ
What do the P, A, C and E labels mean in Deep V-Tracker?+
P marks a pressure zone and A an absorption zone. The C (Control) and E (Extreme) suffixes mark key level boundaries and invalidation thresholds respectively.
What is the difference between pressure and absorption?+
Pressure describes sustained activity on one side of the book, seller at the BID in purple, buyer at the ASK in green. Absorption describes the moment aggressive orders get blocked by passive ones. The first is a flow, the second is a block.
Which intensity should I start with?+
Strong for patterns and Conservative for zones. You will get noticeably fewer marks, but each will correspond to a clear event. Lowering intensity increases the number of detections faster than their quality.
Should both modules be enabled at the same time?+
No. Each is set in its own tab. Isolating a single module, Patterns for instance by setting the two other categories to Weak, often helps you learn to read it before adding the second one.
What is the difference between Intensity and Level mode?+
Intensity filters the visual noise of the displayed patterns, on Patterns as well as on Absorption Pressure. Level mode, specific to the Absorption Pressure module, additionally sets how close price must be to structural thresholds before a line appears. They are two independent filters.
Can a Deep V Tracker alert target a single pattern type?+
The Absorption-Pressure Alert tab names the alert through Alert Name and can attach a message with Enable Message, rather than settling for a generic sound.
Tutorial & settingsDeep V Tracker: setting up the patterns and the Absorption Pressure module
+Two modules, two configuration logics: pattern intensity and color on one side, pressure and absorption thresholds on the other.
Deep V Tracker combines two readings of volumetric flow in a single indicator. The Patterns module spots anomalies in the relation between price and volume (acceleration, slowdown, exhaustion). The Absorption Pressure module maps where buyers and sellers actually hold control, at precise price levels. The two are configured separately, each with its own logic.
- The Deep V Tracker indicator added to the chart from the indicator list
Step by step
- 01
Add the indicator and open its configuration
Add Deep V Tracker to the chart from the indicator list, then click its settings icon. The panel clearly separates the two modules, Patterns and Absorption Pressure: each has its own settings in a separate tab.
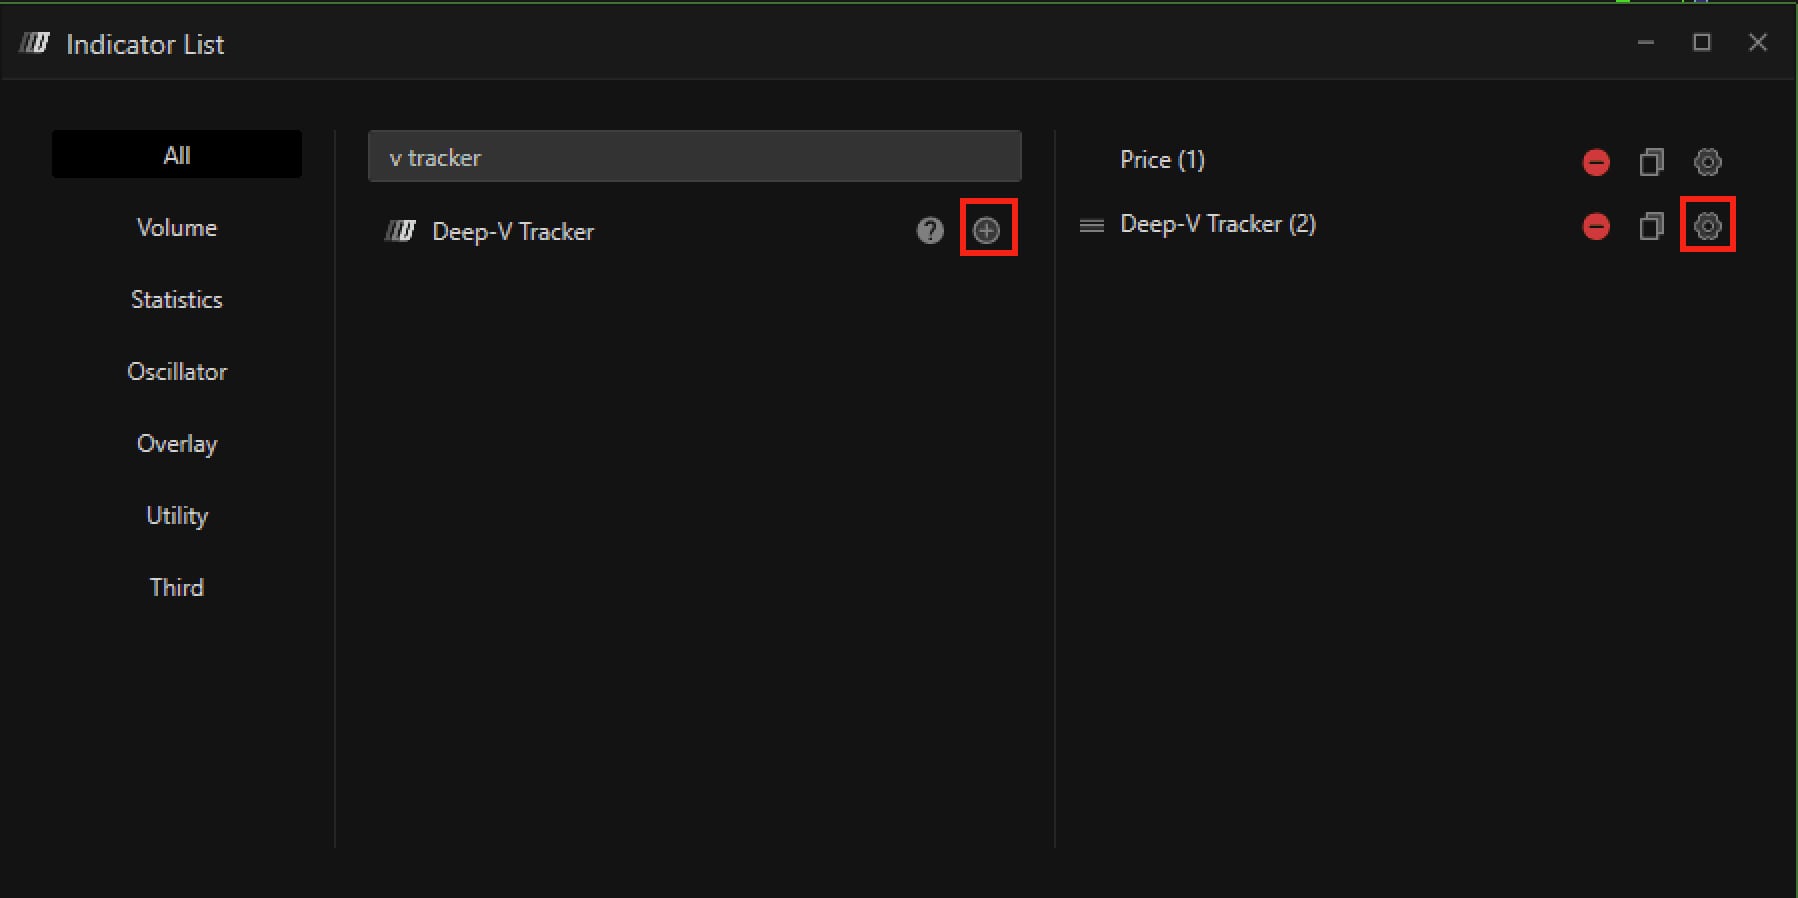
The Deep V Tracker indicator in the list, with the settings icon that opens its configuration.© DeepCharts - 02
Set the Patterns module
The module distinguishes three categories, each with its own Mode (Weak, Medium, Strong) and its own Color, set independently: Acceleration, Exhaustion and Slowdown. Mode filters the visual noise of that specific category: Strong keeps only its sharpest patterns, Weak shows more of them at the risk of including marginal ones. There is no separate on/off switch: a category you do not want to see is set to Weak rather than Strong, or recolored in a shade close to the background.
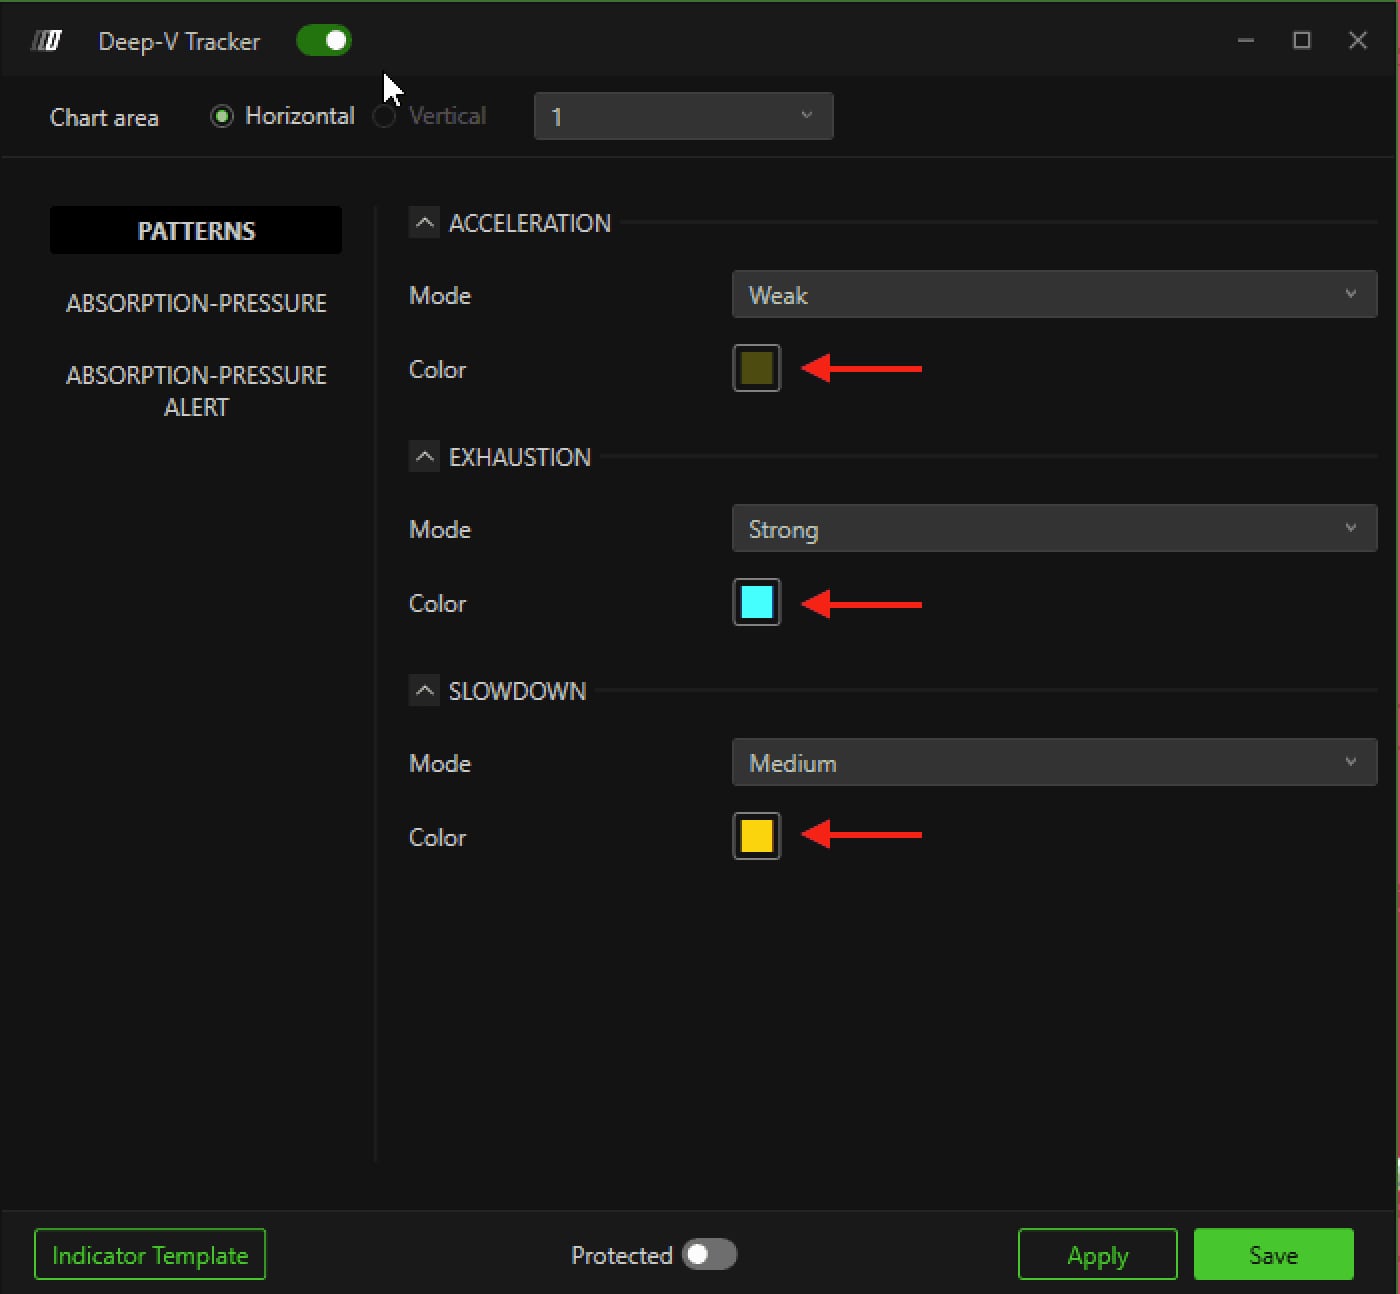
The Patterns panel with Mode and Color set separately for Acceleration, Exhaustion and Slowdown.© DeepCharts - 03
Recognize the three patterns
A zone flagged on the candle bodies for Acceleration marks an inflow of institutional interest, a clear resumption of the directional move. Exhaustion means the buying or selling energy has drained, which often precedes a reversal without guaranteeing it. Slowdown marks a loss of strength in the current move, without yet signaling a turn.
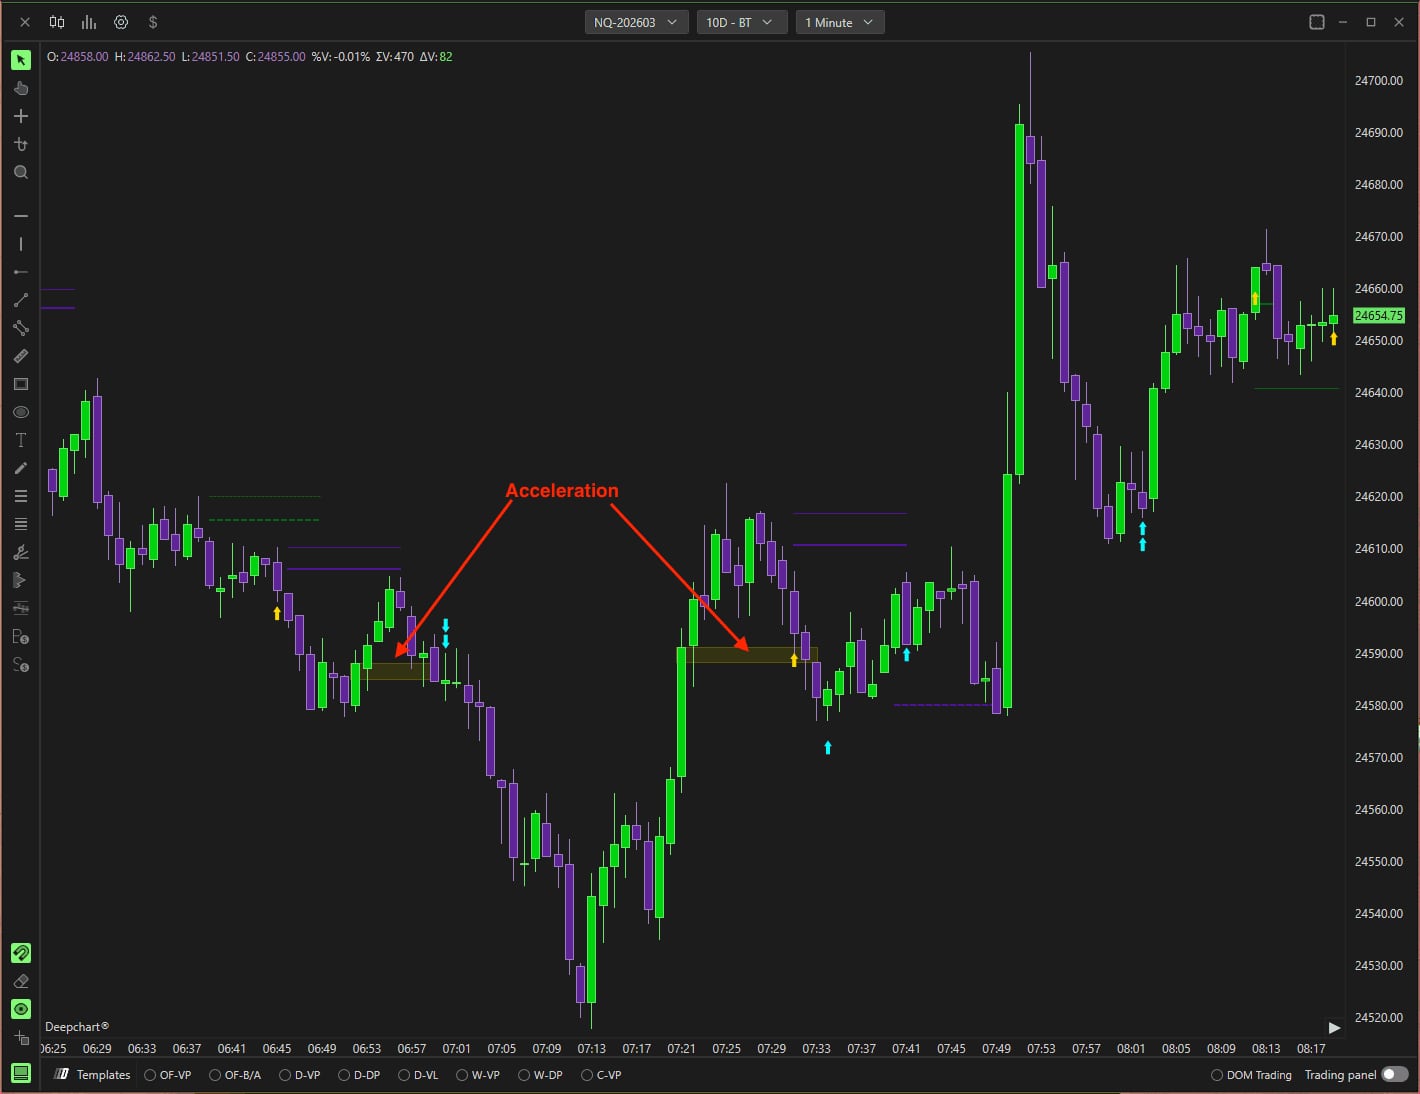
The Acceleration pattern illustrated on the chart, two zones flagged with arrows.© DeepCharts - 04
Set the Absorption Pressure module
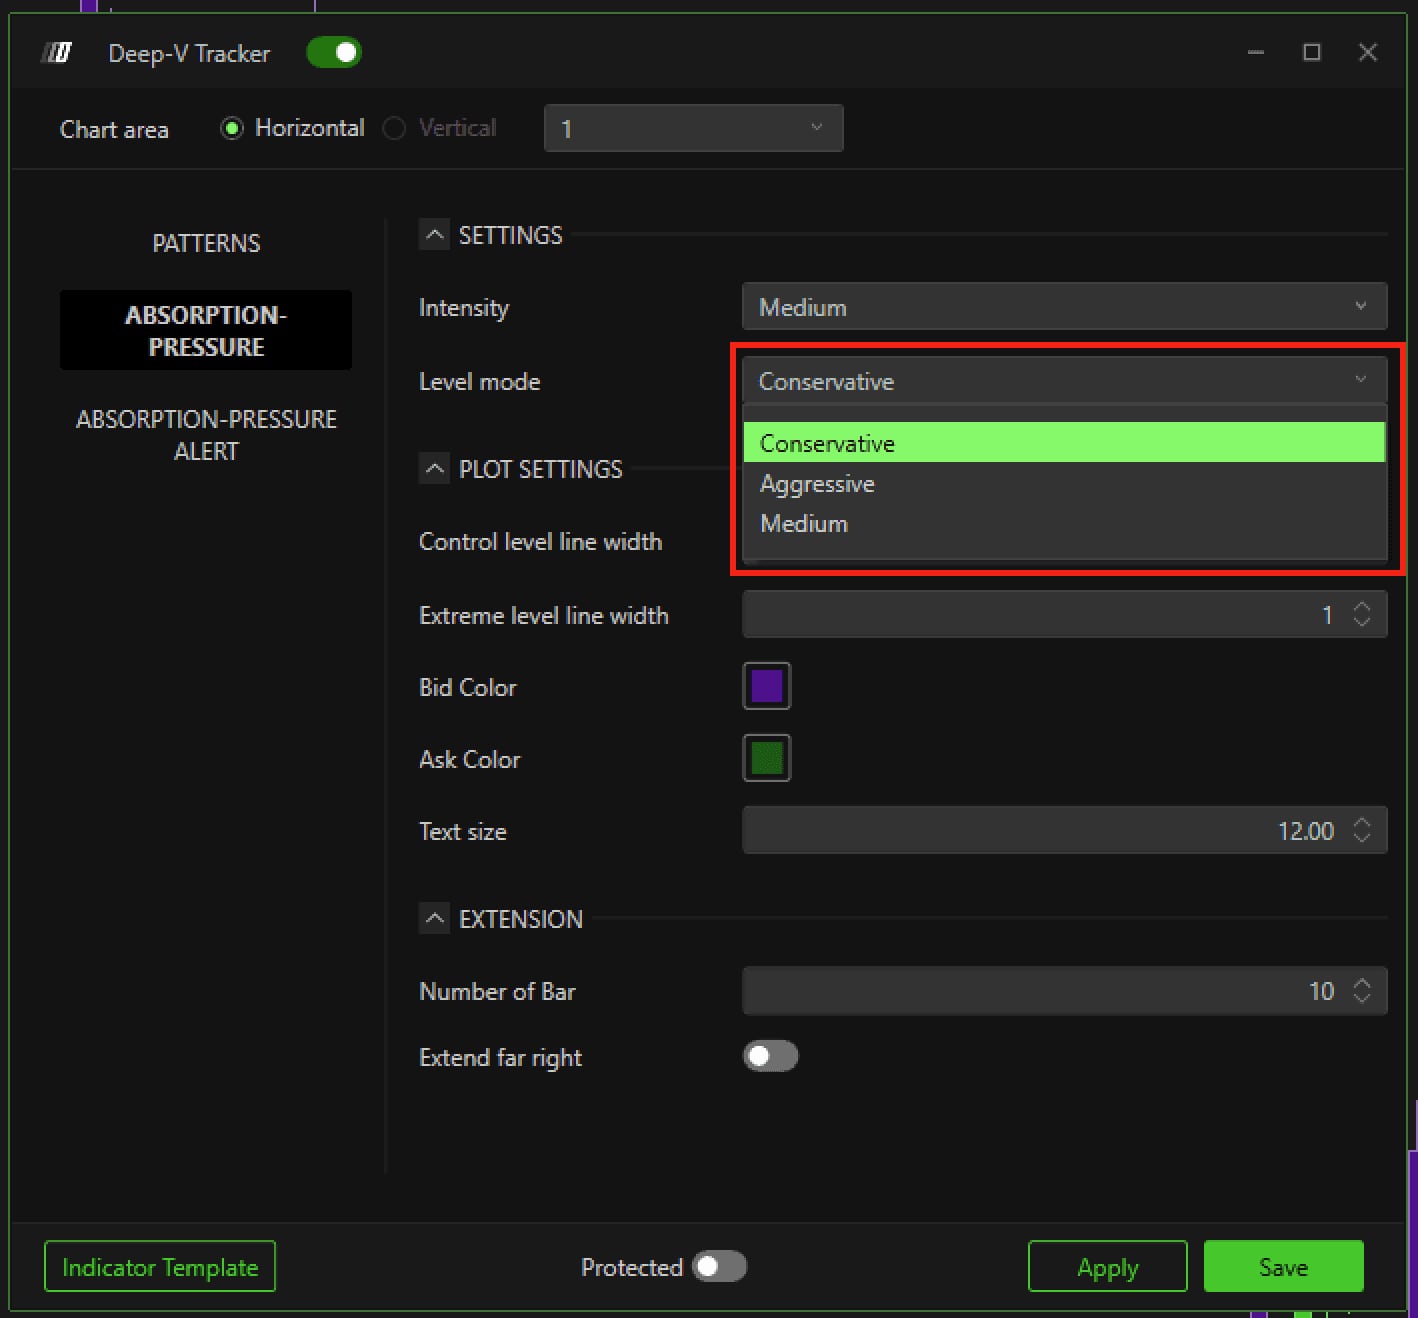
Intensity (Weak, Medium, Strong) works like it does for the Patterns. Level mode (Conservative, Medium, Aggressive) sets how close price must be to the market's structural thresholds before a line shows: Conservative only reacts to the most established levels, Aggressive reacts earlier, at the cost of more false signals. Control level line width and Extreme level line width set separately the thickness of the control lines and the extreme lines, two and one pixel by default. Bid Color and Ask Color are customizable, purple and green by default. Text size sets the label legibility, and in the Extension block, Number of Bar sets the line length while Extend far right extends them to the right edge of the chart, disabled by default.
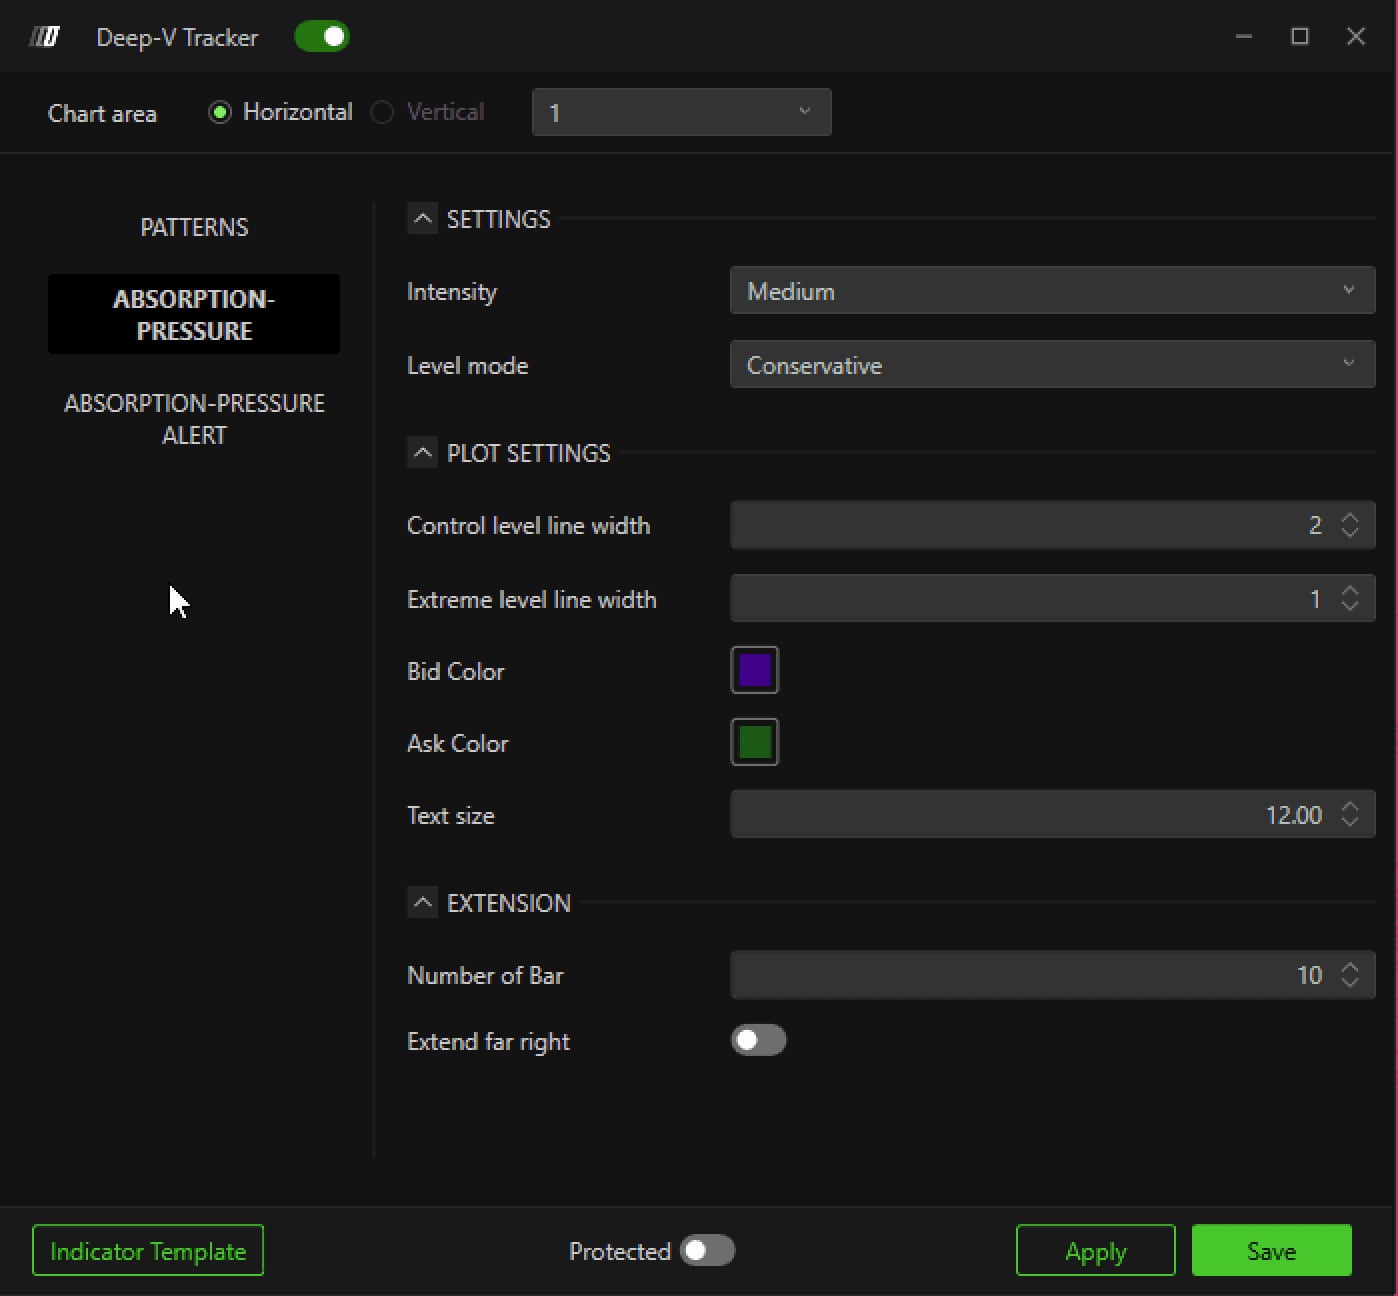
The Absorption Pressure module with Intensity, Level mode, the line widths and the Bid/Ask colors.© DeepCharts - 05
Read the P, A, C and E labels
On the Absorption Pressure lines, the letter P (Pressure) appears dotted for strong buying pressure and solid for strong selling pressure; the letter A (Absorption) means aggressive orders got blocked by passive orders at the same level. The C suffix (Control) marks the level where a reaction is most likely, the E suffix (Extreme) marks the zone beyond which the read is invalidated.
- 06
Create an alert
From the Absorption-Pressure Alert tab, Enable Alert Sound turns the sound on, Alert Name names the alert in the dropdown list, and Enable Message adds a message displayed when it fires, so you do not have to keep an eye on the chart at all times.
The Absorption-Pressure Alert tab with Enable Alert Sound, Alert Name and Enable Message.© DeepCharts
Settings, tab by tab
Clear resumption of the directional move.
The buying or selling energy has drained.
Loss of strength in the current move.
Same logic as for the Patterns.
How close price must be to structural thresholds before a line shows. Aggressive reacts earlier, at the cost of more false signals.
Thickness of the control level lines.
Thickness of the extreme level lines.
Purple for selling pressure (Bid), green for buying pressure (Ask) by default.
Legibility of the P, A, C, E labels.
Display length of the horizontal lines.
Extends the lines to the right edge of the chart.
⚠ Traps to avoid
- Confusing the C suffix with the E suffix. C (Control) marks the most likely reaction level, E (Extreme) marks the invalidation zone. Reacting to an E level as if it were a C level means reacting too early.
- Pushing Level mode to Aggressive without adjusting Intensity in return. Both settings combined at their most sensitive position produce a number of lines that drowns the read instead of helping it.
- Looking for a switch to disable a Patterns category. There is none: to silence Slowdown for instance, lower its Mode to Weak or recolor it in a shade close to the background, rather than hunting for a checkbox that does not exist.
Want to get better at order flow?
We discuss flow, liquidity and our trades live, every day, on the OrderFlowFutures Discord. Join us, it's free.
Join the Discord for free7 online·76 members·Free · instant access