Published
What is Deep Radar?
Deep Radar is one of six new Pro indicators DeepCharts presented in November 2026. It answers two questions: who dominates the market, and which side the aggression comes from. Combined with a volume profile, it gives an immediate visual read of the balance of power, mapping high-pressure areas with proprietary formulas.
Our link opens DeepCharts with code OFF already filled in at the Payment step. Arriving without it? Enter OFF in the promo code field yourself.
What DeepCharts has shown
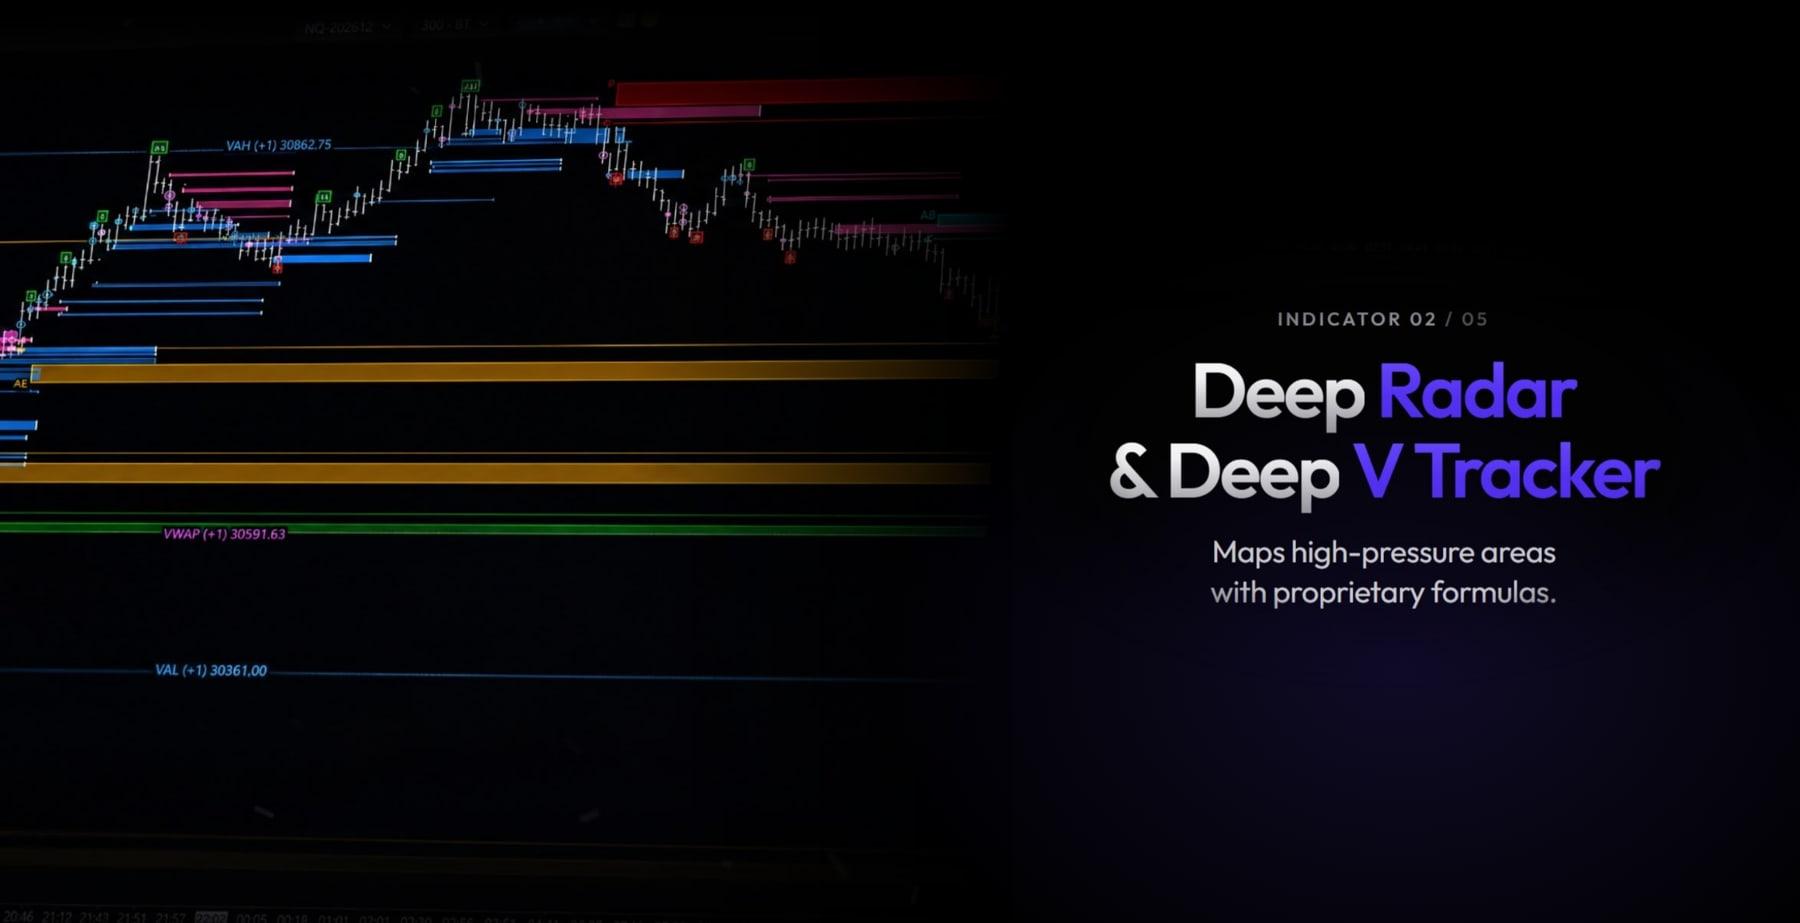
DeepCharts presents it with Deep V Tracker 2.0, under one slogan: "Maps high-pressure areas with proprietary formulas". On the capture, on the NQ (December 2026 contract), both draw coloured horizontal bands, blue, pink, red and orange, at the levels where pressure concentrated, extended to the right. The VWAP, VAH and VAL stay plotted. The point is no longer hunting for pressure candle by candle: the levels where it built up stay visible long after the moment it was applied.
Using it day to day
Day to day, Deep Radar is a map before it's a timing tool. Before the open, spot the bands still active above and below price, and note which ones line up with a profile reference, VAH, VAL or VWAP: those are the strongest candidates. During the session the question becomes: when price comes back to a band, does aggression come from the same side that created it? Keep few bands on screen; a map that covers everything points at nothing.
Typical case on the NQ: a wide orange band formed below price during the rally, above the VWAP. Price comes back down onto it. Deep Radar tells you who dominated when the band formed; the current flow tells you whether that side is still there. If selling aggression runs dry there and the footprint shows absorption, the band holds and acts as support; if it's cut through without a reaction, it loses its value for the session.
⚠ The trap to avoid
The trap is taking a band for a wall. A past pressure zone is a place where something happened, not a promise it will happen again. The second trap is stacking bands across sessions until every price is "a zone": at that point the tool confirms any trade. An area highlighted by an algorithm is just an area; what makes the difference is how you enter, your stop and your management.
Combine it with
Deep Radar is read with the volume profile, which is how DeepCharts presents it: the profile says where the market accepted price, the radar who pushed it. Deep V Tracker 2.0, presented alongside it, filters the most relevant zones; Deep Flow, on a shorter horizon, sums up the flow phase by phase when price reaches a band.
FAQ
What is Deep Radar for?+
According to DeepCharts' presentation, answering two questions: who dominates the market, and which side the aggression comes from. It maps high-pressure areas with proprietary formulas and is read with a volume profile.
What's the difference between Deep Radar and Deep V Tracker 2.0?+
DeepCharts presents them together and they complement each other: Deep Radar gives the balance of power and where aggression comes from, Deep V Tracker 2.0 filters the relevant zones out of those the first V-Tracker brought up. The calculation details aren't documented yet.
Are Deep Radar's bands support and resistance?+
They're zones where pressure concentrated. They become support or resistance only if the flow confirms it when price comes back: a band cut through without a reaction loses its value.
Which DeepCharts plan includes it?+
The Pro plan, the only one that includes the six new studies (Deep Flow, Deep Radar, Deep V Tracker 2.0, Deep Trades Reversal, Deep Frame Engine and Deep Zones), according to the DeepChart grid checked on November 9, 2026.
Latest decoded trading sessions
A real trading day read live on the heatmap and the footprint: macro events, the levels that held, and every read with its DeepCharts screenshot.
- ESThursday, November 12, 2026Possible ouster of Jensen Huang drags Nvidia lower and weighs on the ES
- ESWednesday, November 11, 2026Tech takes back the lead behind Nvidia and CoreWeave, bond market closed
- NQWednesday, November 11, 2026Semiconductors lift the Nasdaq 100 after CoreWeave's results
Want to get better at order flow?
We discuss flow, liquidity and our trades live, every day, on the OrderFlowFutures Discord. Join us, it's free.
Join the Discord for free5 online·118 members·Free · instant access