Fair Value Gap (FVG): the gap isn't empty, here is what the footprint shows inside
Published · updated · 29 min read
By Tom · Trader & founder of OrderFlowFutures
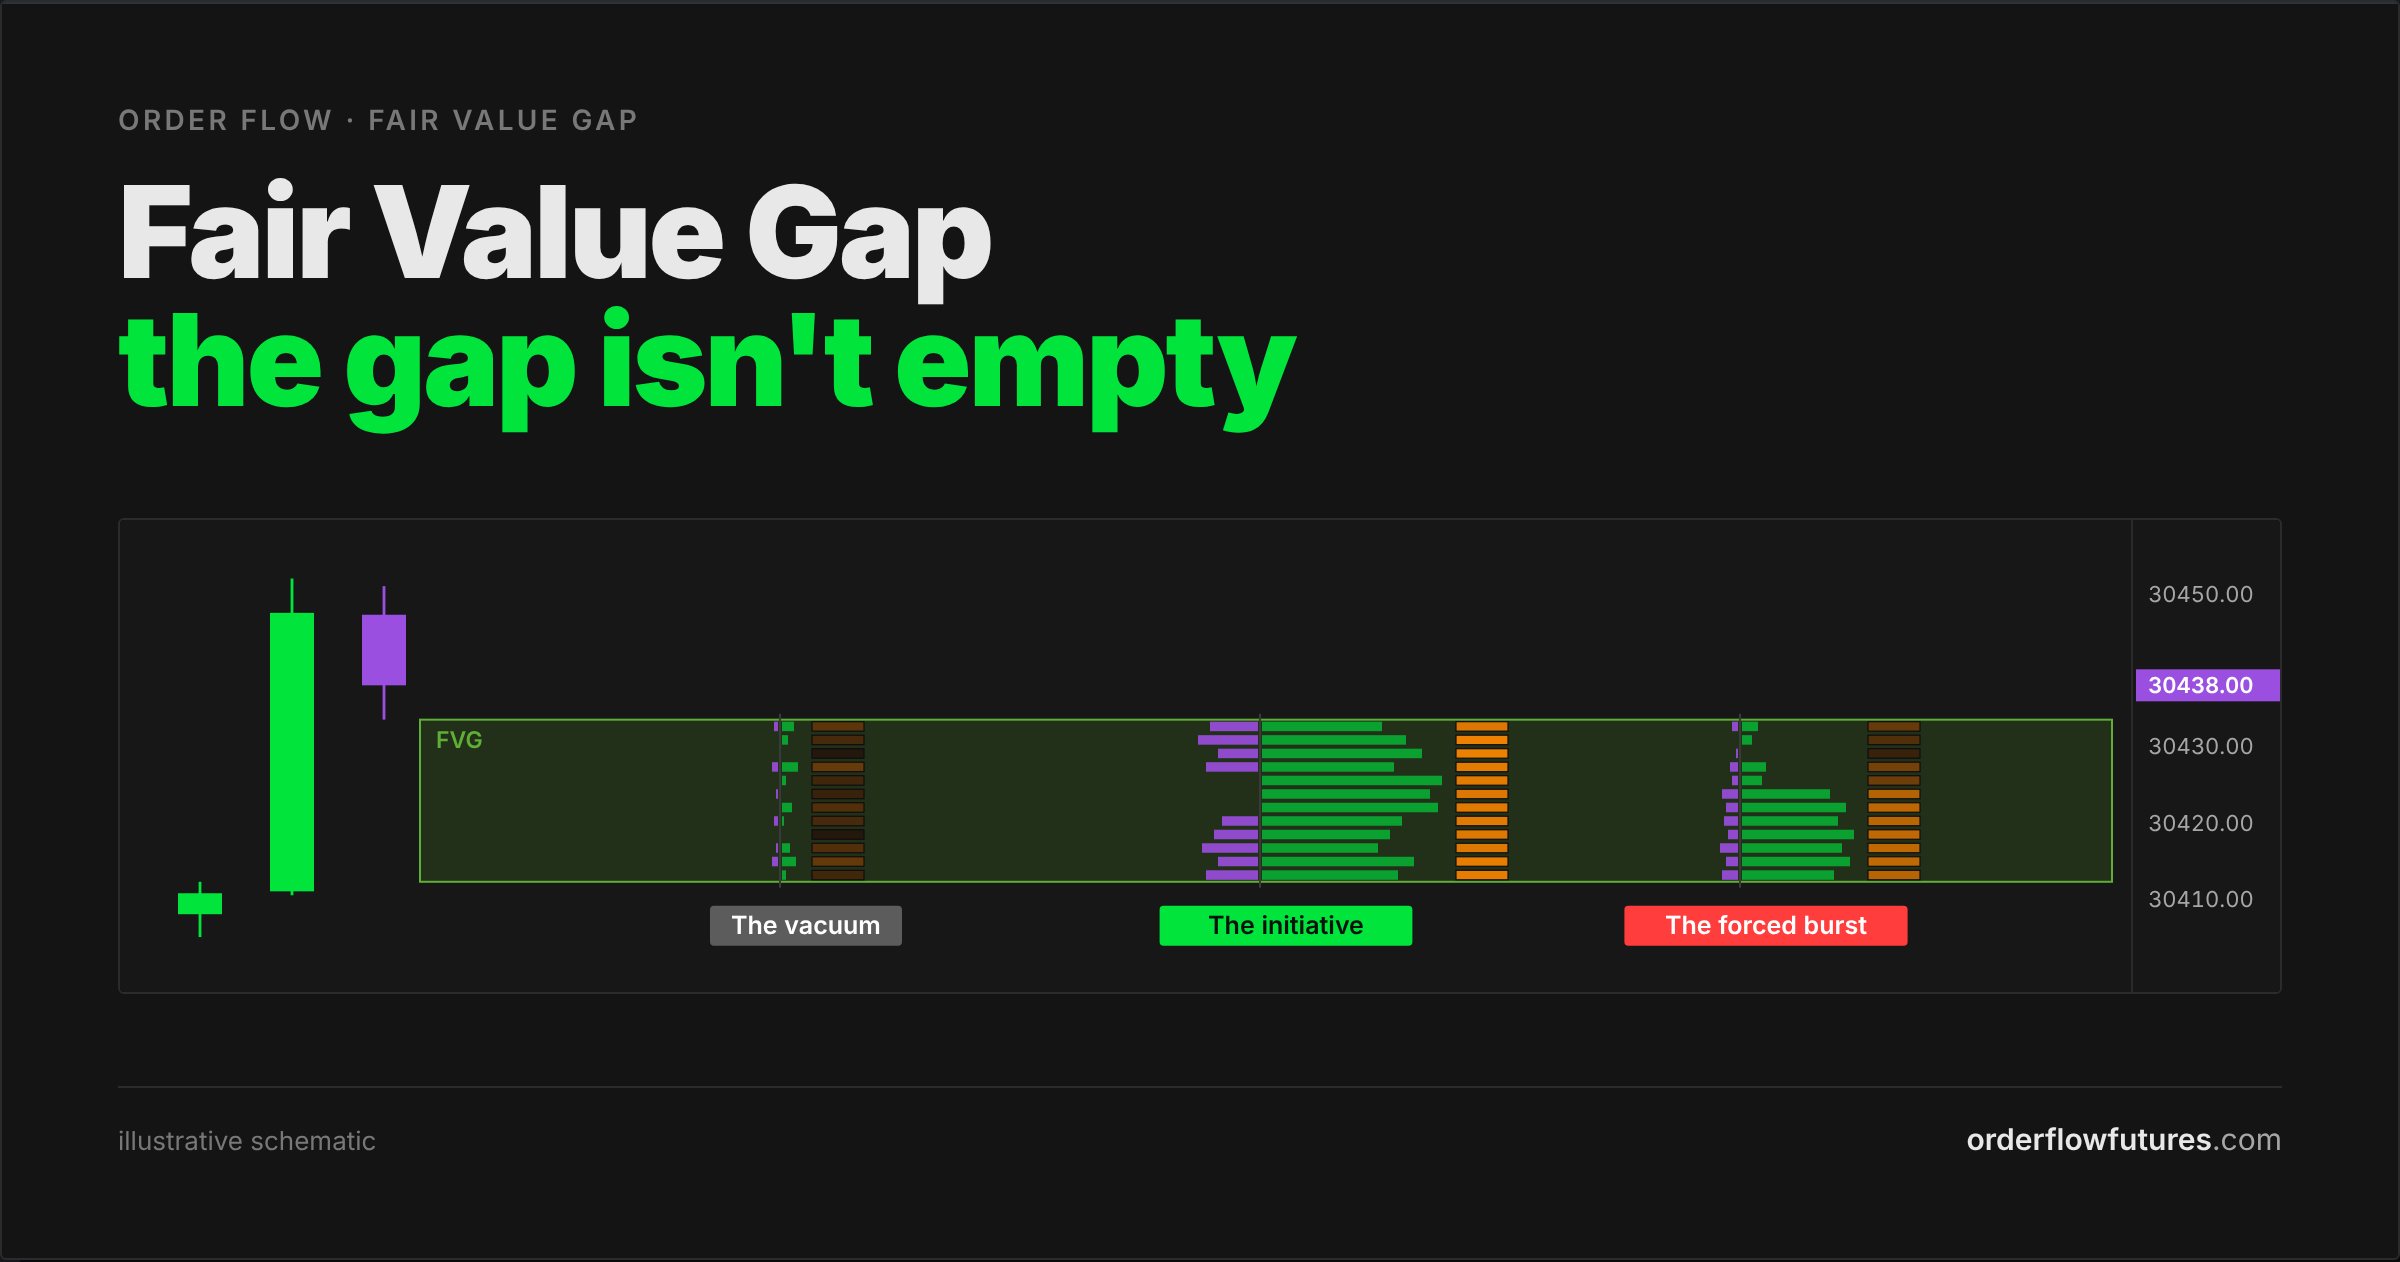
An FVG is defined by two prices, its footprint by hundreds. Why the candle cannot tell whether the zone will hold, and what the footprint shows instead.
NQ, 5 minute chart, a Tuesday. The 10:00 candle starts at 30,411 and runs straight up to 30,452. The 9:55 candle had its high at 30,412.25, the 10:05 candle holds its low at 30,433.50. In between, 21.25 points that neither the candle before nor the candle after ever touched: a clean 85 tick bullish Fair Value Gap, exactly like the videos. You place a buy at 30,433.50, at the edge of the zone, with a stop at 30,411, below the zone. 22.5 points of risk, $450 per contract.
At 10:45, price comes back. It enters the zone, cuts through it from top to bottom in one minute forty without pausing once, takes your stop and keeps going to 30,396.
Your candle reading was not wrong. The FVG was drawn to the tick, and the rule was followed. The question that mattered just could not be asked of the candles: what actually traded inside that gap?
A Fair Value Gap is a three candle pattern: the low of the third candle stays above the high of the first (or the reverse on the way down), and the zone between them is treated as a "void" price will come back to fill. That void does not exist. On a future trading continuously, every price in the zone was crossed by the middle candle, and the footprint shows what traded there, tick by tick and side by side. Yet an FVG is defined by two prices, while its footprint holds hundreds of numbers: thousands of different footprints draw exactly the same FVG, and they do not call for the same decision. A liquidity vacuum defends nothing, buying initiative can be defended, what a burst of stops pushed tends to unwind. Market impact research explains why: the part of a move that comes back is the part carried by flow with no information, and the nature of that flow can only be read in the footprint. Hence the rule of this article: an FVG is never traded on the candle alone. It is read twice in the footprint, when it is born and when price returns.
---
1. What an FVG is, exactly
The definition fits on one line. Take three consecutive candles. If the low of the third is above the high of the first, the range between those two prices is a bullish FVG. If the high of the third is below the low of the first, it is a bearish FVG. The middle candle, the impulse, is the only one that crossed the zone.
The term was popularised by ICT content, with a vocabulary that does most of the selling: the zone is an "inefficiency", a price where the market supposedly did not offer "fair value", and it should come back to "rebalance" it. The midpoint of the zone even has a name, consequent encroachment, presented as the reference entry level.
The idea is older than its name. Market Profile, developed by J. Peter Steidlmayer and distributed by the Chicago Board of Trade from 1985 (its history is in the article on volume profile), calls single prints the prices touched during a single thirty minute period. On a 30 minute chart, the zone of an FVG is exactly that, as long as price has not returned to it: prices visited by the impulse period alone. The session volume profile shows it too, as a trough, an LVN.
DeepCharts has its own detector, the FVG Identifier. Its help center sums it up this way: an FVG forms when price moves aggressively, leaving an imbalance between candles, and these areas often act as reaction zones. "Often" is the right word, and the tool's settings show why you cannot go further:
- Min num ticks and Max num ticks set the size of a valid FVG. Is a two tick hole on the NQ an FVG? You decide.
- % breakout sets how much of the zone has to be filled for it to count as mitigated or broken.
- Remove Line On Shadow Triggered deletes the zone as soon as a wick enters it, instead of waiting for a close.
- Max bars extension and Reset Start Day decide how long the zone stays "alive".
In other words, "the FVG got filled" is not an observation, it is the output of four settings. Like the 70% of the value area, the convention is useful as long as you know it is one. It says nothing about what happened inside the zone.
---
2. The gap is not empty
Look at what the middle candle does. On a CME future trading continuously, a bar opens on the first trade after the previous bar closes. So the impulse candle starts in the range of candle 1 and finishes in the range of candle 3: to get from one to the other, price crossed every tick of the FVG. The market avoided none of them: the zone only vanished from the drawing, because a candle sums up all its trades in four prices and none of those four prices falls inside the zone.
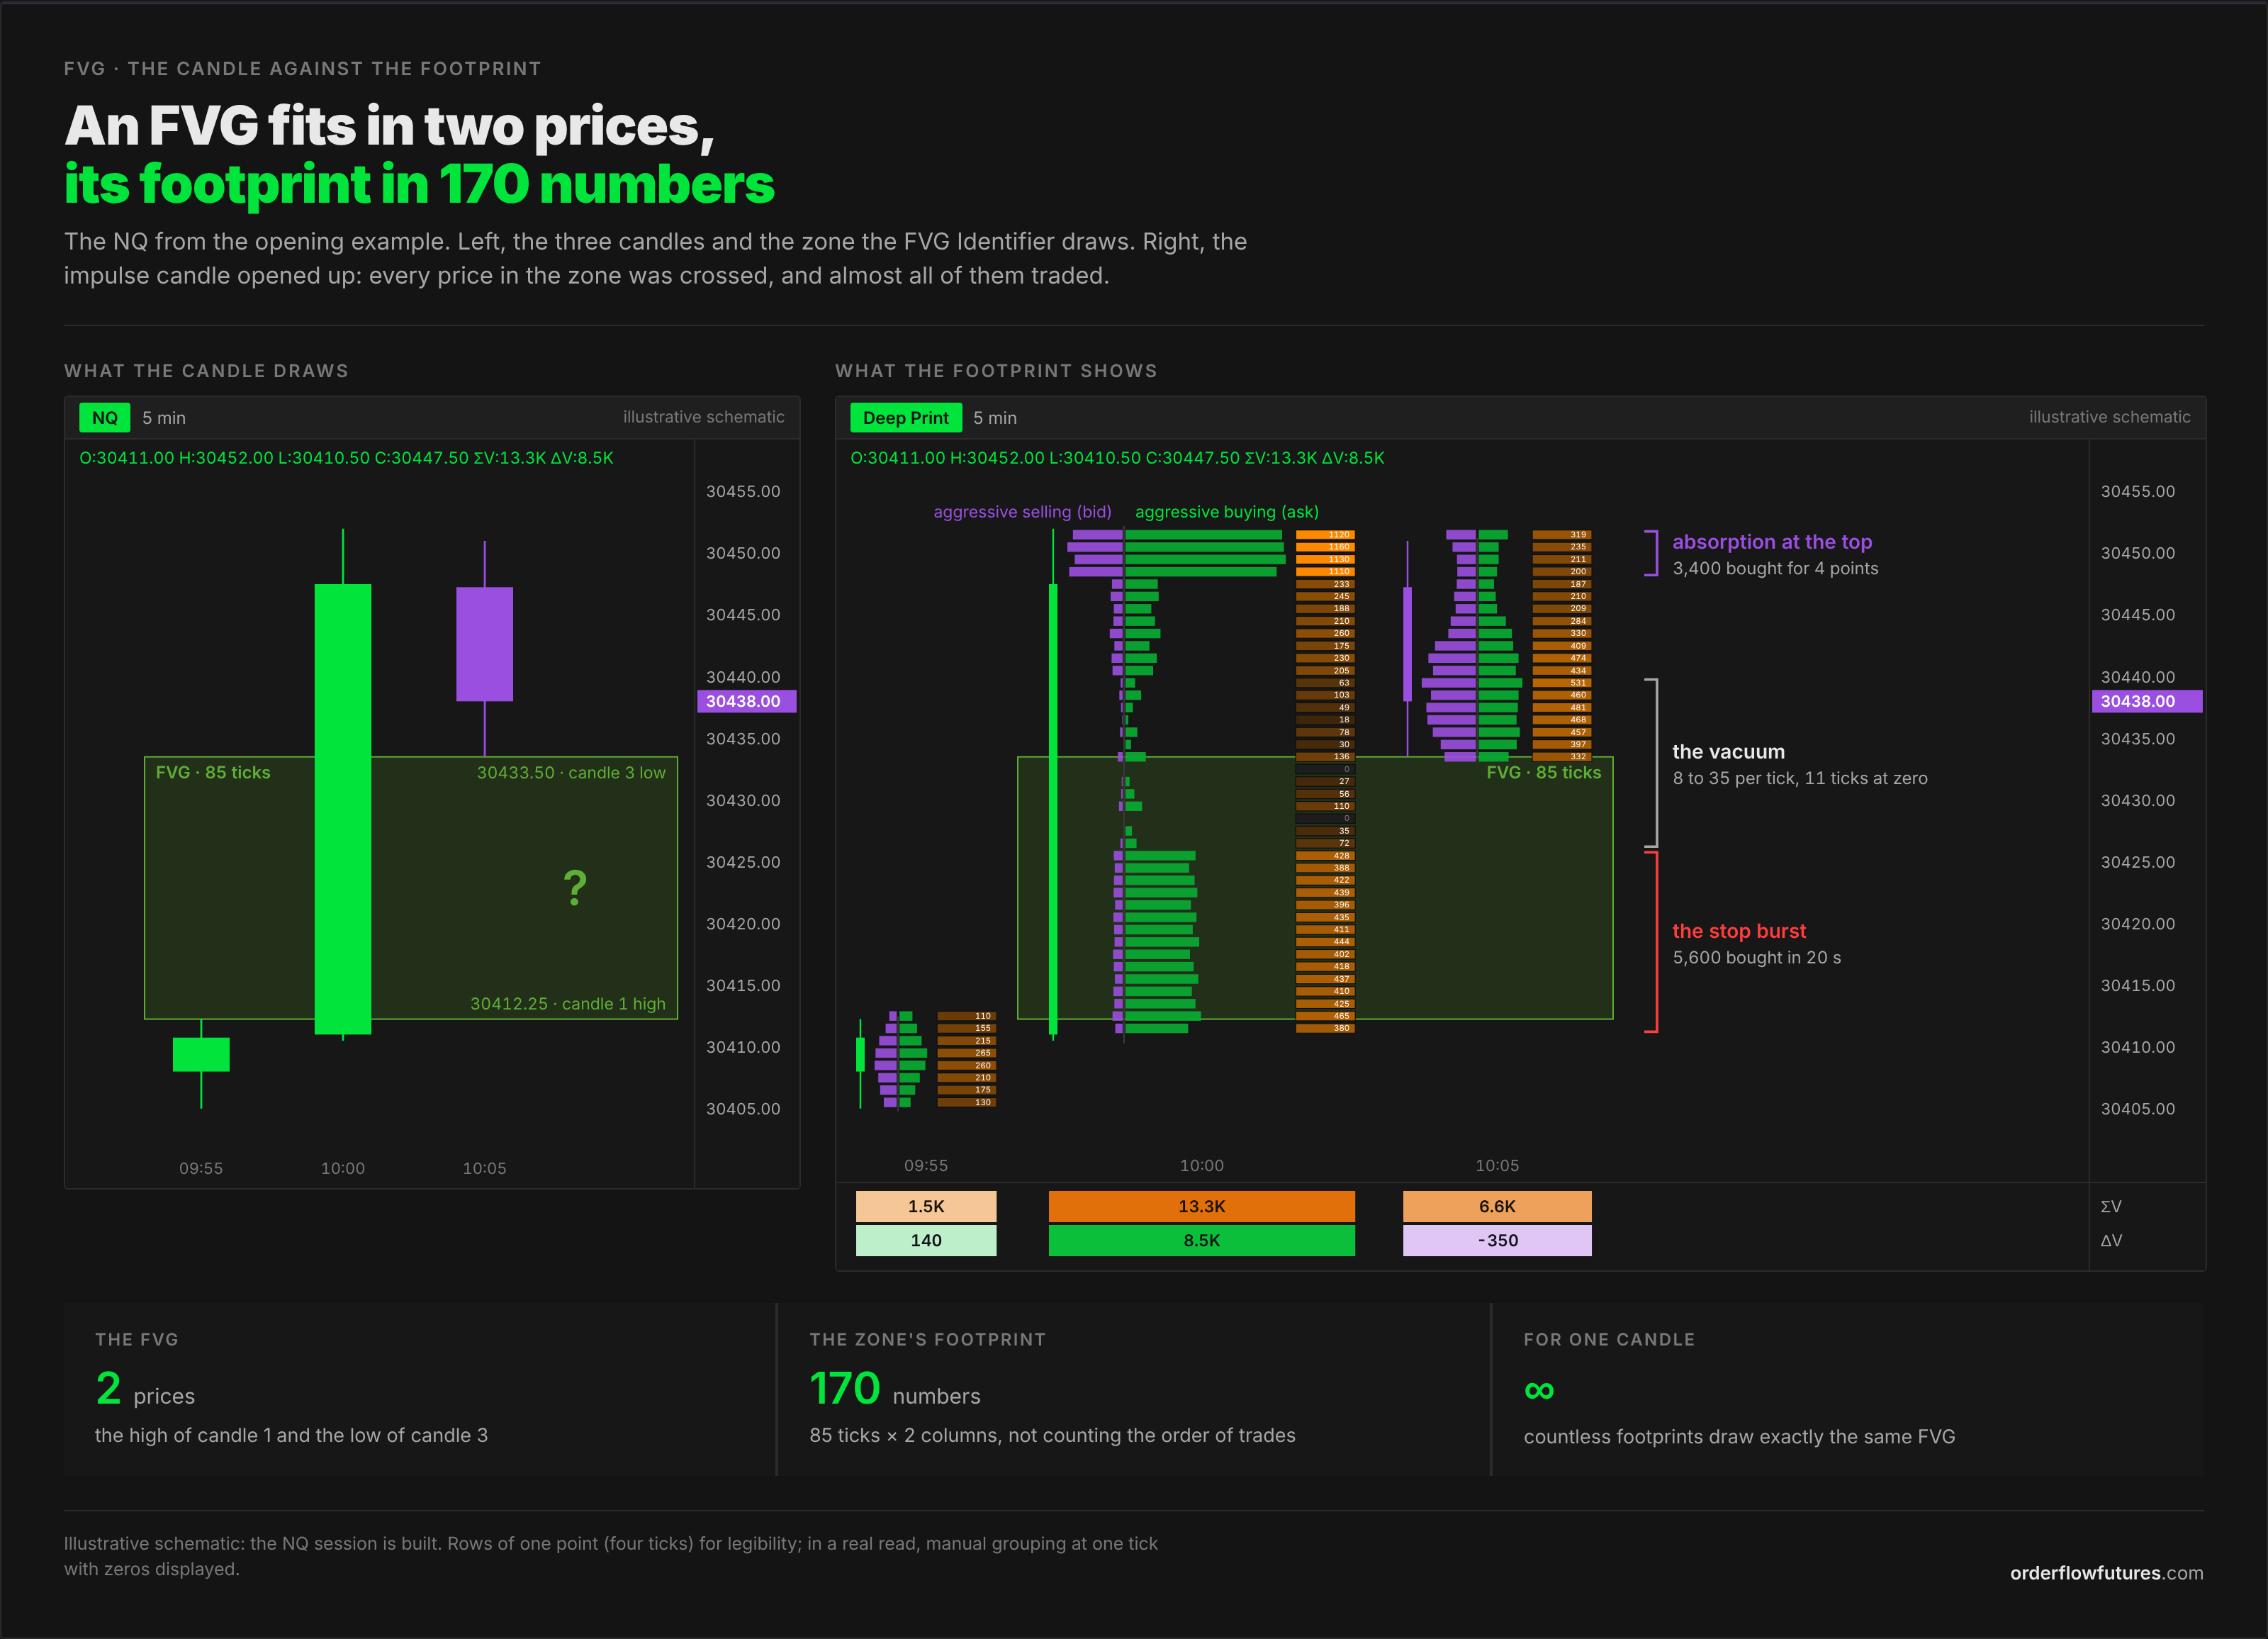
The footprint opens the candle. At each price it shows the volume executed by aggressive buyers (at the ask) and the volume executed by aggressive sellers (at the bid). Applied to the middle candle, it fills the gap: two numbers at every tick of the zone. On CME futures, those two numbers are not estimated. The aggressor side of every trade is declared by the exchange itself, as the article on cumulative delta explains.
Two clarifications, because they matter later.
Crossed does not mean traded. If a price had no resting order when the impulse went through, there was no trade at that price: the next trade printed directly one or more ticks further. The footprint shows it as a cell with zero on both sides. That is the only real "void" in an FVG, and it can be counted: one tick, five ticks, twenty. On the ES, with its thick book, it is rare outside news releases. On the NQ, it is more common in fast moves.
The only true hole is somewhere else. A price gap with no trade at all between two bars only appears when trading resumes: the daily 6 pm (New York time) reopen after the one hour break in index futures, the Sunday evening open, or the cash open on a chart limited to exchange hours. That is no longer an FVG, it is a gap, and DeepCharts handles it with a different tool, the Gap Detector.
---
3. One candle, a thousand footprints
Here is the central argument of this article. It needs no statistics.
A bullish FVG is fully determined by two numbers: the high of candle 1 and the low of candle 3. In the opening example, 30,412.25 and 30,433.50. The footprint of the same zone holds two numbers per tick, volume at the ask and volume at the bid: 170 numbers for the 85 ticks of the example, without counting the order in which those trades happened, or what happened just before and just after.
So a huge number of different footprints draw exactly the same FVG. A zone traded at 30 contracts per tick and a zone traded at 400 contracts per tick give the same candle. A rally made in five steady minutes and a rally made in twenty seconds followed by four minutes of nothing give the same candle too. So do a zone where sellers never hit the bid once and a zone where they hit it as much as buyers lifted the offer.
The logical consequence: a rule that only looks at candles gives the same answer to all of those footprints. It cannot do otherwise, since it cannot tell them apart. Adding price context, the trend, the time of day, yesterday's level, changes nothing: it is still a function of prices, blind to what traded inside the zone.
That would be fine if all those footprints told the same story. The next section shows they tell at least three, and that those stories call for opposite decisions when price returns. A candle rule then averages cases that contradict each other. Its hit rate, whatever it is, is a blend: the rate of the zones that were going to hold and the rate of the zones that were going to fail, in whatever proportion your sample happens to contain them. Change the sample, the contract or the period, and the proportion changes, so the result changes, without a single character of the rule changing.
That is why the footprint is not a comfort filter you add on top of the FVG. It is the only source that contains the missing information.
---
4. Three identical FVGs, three stories
Keep the three candles from the opening example exactly as they are, to the tick. Change only what is inside.
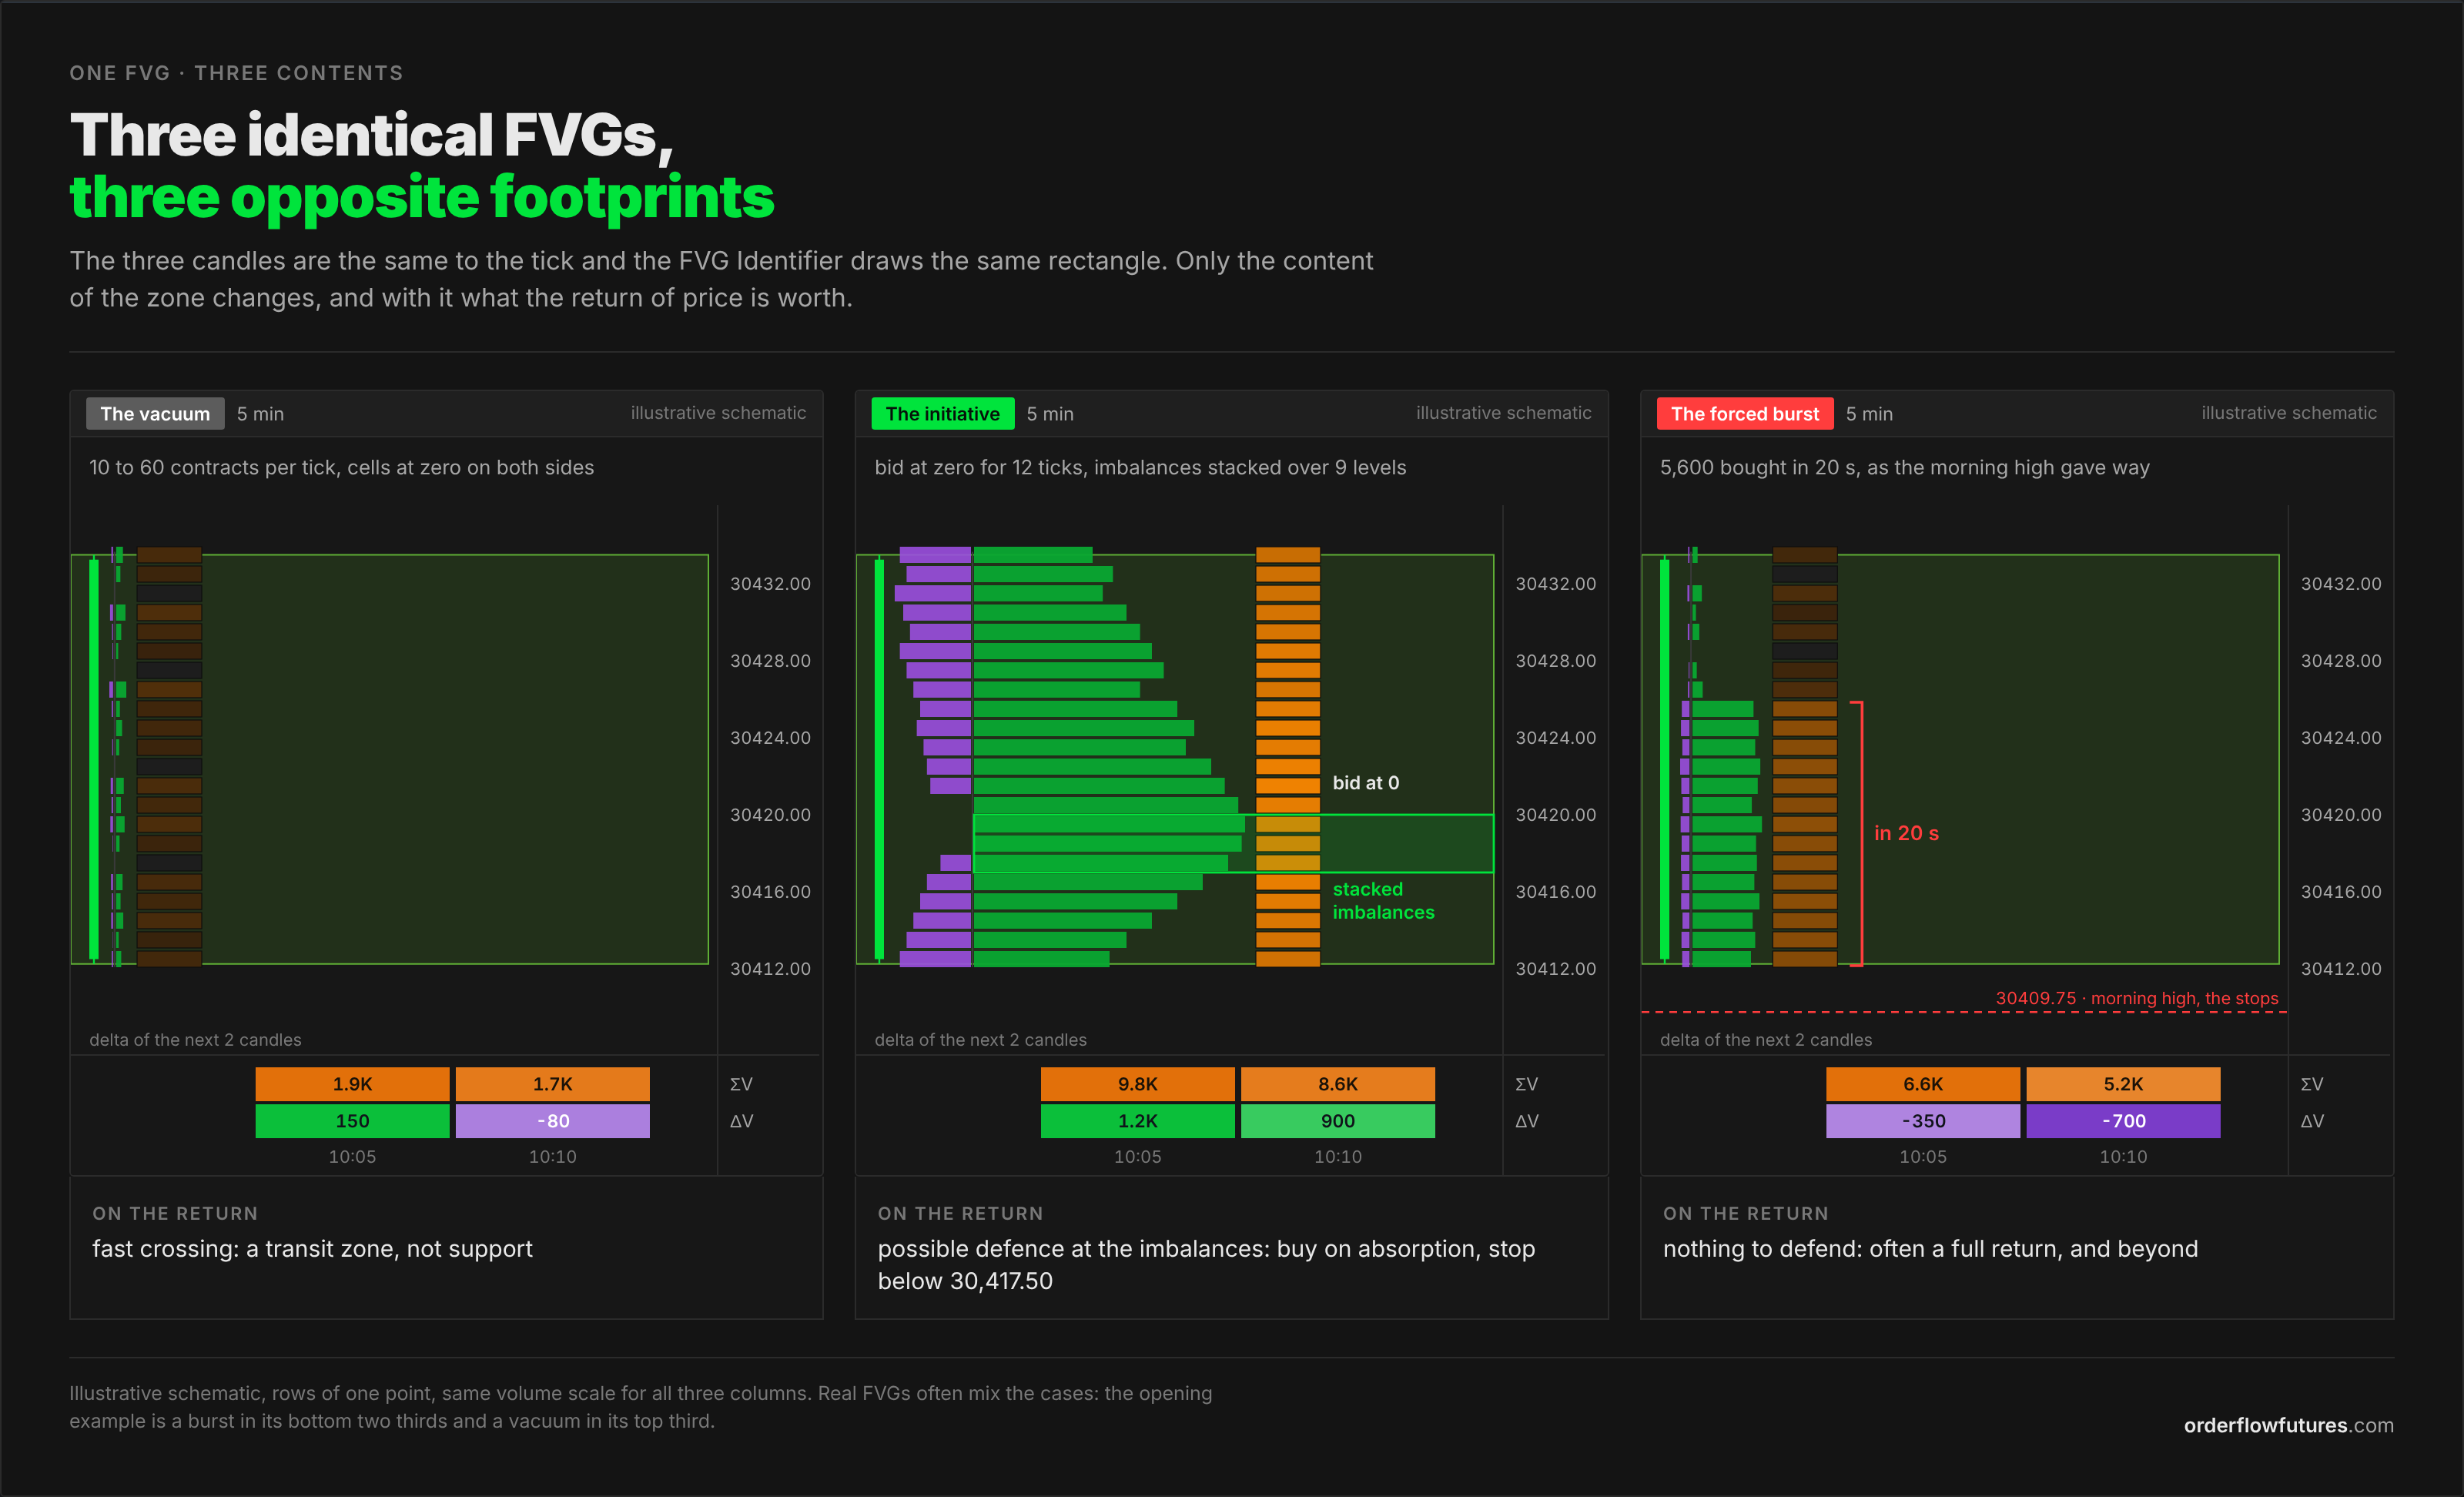
First footprint: the vacuum. In the zone, 10 to 60 contracts per tick, while the session trades several hundred at its busy prices, and about twenty cells at zero on both sides. Both columns are thin. Price was not pushed, it slid: sellers had pulled their offers, typically in the seconds around a data release, and a little buying was enough to move it. This is the "little effort, a lot of result" case from the effort and result article. Nobody built a position in the zone, so nobody has a reason to defend it. On the return, price crosses it as fast as it did on the way up. The FVG has a good chance of being filled, and that is precisely why it does not work as support.
Second footprint: the initiative. In the zone, 140 to 420 contracts per tick, spread over the five minutes of the candle. The aggressive buyers' column is full, while the sellers' column stays at zero for twelve consecutive ticks, from 30,418.00 to 30,420.75: at those prices, not one seller hit the bid. It is a one sided auction, a buyer paying the posted price tick after tick. Buying imbalances stack across nine levels, from 30,417.50 to 30,419.50. The high of the candle is a finished auction, with nothing traded at the bid. And above all, the aggression keeps going afterwards: delta on the next two candles is +1,200 then +900, on sustained volume. Someone chose to buy in this zone, paid to do it, and was not done. This FVG has a likely defender, and the footprint even says where: on the imbalance stack, not at the theoretical midpoint of the zone.
Third footprint: the forced burst. The rally starts the moment price crosses 30,409.75, the morning high, the level above which sellers' stops pile up. In twenty seconds, 5,600 contracts bought at market against 700 sold, from 30,411 to 30,426. Imbalances stack here too, which makes it the most dangerous look-alike of the initiative. But the burst stops dead, and delta on the following candles turns negative, −350 then −700, on half the volume. This is the mechanism described in the article on stop hunts: a triggered stop becomes a market order, and a burst of stops is borrowed effort. Nobody decided it, nobody will renew it, and nobody will defend prices bought under obligation.
| The vacuum | The initiative | The forced burst | |
|---|---|---|---|
| Volume per tick in the zone | Very low against the session, cells at zero | Normal to heavy, spread over the candle | High, and packed into a few seconds |
| The two columns | Both thin | One column empty over consecutive ticks | The aggressive column crushes the other |
| Stacked imbalances | Rare | Yes | Yes (the look-alike) |
| Starting point | Often a news release | A break out of balance | Just beyond an obvious level |
| Following candles | Calm returns | Delta renewed, volume sustained | Delta collapses or flips |
| When price returns | Fast crossing | Possible defence at the imbalances | No defence, often a full return |
| What the FVG is worth | A transit zone | A level to confirm on the return | A return target, not support |
Across the three footprints, the candle is the same. The FVG Identifier draws the same rectangle. A candle rule buys all three returns at the same price with the same stop. It is right on only one of the three, for a reason it cannot see.
Real FVGs often mix the cases, and the opening example is one of them: section 8 rereads it. But the three pure cases are enough to make the point. The decision changes with the content of the zone, and the content of the zone is only in the footprint.
---
5. Why price comes back, and why it does not always
The usual story says the market "has to" come back to rebalance the inefficiency. No mechanism forces it to. What does exist is well measured, and it explains the three cases better than the word "inefficiency".
The impact of a trade is not permanent. In 2004, Jean-Philippe Bouchaud, Yuval Gefen, Marc Potters and Matthieu Wyart analysed Paris Bourse data in Fluctuations and response in financial markets (Quantitative Finance). Their model: the effect of each trade on price fades over time. Two forces are always opposed, market orders that push persistently in the same direction, and limit orders that pull price back towards its previous levels. A move only holds if the first force keeps acting. They also find that only a small fraction of market orders genuinely anticipate the short term move: most aggression carries no information. Put simply, a move holds as long as someone keeps carrying it, and most of the people carrying it know nothing more than everyone else.
The book rebuilds. On the Paris Bourse, Hans Degryse, Frank de Jong, Maarten van Ravenswaaij and Gunther Wuyts measured in Aggressive Orders and the Resiliency of a Limit Order Market (Review of Finance, 2005) that after an aggressive order moves the price, the spread returns to normal within about twenty best limit updates, and the initial impact is partly reversed by subsequent trades.
After a large order, part of the way is travelled back. For metaorders, the large orders sliced and executed over minutes or hours, Doyne Farmer, Austin Gerig, Fabrizio Lillo and Henri Waelbroeck predict in How efficiency shapes market impact (Quantitative Finance, 2013) that once execution ends, price relaxes on average to about two thirds of peak impact. The same year, on real institutional orders, Nataliya Bershova and Dmitry Rakhlin measured permanent impact at roughly two thirds of the impact reached at the last fill (Quantitative Finance, 2013), with a fast decay in the first few minutes after it.
And the measurement that settles it: what comes back depends on information. Carla Gomes and Henri Waelbroeck separate, in Is market impact a measure of the information value of trades? (Quantitative Finance, 2015), institutional orders placed for cash flow reasons, which carry no information about price, from all the others. During execution, both push price the same way. The difference shows up afterwards. For cash flows, impact reverts almost completely, on average within two to five days. For the others, reversion erases only about a third of peak impact.
The caveats first. These studies cover equities, institutional orders and horizons from a few minutes to a few days. None of them measures NQ FVGs, and their numbers do not carry over as they are. What carries over is the mechanism, the one at work in any price-time priority order book, the CME's included.
Applied to the three footprints, it gives this:
- The forced burst is, by construction, flow with no information. Stops say nothing about future price, they say where traders agreed to lose. It is the category whose impact fades the most. Price coming back into the zone, and often beyond it, is the expected case.
- The vacuum has almost no impact to fade, since it had almost no flow. Price moved for lack of a counterparty, and it comes back as soon as a counterparty reappears.
- The initiative is the only case where the move can carry information and where aggression keeps going after the candle, Bouchaud's persistence. A partial return is still the norm: on the metaorders measured, about a third of the way is travelled back on average. But a defence of the zone becomes possible, and it can be checked.
Filling an FVG is therefore not a law of the market. It is the transient part of a move relaxing, and that part depends on the nature of the flow that produced it. The candle does not show that nature. The footprint does.
---
6. The return: where everything is decided
Reading the birth of the FVG classifies the zone. The decision itself is made when price returns, and it is made in the footprint again.
On an initiative zone, you look for absorption. Price comes back into the zone, sellers hit the bid, and price stops falling on the level of the stacked imbalances. The footprint shows selling volume piling up on two or three prices without getting through them: effort with no result, absorption. It is the trace of the impulse buyers, or of the ones who missed it, stepping back onto the bid. In the book, the same scene shows as size on the bid reloading after each hit, the mechanism of iceberg orders.
The entry comes at the end of the pressure, not during it. As long as sellers are hitting, nothing is settled: a level that absorbs can also give way. The signal is aggressive selling stopping, then the first lift of the offer. It is the same rule as for a CVD divergence or a stop hunt: you judge a level when the aggression testing it stops.
The stop goes below the defended level, not below the FVG. In the second footprint, the imbalance stack starts at 30,417.50. A stop at 30,417 has a precise meaning: if price trades there with selling volume and no absorption, the impulse buyers are no longer defending their price, and the read is wrong. From an entry at 30,420, that is three points of risk, or $60 per contract, against $450 with the textbook stop under the whole zone. The footprint does not just make the decision better, it makes the stop shorter, which counts double on a funded account (see the article on trailing drawdown).
On a forced burst, the return is not a buy. If there is a read to make, it is the opposite one: the rally started from a stop level, nothing relayed it, and price is heading back towards the level it started from. That is the "no relay" outcome from the stop hunt article.
On a vacuum, the past is not enough. The footprint says the zone was empty when the impulse crossed it. It does not say whether it still is: orders may have been placed there since. That is a question about the current book, and the liquidity heatmap answers it.
Everything above applies in mirror to a bearish FVG: a one sided auction on the selling side, stacked selling imbalances, a defence read as absorption at the offer on the return.
---
7. The rule, in five steps
It all fits into one routine, valid on any contract and any timeframe.
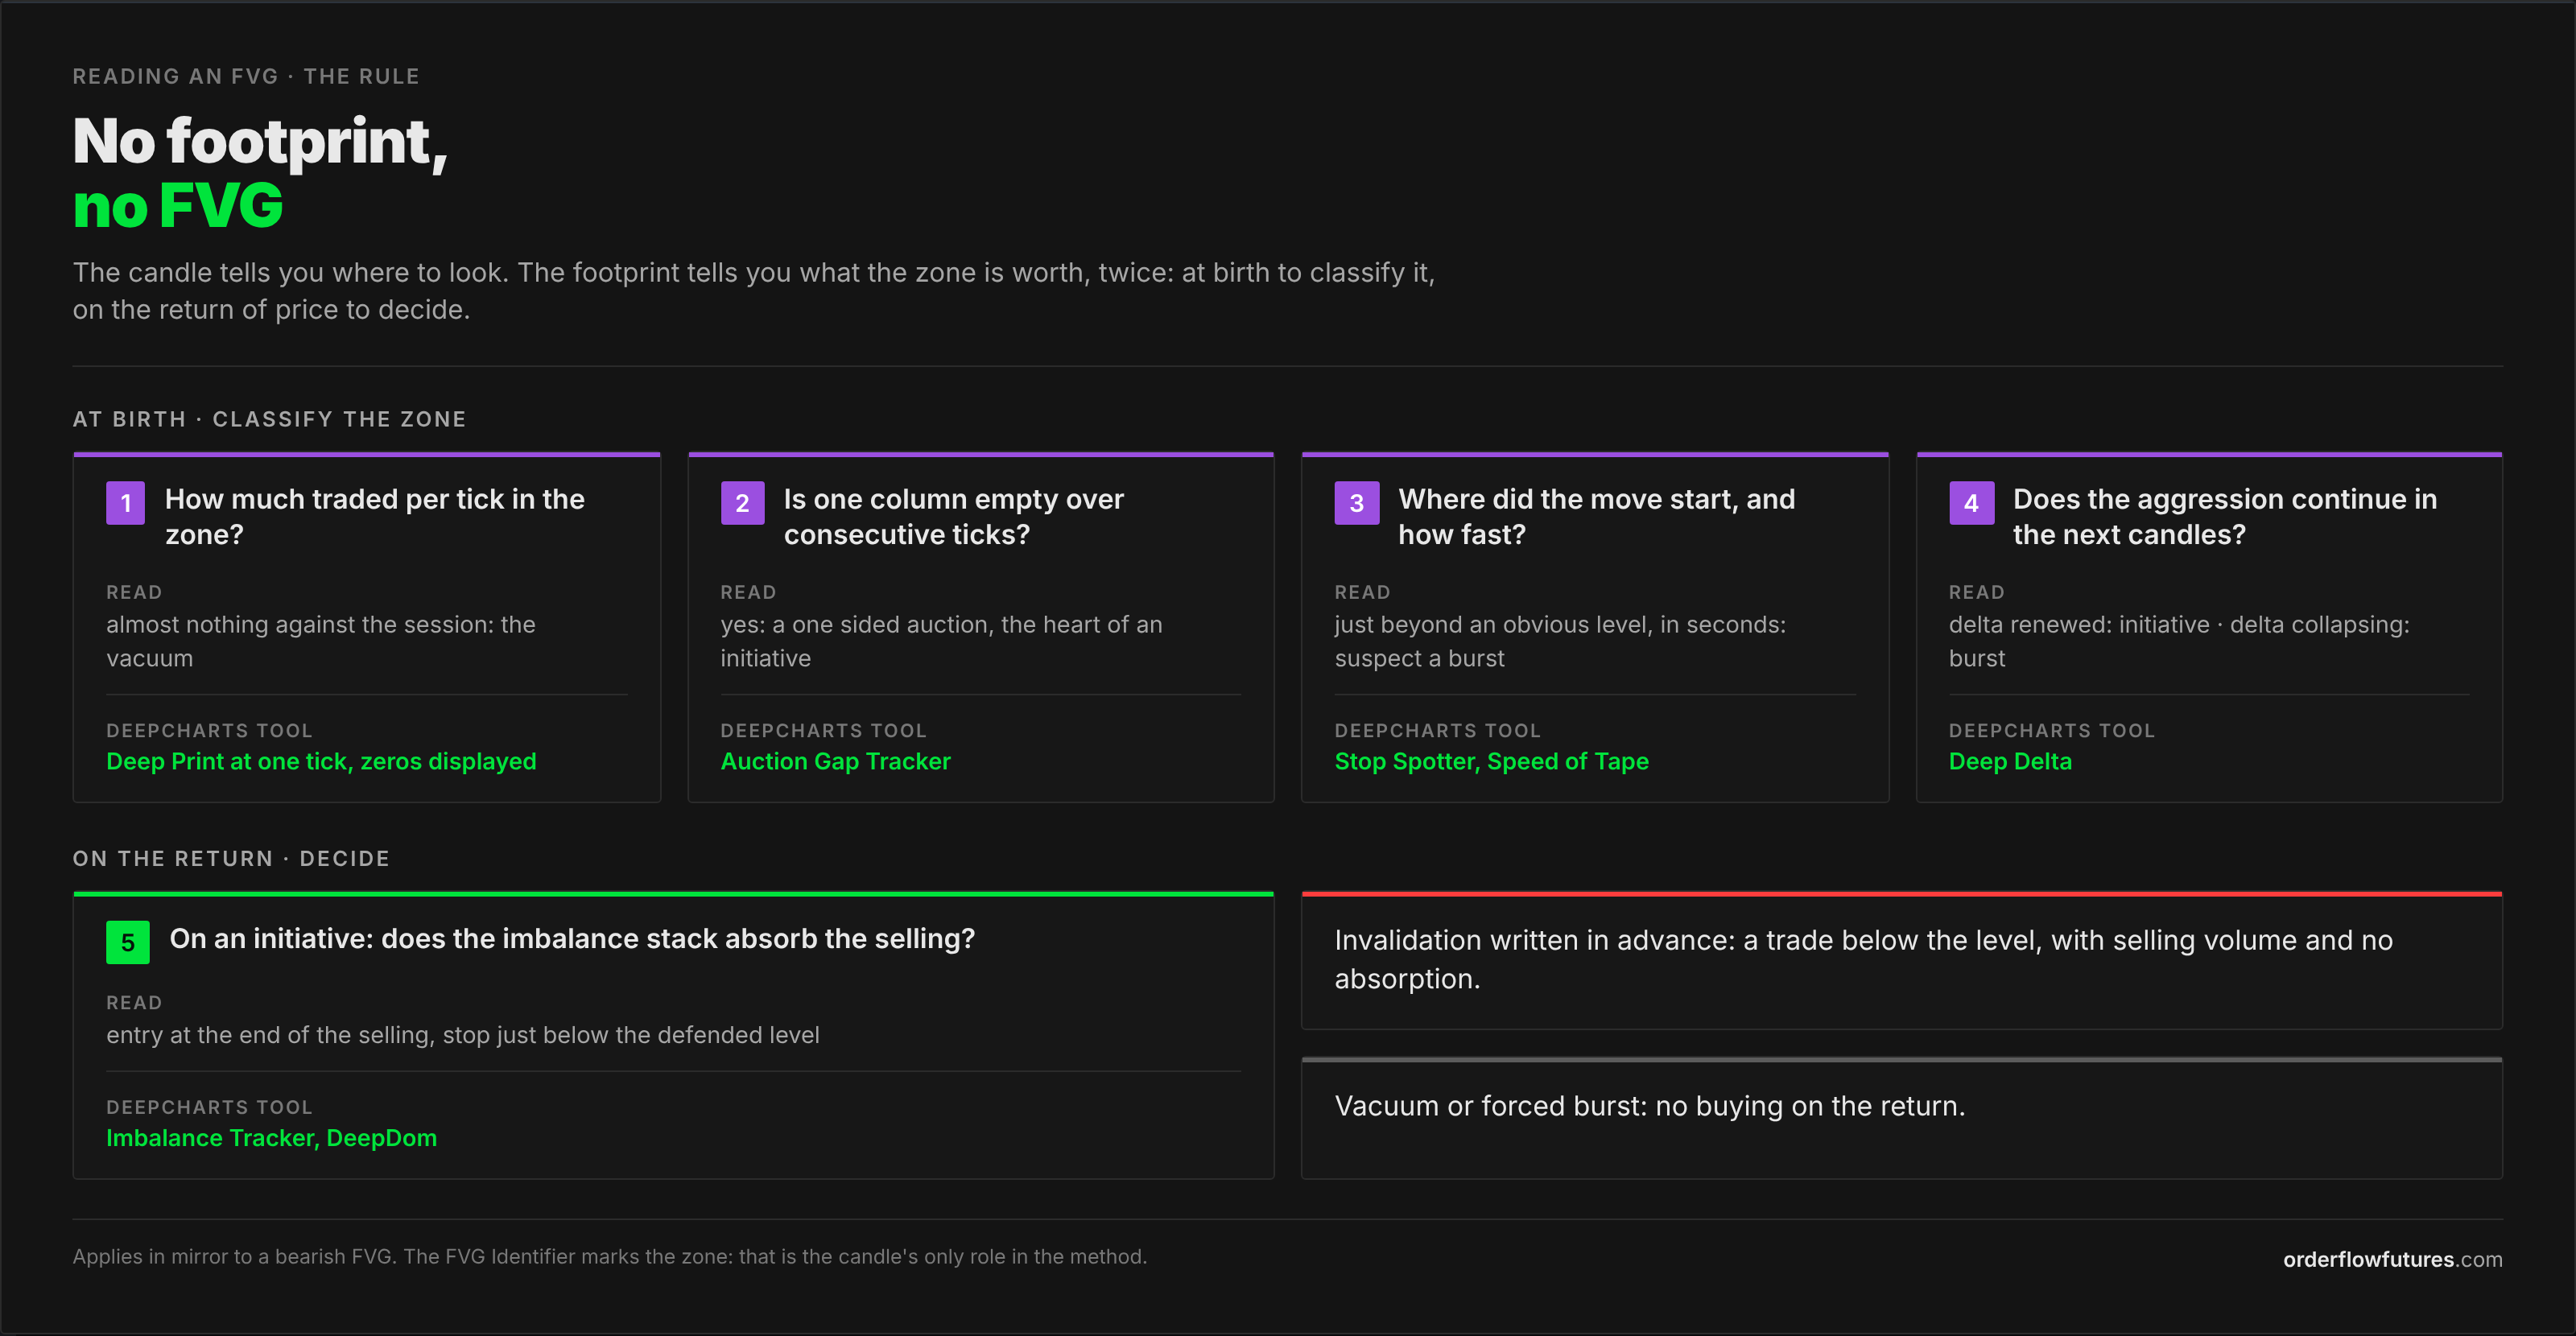
Step one, mark the zone. The FVG Identifier draws the rectangle. Set Min num ticks to ignore holes that mean nothing on your contract: on the NQ, a few ticks say nothing. That is the candle's only role in the method: telling you where to look.
Step two, open the impulse candle, tick by tick. Footprint in buy versus sell mode, manual grouping at one tick, zeros displayed. If prices are grouped by four or by eight, zero cells and one sided auctions disappear into the average. On a higher timeframe FVG, 30 minutes or one hour, open the impulse on a finer timeframe: a one hour candle adds up minutes that do not share the same story.
Step three, ask the four birth questions.
- How much traded per tick in the zone, compared with the busy prices of the same session? Almost nothing means a vacuum.
- Is one column empty over consecutive ticks? That is a one sided auction, the heart of an initiative.
- Where did the move start, and how fast? Just beyond a high, a low or a round number, in a few seconds: suspect a forced burst.
- Does the aggression continue in the following candles? Delta renewed on sustained volume means initiative. Delta collapsing means a burst.
Step four, place the level inside the zone. On an initiative, the level to defend is the imbalance stack or the one sided auction, where the buyer paid. It is almost never the theoretical midpoint of the FVG: consequent encroachment is a geometric convention, the imbalance stack is an execution trace.
Step five, wait for the return and write it down beforehand. Entry at the end of the selling pressure on the level, stop just below the level, invalidation written in advance: a trade below the level with selling volume and no absorption. On a burst or a vacuum, no buying on the return.
---
8. The opening example, reread
Back to Tuesday's NQ, with the routine.
The zone: from 30,412.25 to 30,433.50, 85 ticks. The FVG Identifier marks it without hesitation.
The opened candle: it holds two stories and a warning. From 30,411 to 30,426, the burst: 5,600 contracts bought at market against 700 sold, a delta of +4,900, all in the first twenty seconds of the candle, triggered as price crossed 30,409.75, the morning high. From 30,426 to 30,440, the vacuum: 8 to 35 contracts per tick and eleven cells at zero, in the top of the zone and just above it. Then the warning, at the top: from 30,448 to 30,452, 3,400 contracts bought at market for four points, more than twice the effort per point of the burst, and a close at 30,447.50, off the high. A passive seller absorbed the last buyers.
The following candles: delta of −350 at 10:05, −700 at 10:10, volume halved. Nobody relayed.
The diagnosis: the bottom two thirds of the FVG were bought by stops, the top third traded almost nothing, and the top of the candle was sold. Not one price in the zone was chosen by a buyer with a reason to defend it. Questions three and four answered "burst" before price even came back. Buying the edge of the zone was a bet on a defender who did not exist.
The return: at 10:45, no absorption in the zone, not a single row of selling volume parking anywhere. Price crosses it in one minute forty and keeps going below 30,411, where the burst started. That is the near complete reversion you expect from flow with no information.
With the second footprint, the initiative, the same candle would have deserved the buy, but not at the same place or with the same stop: on the imbalance stack, around 30,420, once the selling stopped, with a stop at 30,417. Same FVG, opposite decision, and a risk cut by a factor of seven and a half. None of it was in the candle.
---
9. Why DeepCharts is the tool for this
The method needs five reads on the same chart: the zone, the candle opened to the tick, both columns and their zeros, the stacked imbalances, and delta on the following candles. Then a sixth on the return, the book. So the test for a tool is not whether it has an FVG detector, those are everywhere. It is whether the detector sits on top of a complete footprint, with the reads that answer the four questions, documented and adjustable to the tick. That is what DeepChart, DeepCharts' charting software, does, and that is why it is the tool we use and recommend for reading an FVG.
| The question | The DeepCharts tool | The setting that matters |
|---|---|---|
| Where is the zone? | FVG Identifier | Min and Max num ticks, % breakout, Remove Line On Shadow Triggered |
| What traded inside the zone? | Deep Print, the footprint | Type Ask/Bid Split, manual grouping at one tick, Show Texts-by-Zeros |
| Is one column empty over several ticks? | Auction Gap Tracker | Threshold-max. unfinished at 0, Min. Num. Of Consecutive Zero, Intrabar mode |
| Are imbalances stacking? | Imbalance Tracker | Minimum Imbalance %, Minimum Volume Diff, Min. Num. Of Consecutive Imb |
| Does the start look like a stop hunt? | Stop Spotter, Speed of Tape | Delta, volume spike, candle body, consecutive imbalances |
| Does the aggression continue? | Deep Delta | Delta per bar on the candles after the impulse |
| On the return, who defends? | Deep Print, then DeepDom for the book | Absorption in the footprint, reloading in the book |
A few details from the help center, because they make the difference in practice.
Deep Print shows volume, the buy versus sell split, delta, or delta with total volume, in profile or box mode. Tick grouping can be automatic or manual: to read an FVG, set it to manual at one tick. The Show Texts-by-Zeros option displays zeros in the cells, and it is what makes prices crossed without a trade visible. Coloring can be calculated on imbalance, with a minimum volume threshold and an option to include zeros. Single Prints can be highlighted. And up to four footprint columns can be shown side by side, for example buy versus sell next to delta, to read the same candle twice without switching screens.
The Auction Gap Tracker is, in practice, the footprint version of the FVG. The help center defines it as spotting the areas where one side did not take part, aggressive buyers or aggressive sellers missing across several consecutive prices. With the threshold at zero, it only plots true zeros; at one, it also includes prices where a single contract traded on one side. The minimum number of consecutive zeros and the Intrabar mode, which ignores the candle's extremes, make it exactly the detector of the one sided auction in the second footprint. Where the FVG Identifier says "a hole between candles", the Auction Gap Tracker says "a hole in one column", and it is the second one that carries the information.
The Imbalance Tracker marks stacked imbalances and extends them into zones. A zone stays "fresh" until price comes back to it and becomes "triggered" when price touches or breaks it, depending on the Trigger Only Touch setting. That is the level from step four, drawn for you.
The Stop Spotter looks for the signature of a stop hunt on a candle: delta percentage, minimum volume, volume increase against previous candles, body size, consecutive imbalances. It answers question three, with one caveat the help center does not spell out: a violent initiative can have the same signature on a single candle. Question four, what happens next, is what settles it.
The book on the return is read in DeepDom, which you can buy on its own, with its own licence: heatmap, Iceberg Detector and Deep Reload to see a defence that keeps reloading. There is no native macOS version; on a Mac it runs in Parallels Desktop.
A note on data, so you do not pay for what you do not need. The footprint, imbalances and delta only need the side of each trade, which comes with Level 1 on the CME. Depth, and MBO for the fine reads of the book, only matter for the sixth read, on the return. The difference is explained in the article on MBO vs MBP.
Check all of this yourself before believing this article. Two ways, one of them free.
- DeepCharts Web, the browser version released on November 1, 2026, is free on CME futures delayed by fifteen minutes, and Deep Print and the Imbalance Tracker are among the tools highlighted at launch. An FVG is read after the fact: a fifteen minute delay does not stop you from opening an impulse candle and counting its zeros. Stick to futures or crypto, not CFDs, whose volume is not the market's. The FVG Identifier and the Auction Gap Tracker are documented for the desktop software; in the browser, you spot the FVG by eye, in three candles.
- Deep Replay, in the desktop software (Options > Replay Tick Data), replays a past session tick by tick. Take your last twenty FVGs, classify each one with the four questions without looking at what came next, then replay the return. That is the only sample that counts: yours, on your contract, with your exit rule.
Activate DeepCharts →: promo code OFF comes already filled in: an extra 10% off every plan, monthly or yearly, on top of whatever discount DeepCharts is running. Not using the link? Enter OFF at the Payment step. Details and per-plan math: DeepCharts promo code.
For the full version of this read on the ES, with the screen set up and setups with numbers, the ES order flow course lists the FVG among the detectors of the execution window, to be crossed with the troughs of the profile.
---
10. What this article does not say
- That FVGs are useless. They do point to a zone worth looking at: prices crossed fast, visited by a single candle. That is an honest starting point. The trouble is with where people take it.
- That the footprint predicts the future. It says how the move was produced and who defends the zone on the return. The decision stays conditional, and it always has an invalidation.
- A fill rate or a hit rate. No such number is given here. Section 3 explains why such a number, measured on candles alone, blends opposite cases: it depends on the sample more than on the rule.
- That the impact numbers apply to the NQ as they are. They come from equities, institutional orders and horizons from a few minutes to a few days. What carries over is the mechanism.
- That every FVG fits one of the three boxes. Real ones often mix the cases, like the opening example. The four questions exist precisely to cut the zone into parts.
- That DeepCharts is the only software with a footprint. It is not. The argument is elsewhere: the detector, the tick level footprint, the Auction Gap Tracker, the Imbalance Tracker, the Stop Spotter and delta, documented and brought together on the same chart, with replay to test your own practice.
- That the example numbers are real. The NQ session is built to illustrate the mechanism, with realistic orders of magnitude, and the diagrams are diagrams.
---
Frequently asked questions
What is a Fair Value Gap (FVG) in trading?
A Fair Value Gap is a three candle pattern: when the low of the third candle stays above the high of the first, the zone between those two prices is a bullish FVG (the reverse for a bearish FVG). Only the middle candle, the impulse, crossed that zone. The term was popularised by ICT content, but the idea goes back to the single prints of the CBOT's Market Profile, distributed from 1985.
Does an FVG always get filled?
No, and filling is not a law. Market impact research shows that part of a move fades afterwards, and that this part depends on the flow that produced it: almost all of it for flow with no information, such as a burst of stops, only part of it when the move carried information. Even the notion of "filled" is a setting: in DeepCharts' FVG Identifier, you choose the share of the zone that has to be filled and whether a wick or a close counts.
How do you trade an FVG with the footprint?
By reading the zone twice. At birth, open the impulse candle to the tick and ask four questions: how much traded per tick, is one column empty over consecutive ticks, where did the move start, does the aggression continue afterwards. On the return, only buy an initiative zone on absorption at the level of the stacked imbalances, at the end of the selling pressure, with a stop just below that level. Neither the vacuum nor the forced burst is a buy on the return.
What is the difference between an FVG, an imbalance and an LVN?
The FVG is a candle pattern, defined by two prices. The imbalance is a footprint measurement: at one price, aggressive volume on one side crushes the other, and stacked over several levels, imbalances are the signature of an initiative. The LVN, or low volume node, is a lightly traded price on the session profile. An FVG zone is almost always a trough in the profile; it is only a defensible level if its footprint shows an initiative, which only imbalances and empty columns reveal.
Which timeframe should you read an FVG on?
You can spot the FVG on the timeframe of your choice, but you read it on the impulse candle opened to the tick. On a 30 minute or one hour FVG, open the impulse on a finer timeframe: a long candle adds up moments that do not share the same story, and a twenty second burst and forty minutes of initiative can produce the same total.
Do you need MBO data to read an FVG in the footprint?
No. The footprint, imbalances and delta only need the aggressor side of each trade, which the CME publishes with Level 1. Book depth, and MBO for the fine reads, matter on the return, to see a defence reloading in the book. The footprint is enough to classify the zone, the book helps confirm the defence.
How should you set up DeepCharts' FVG Identifier?
Set Min num ticks to ignore holes too small for your contract and Max num ticks to filter out oversized impulses, use % breakout to choose how much of the zone has to be filled for it to count as filled, and decide with Remove Line On Shadow Triggered whether a wick is enough. Then put the Deep Print footprint at one tick, the Auction Gap Tracker and the Imbalance Tracker under the detector: the FVG Identifier tells you where to look, the footprint tells you what the zone is worth.
Latest decoded trading sessions
A real trading day read live on the heatmap and the footprint: macro events, the levels that held, and every read with its DeepCharts screenshot.
- ESThursday, November 12, 2026Possible ouster of Jensen Huang drags Nvidia lower and weighs on the ES
- ESWednesday, November 11, 2026Tech takes back the lead behind Nvidia and CoreWeave, bond market closed
- NQWednesday, November 11, 2026Semiconductors lift the Nasdaq 100 after CoreWeave's results
Want to get better at order flow?
We discuss flow, liquidity and our trades live, every day, on the OrderFlowFutures Discord. Join us, it's free.
Join the Discord for free12 online·118 members·Free · instant access
Read next
Get the new guides
One email when we publish an OrderFlow or Heatmap guide. No spam, one-click unsubscribe.
By subscribing, you agree to receive our emails. Educational content, not investment advice.