Cumulative delta (CVD): divergence is not a signal, here is what it really measures
Published · 19 min read
By Tom · Trader & founder of OrderFlowFutures
CVD has no zero, and price follows the book, not delta. Why a CVD divergence is not a signal, and the only one that is a fact.
ES, 10:40 in New York. Price trades three points above the morning high. Under the chart, the session's cumulative delta does the opposite: its high of the day was printed at 9:50, and it now sits 4,200 contracts lower. It is the bearish divergence exactly as every textbook draws it, price at a higher high, CVD at a lower high. You sell the new high with a stop two points above.
Forty minutes later, the ES is nine points higher. The CVD kept falling the whole way up.
Nothing unusual happened. The only thing missing was reading the CVD for what it is: a count of just one of the three ways price can rise.
CVD (Cumulative Volume Delta) adds up, trade after trade, the volume of aggressive buyers minus that of aggressive sellers since a chosen starting point. It therefore has no natural zero: its value, and sometimes the divergence itself, changes when you change that starting point. Above all, price does not follow delta, it follows the order book: microstructure research shows that the imbalance at the best bid and ask, limit orders and cancellations included, explains price changes twice as well as trade imbalance alone. Price rising while CVD falls is therefore a normal case, not an anomaly. Of the two divergences, only one is a usable fact: CVD rising while price does not follow is aggression being absorbed at a level. The other one is read in the book, not in the line.
---
1. What CVD counts, exactly
Every contract traded has a buyer and a seller. There are always exactly as many purchases as sales, to the contract. So delta does not count "more buyers than sellers", a phrase you read everywhere that means nothing. It counts who crossed the spread: the side that accepted the price displayed by the other, instead of waiting to be filled.
A bar's delta is the sum of those aggressive volumes, buys minus sells. Cumulative delta, or CVD, adds those deltas one after the other from a starting point. It is a balance line, like a bank statement: every aggressive buy pushes it up by its size, every aggressive sell pulls it down.
On CME Globex, knowing who was the aggressor takes no inference. The Trade Summary message of the MDP 3.0 feed carries a dedicated field, tag 5797 AggressorSide, which CME's documentation describes this way: it indicates which side is the aggressor, or whether there is no aggressor. Value 1 when the aggressor is the buyer, 2 when it is the seller. The same page says what a Trade Summary groups together: all the orders that traded together as the result of a single aggressing order, an elected stop order, a mass quote or a market state event.
Three consequences for your line, which few people mention.
Elected stops count as aggression. A stop that fires becomes a market order, so an aggressor, and it pushes the CVD exactly like a buyer or seller who chose to aggress. A burst of stops prints a delta spike nobody decided on and nobody will renew. The mechanism is covered in the article on stop hunts: on the CVD it shows up as a sharp step, followed by a flat line.
Some trades have no aggressor. Matches that follow a market state event, typically the open after a pre-open phase, have neither an aggressive buyer nor an aggressive seller. Depending on the platform, that volume is ignored or split, and it is one of the reasons two programs do not always show the same CVD on the same contract.
Without that field, the side is guessed. On markets or feeds that do not carry it, a classification rule is applied, the best known being Lee and Ready (1991): compare the trade price with the midpoint of the spread, and failing that with the previous trade. Tested on data where the true side was known, it correctly classifies about 81% of trades on Nasdaq, against 78% for the plain tick rule (Ellis, Michaely and O'Hara, 2000). One trade in five on the wrong side, with the errors concentrated in fast bursts, where the book moves between two prints. On a CVD those errors do not cancel out: they add up.
On CME futures the problem is solved at the source, provided your platform reads the field instead of recomputing a side.
---
2. CVD has no zero
This is the point most reads miss.
A running sum depends on where it starts. ES CVD reset at the Globex reopen, 6 pm New York time the previous evening, contains the whole night, Asia and Europe included. CVD reset at the cash open, 9:30, contains none of it. During the cash session the two lines have exactly the same shape: they differ only by a constant, the delta accumulated overnight. One can read +6,000 while the other reads −2,000 at the same moment.
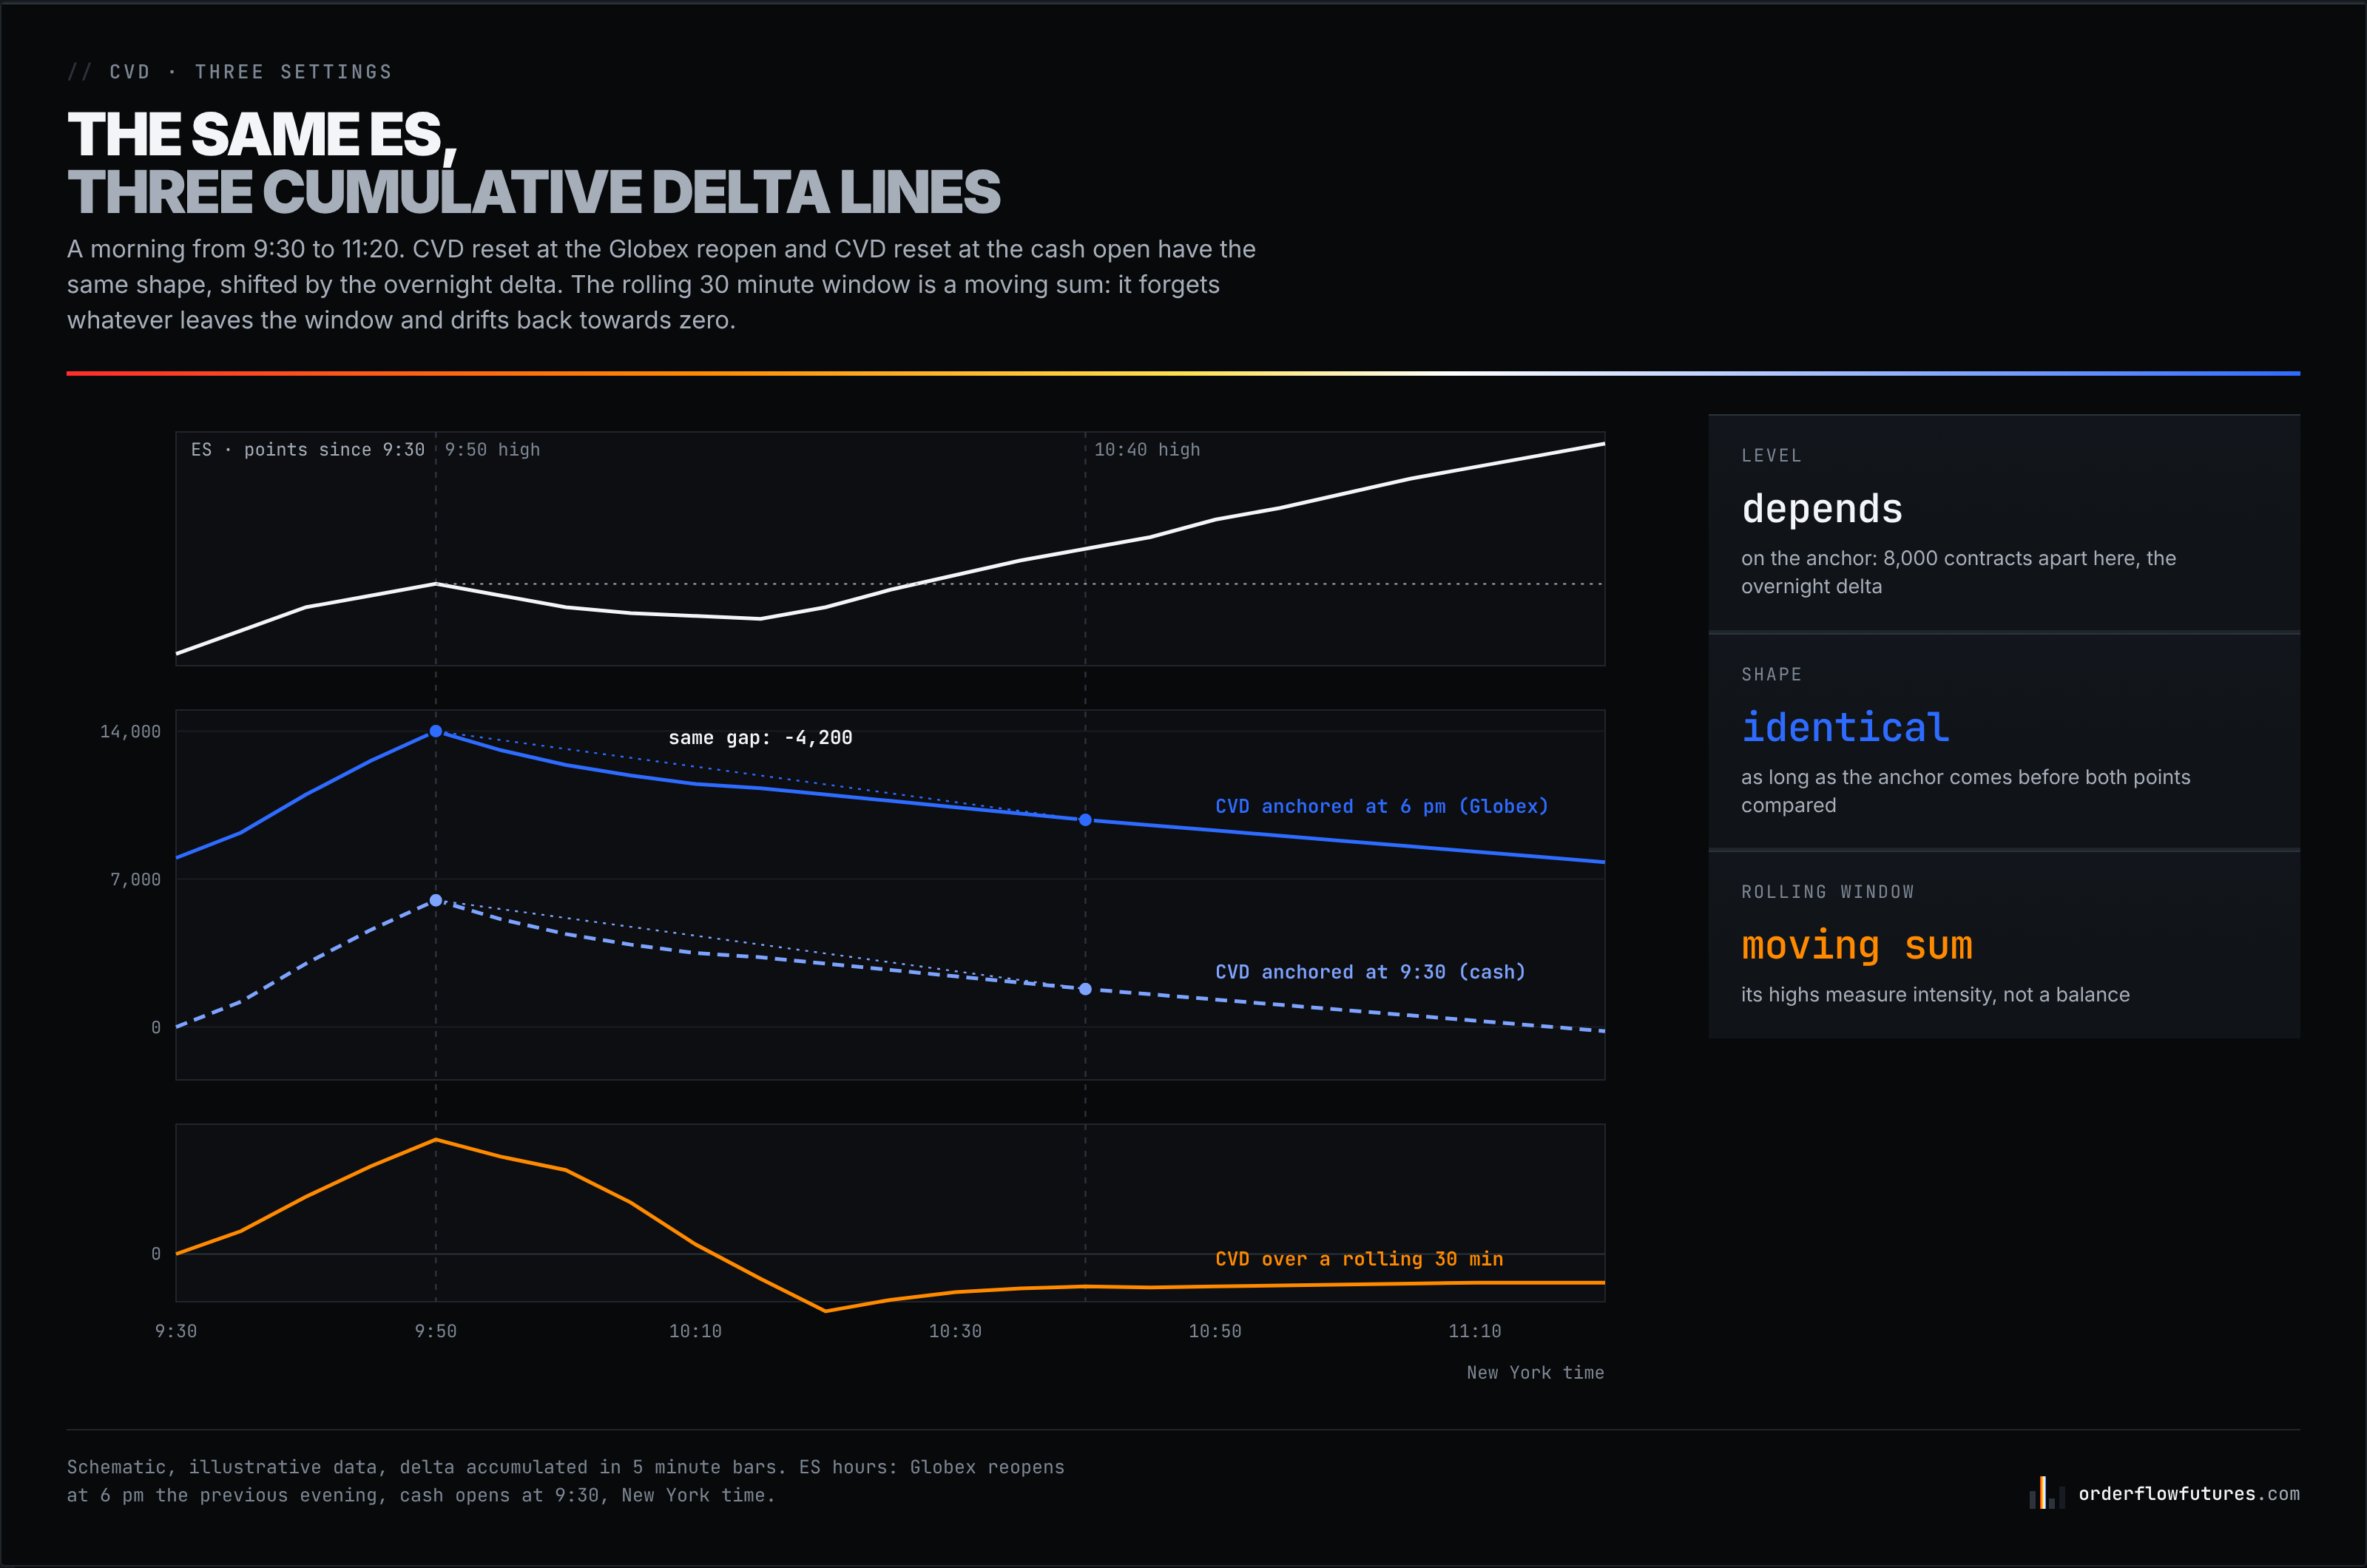
Three consequences, which are not worth the same.
The level means nothing. "CVD is at +12,000" only makes sense for a given starting point, and never from one day to the next. A CVD can be positive purely because the night was buying.
The shape does not change as long as the starting point comes before both points you compare. The divergence in the opening scene, between 9:50 and 10:40, is the same on Globex CVD and on session CVD: an earlier anchor shifts the whole line, it does not redraw it. On the other hand, comparing the overnight high with the morning high is only possible on Globex CVD: the session one does not even contain the first point.
A rolling window no longer measures the same thing. Delta accumulated over the last thirty minutes keeps forgetting whatever leaves the window: it is no longer a balance, it is a moving sum. Its highs mark the moments when aggression was strongest over thirty minutes, not a state of the session, and they do not necessarily land where the highs of an anchored line do.
DeepCharts leaves that choice to the user in DeepDom's CVD module: the help center defines CVD as tick by tick cumulative delta over a user defined period. Period Mode sets the unit of that period (days, minutes, seconds or number of orders) and Period Value its length, for example one day or thirty minutes. Changing that setting does not correct the CVD. It changes the question you are asking it.
Three rules follow:
- Never compare two CVD levels taken from different starting points, or from one day to the next.
- Compare slopes, not levels. What matters is the delta accumulated during the price move you are looking at: how far the CVD travelled between the start and the end of the push.
- Use a starting point earlier than both points you compare. Globex to set the night against the session, the session for two highs of the cash session. A short window is for measuring the intensity of a push, not for hunting divergences.
---
3. Price does not follow delta, it follows the book
This is the heart of the article, and the real reason the ES in the opening scene could rise with a falling CVD.
Price moves when the best limit on one side disappears. It can disappear in two ways: be consumed by aggressive orders, or be cancelled by whoever posted it. And a new price can also form with no execution at all, when a buyer posts a limit above the best bid. CVD only sees the first of those three things.
In 2014, Rama Cont, Arseniy Kukanov and Sasha Stoikov measured the effect of those three kinds of events on price in The Price Impact of Order Book Events (Journal of Financial Econometrics), on one month of data for 50 US stocks, April 2010, cut into ten second intervals. Their variable, order flow imbalance, adds up at the best prices the limit orders added, the cancellations and the executions. The result is clear: that imbalance explains on average 65% of the variance of price changes, against 32% for trade imbalance alone, in other words delta. The authors conclude that the relation between price changes and traded volume is noisy, and less robust than the one that runs through the book.
Two caveats before going further. The study covers stocks, not futures. And an R² of 32% is not nothing: delta explains a real share of the move. But the mechanism measured is that of any price time priority book, CME's included: delta is only one of the three forces that move the best price, and the most visible one is not necessarily the most important.
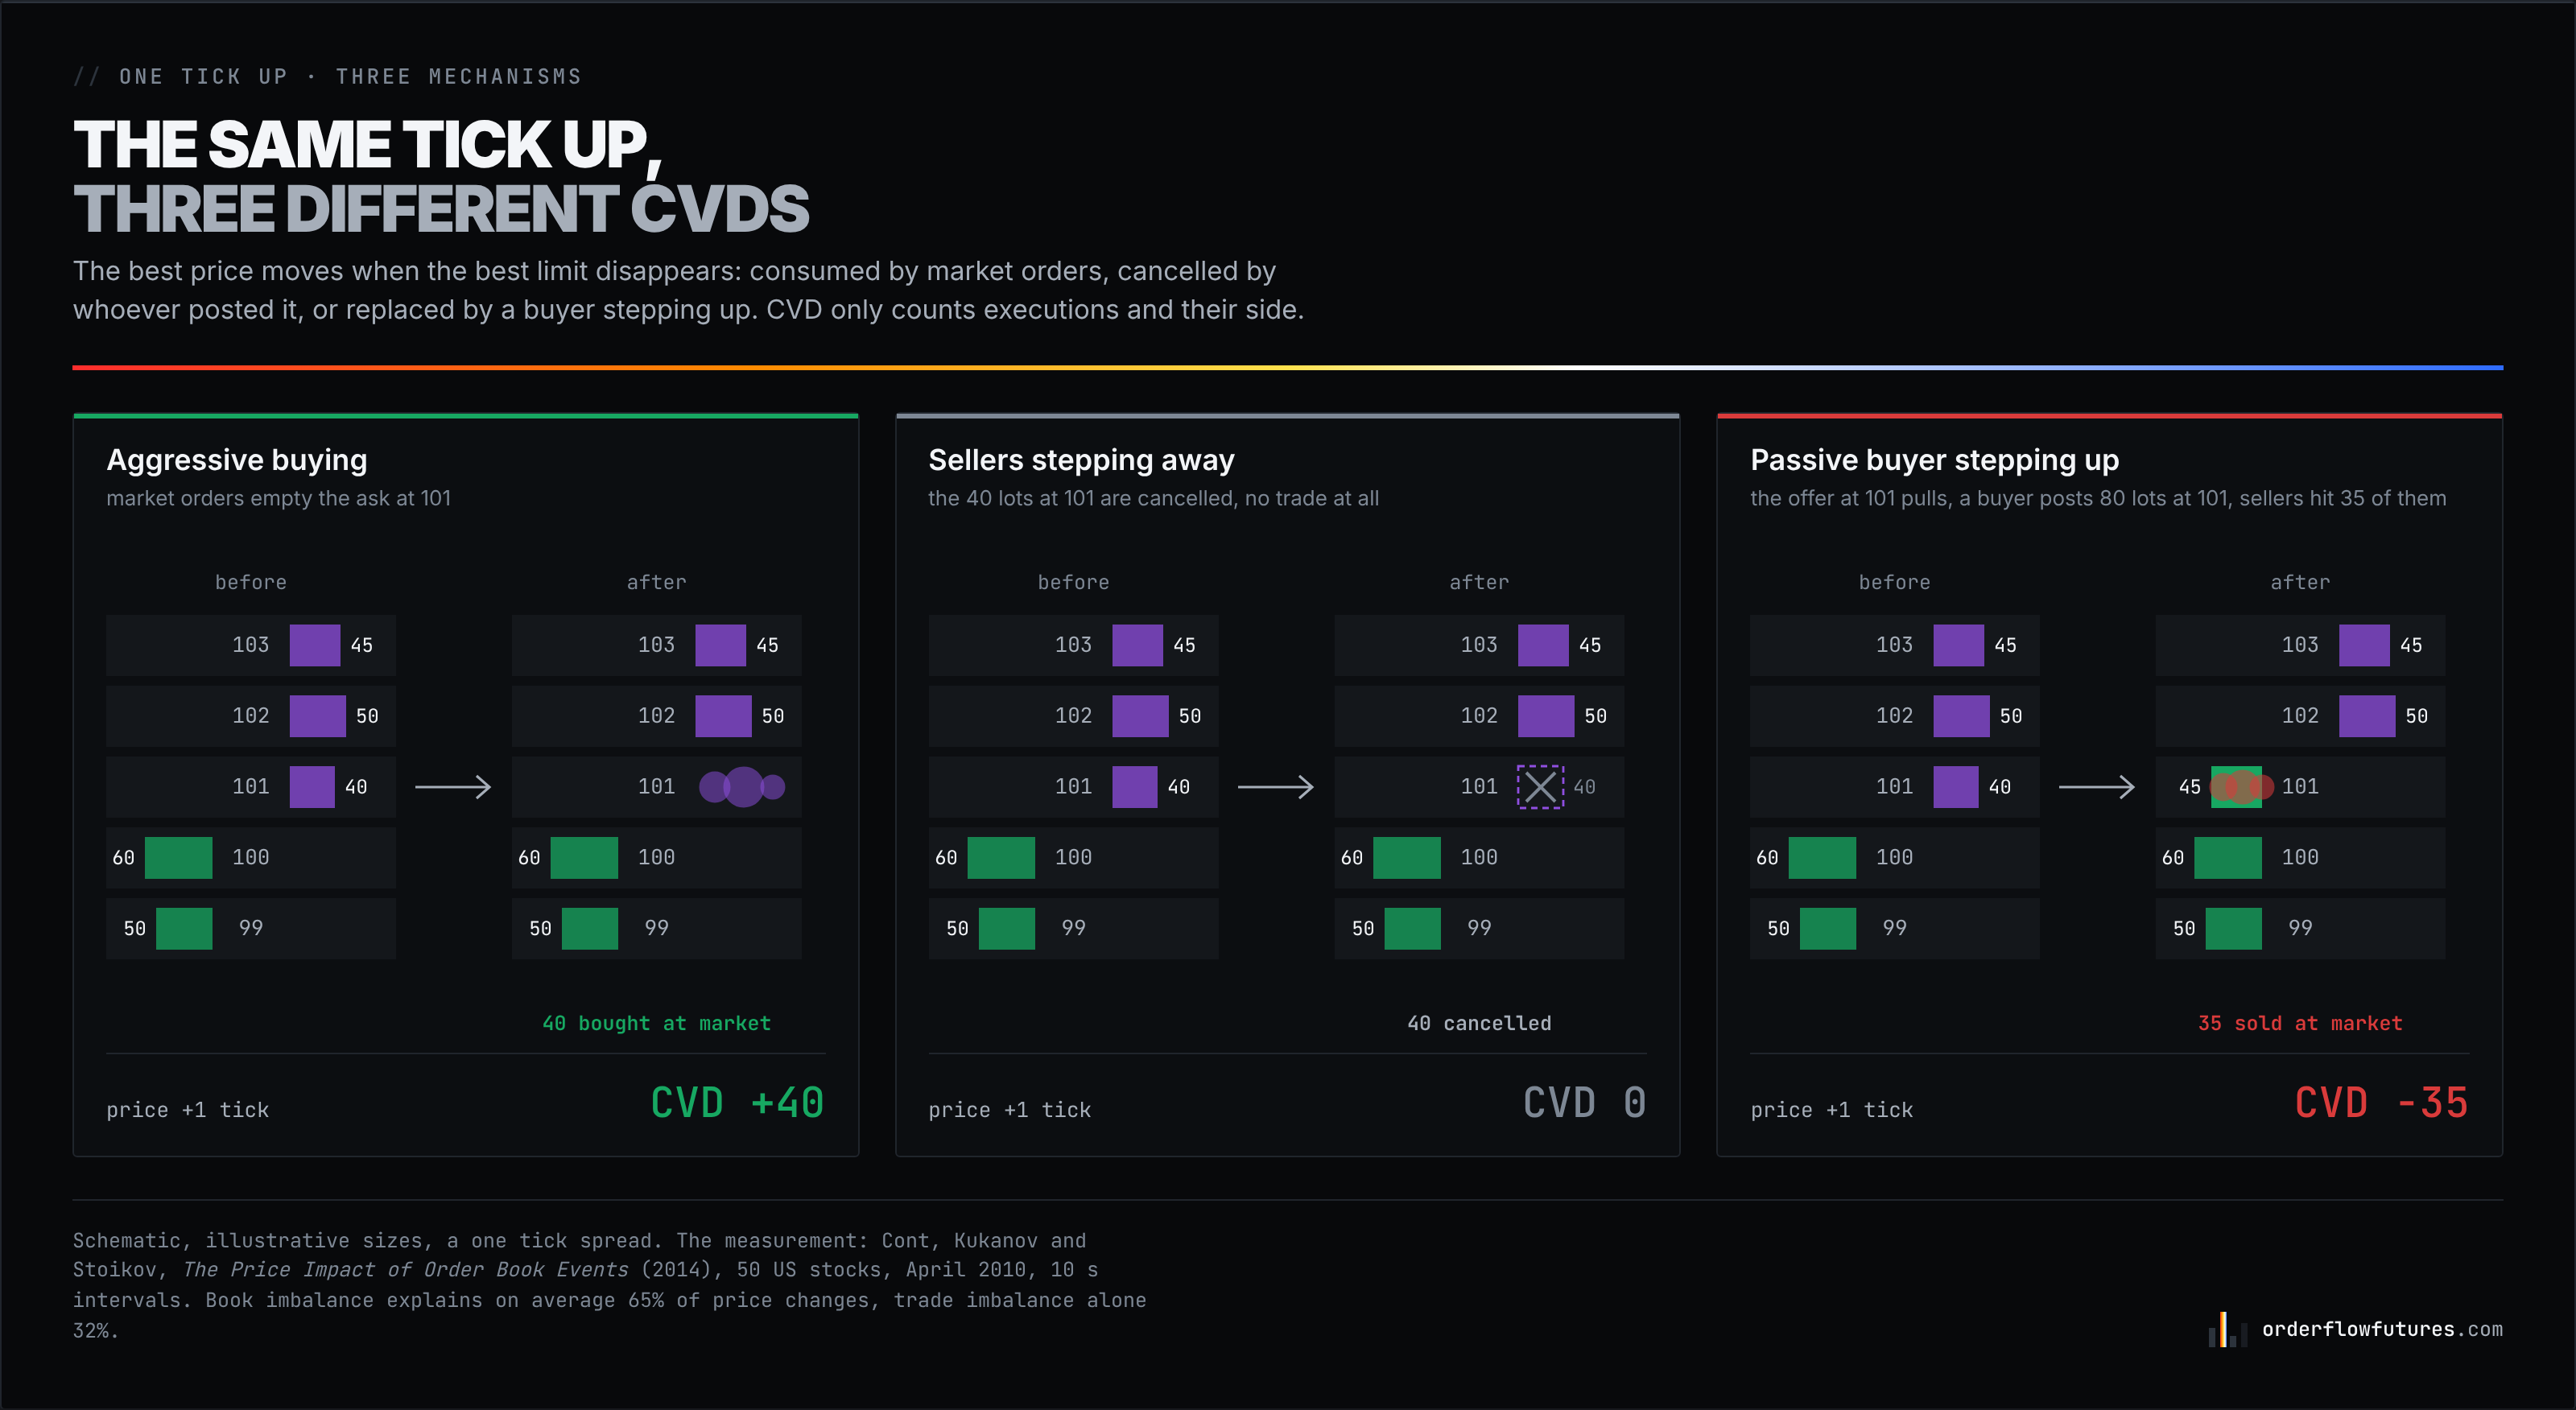
In practice, a future's price rises by one tick in one of these three ways:
| Mechanism | What happens in the book | What CVD does |
|---|---|---|
| Aggressive buying | Market orders consume the ask until it is empty | It rises |
| Sellers stepping away | Sellers cancel their limits at the ask, price slides up with no trade | It does not move |
| Passive buyer stepping up | The offer above pulls, a buyer immediately reposts limits one tick higher, sellers come and hit them | It falls |
The third row is the opening scene. A large buyer who does not want to pay the spread works the order with limits. They never cross the spread: as soon as the offer one tick above pulls, they move their bid up a notch. Impatient sellers come and hit the bid. Every fill is an aggressive sale, so CVD falls, while price rises because the buyer keeps raising their price. It is the most discreet way to execute, and it is also the one that produces the perfect bearish divergence on a perfectly healthy rally.
---
4. The two divergences are not worth the same
People speak of "the divergence" in the singular. There are two, and they do not carry the same weight of evidence.
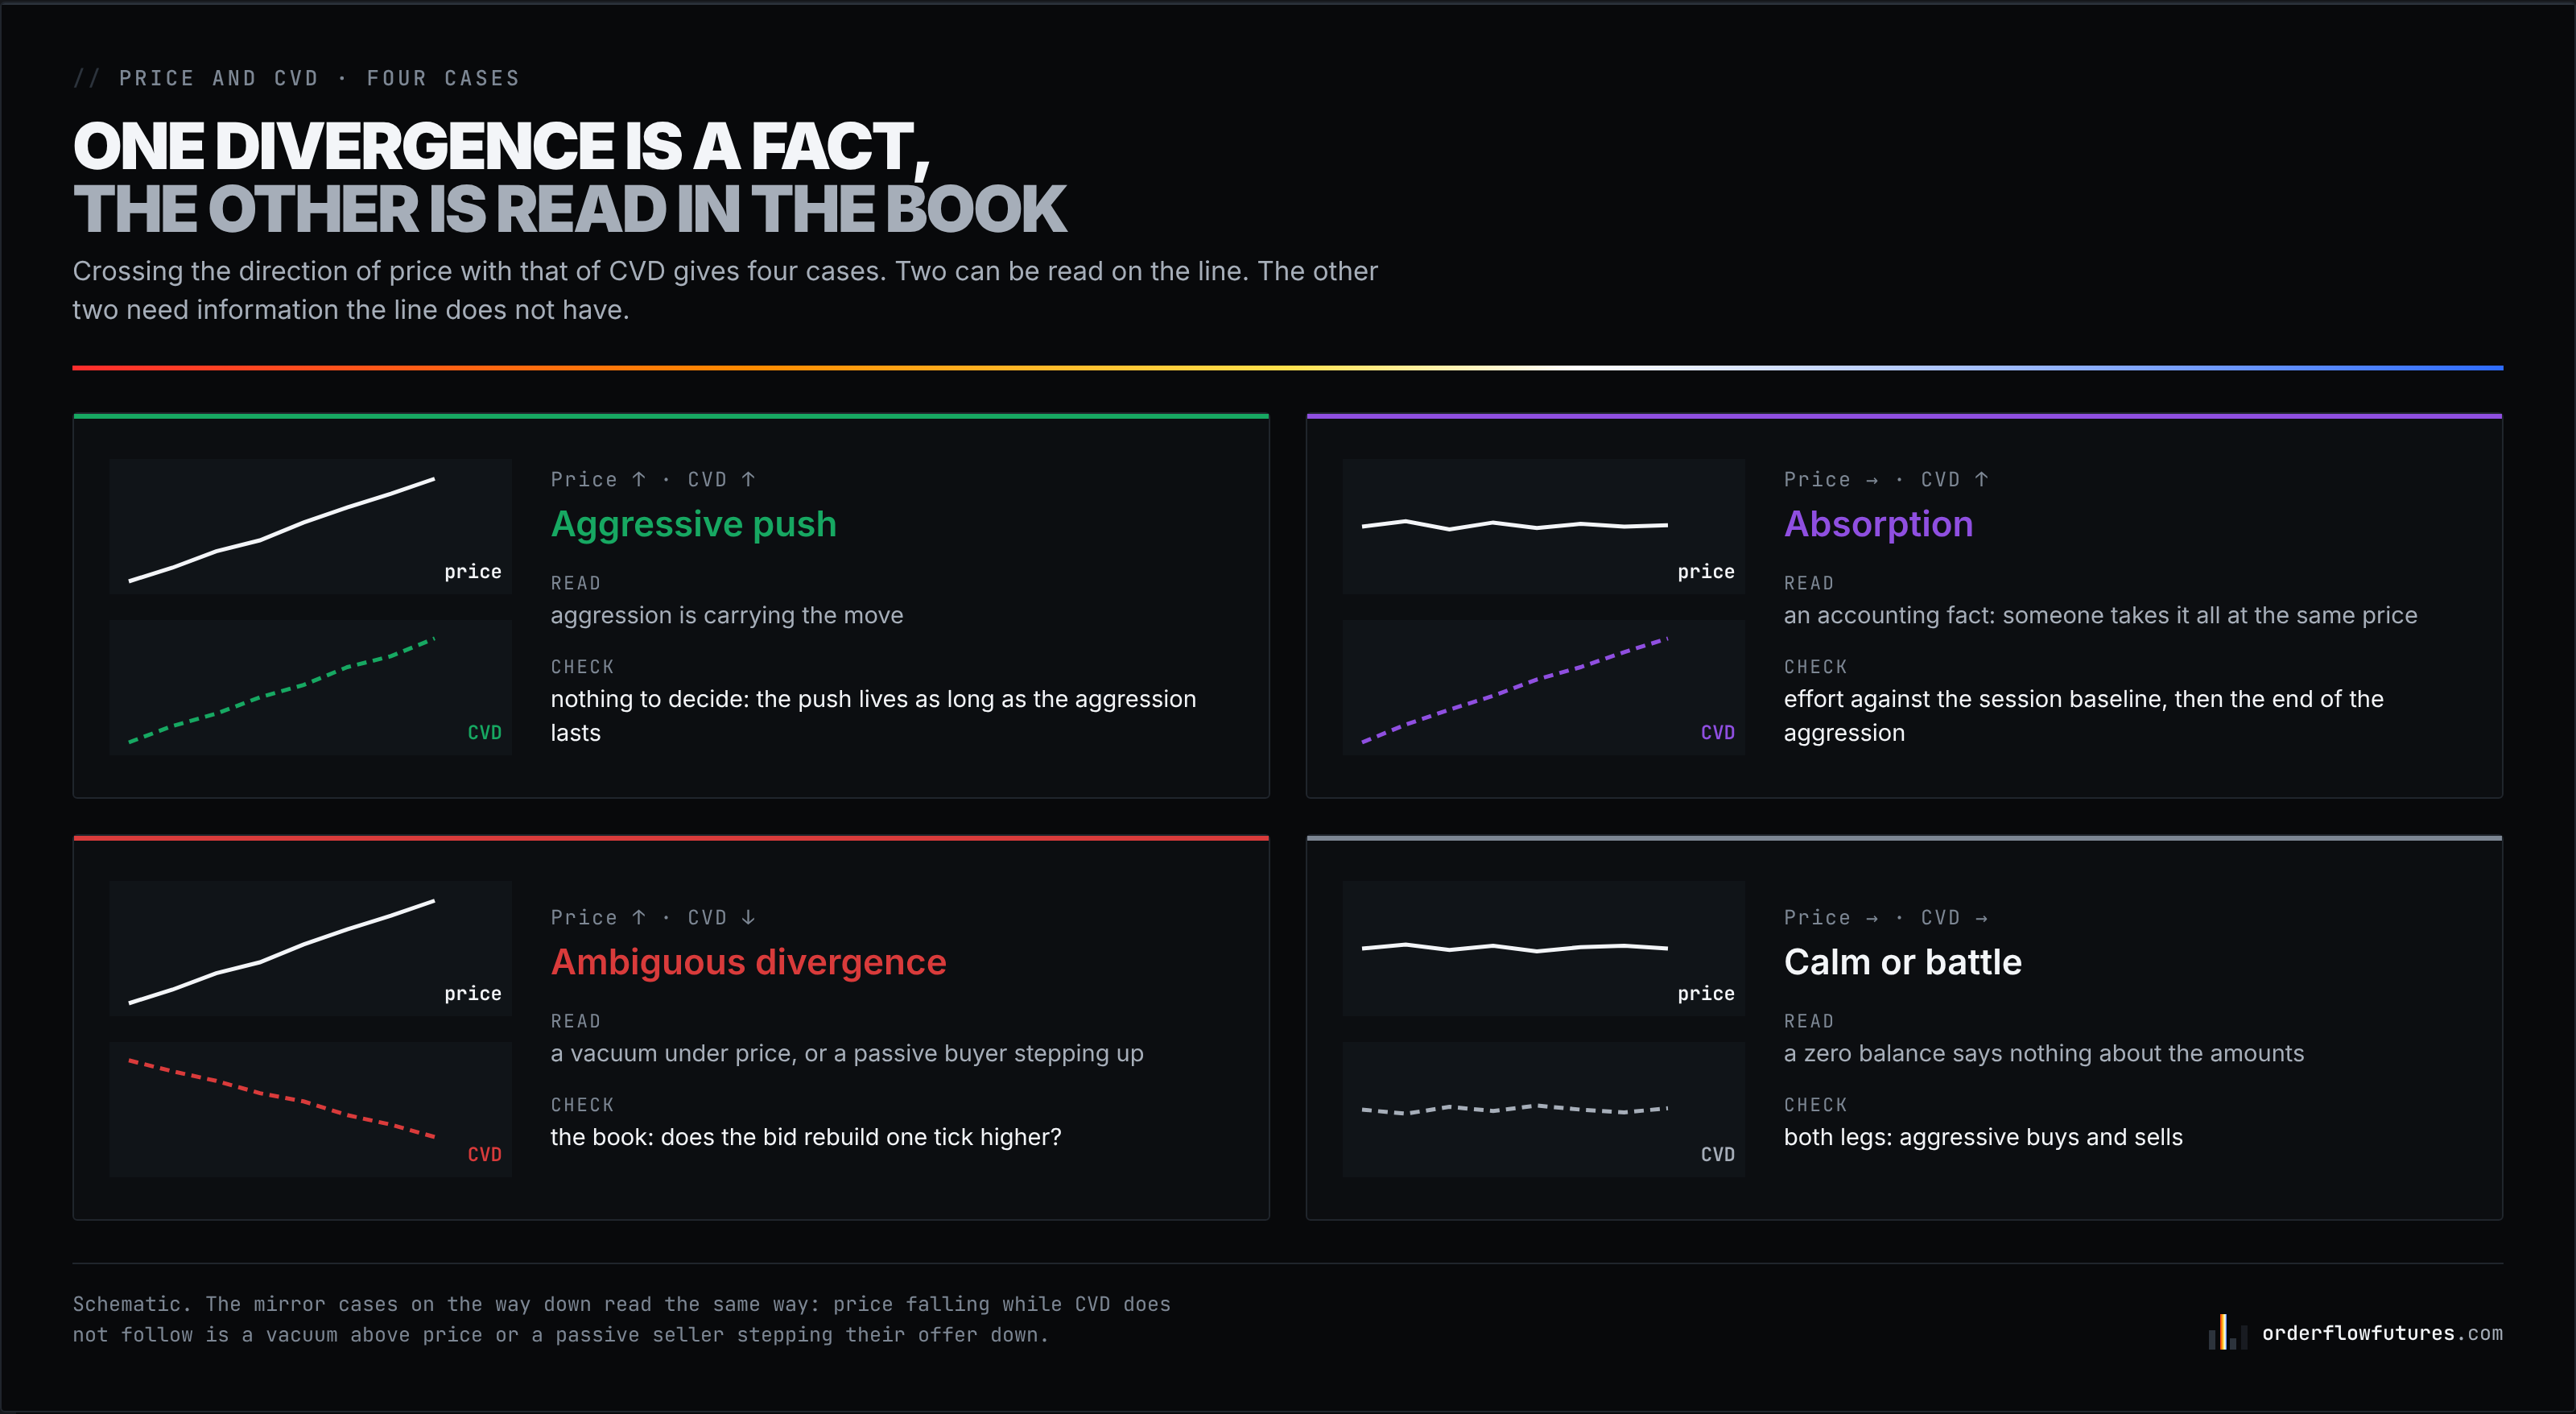
First divergence: CVD rises, price does not follow. Aggressive buyers are getting filled, the volume is there, and price stays at the same level. This is not a hypothesis, it is an accounting fact: someone took all that volume in limits, at the same price, without backing off. That is absorption, most often fed by size that reloads, the mechanism behind iceberg orders. Its sharpest form has its own article, Punch to the Wall. This divergence points at a specific level and a specific counterparty, and it is measured with the method from the effort and result article: a lot of effort for little result, compared with the session's baseline.
Second divergence: price rises, CVD does not follow. This is the textbook one, and it is the more ambiguous of the two, because it has two causes that lead to opposite conclusions:
- The vacuum. The book is thin, little aggression is enough to move price, and the move rests on almost nothing. It is the second face of the disharmony between effort and result: a fragile move that often plays back in reverse with the same low effort.
- Passive accumulation. A buyer steps their limits up and sellers hit them, as in the previous section. The move is solid, carried by a participant who does not stop, and CVD falls precisely because they are there.
The line is identical in both cases. The difference lies entirely in the book: in the first, there is nothing under price and nothing rebuilding; in the second, the bid rebuilds one tick higher every time sales hit it. A liquidity heatmap shows it in seconds. CVD alone cannot show it, by construction.
The other two cells of the grid are not divergences, but they read too. Price and CVD rising together: an aggressive push that nothing stops, the simplest case. Price and CVD both flat: either nothing is happening, or aggressive buyers and sellers are fighting at equal volume. A flat CVD cannot tell calm from a battle, which is the subject of the next section.
---
5. Filtered CVD, and what size really tells you
Two settings change the read a lot, and both exist in DeepDom's CVD module.
Show both legs of delta. The Show volumes Bid/Ask option adds to the CVD line one line for volume executed at the ask and one for volume executed at the bid. It answers the question a flat CVD leaves open: if both lines climb hard together, it is a high volume battle, a level that matters; if both are flat, nobody is there. Delta is a balance, and a zero balance says nothing about the amounts: that is the distinction between delta and effort laid out in the effort and result article.
Filter by size. Filtered CVD applies volume thresholds, one per direction, and can plot the result on a separate axis. The stated purpose of this kind of filter is to separate large aggressors from small ones. It is useful, provided you know what the size of a trade measures.
On CME, a Trade Summary groups one aggressing order and everything it consumed: a large number does mean a single aggressive order was large. But large participants almost always slice their orders. A VWAP or TWAP execution algorithm sends small child orders, precisely so as not to show up in this kind of filter. A CVD filtered on large orders therefore does not measure "institutions", it measures large participants in a hurry, the ones willing to show their size because urgency matters more than discretion. That is real information, often a reaction to news or a forced hedge. It is not "smart money".
The most useful read is the gap between the two lines. Total CVD falling while CVD filtered on large orders rises says that small traders are selling at market and a few large ones are buying at market. It still does not give you an entry, but it tells you who is aggressing and in which direction, which no single line does.
---
6. The four step read
Everything above boils down to a short routine that works on any contract.
Step one, set the starting point. It must come before both points you compare: the session for two highs of the cash session, Globex if one of them was printed overnight. Do not switch anchors mid read to find the divergence you are looking for.
Step two, measure the slope over the push. How far did CVD move between the start and the end of the price move? Compare that number with the previous pushes of the same session, not with an absolute value.
Step three, break it down. The two legs, aggressive buying and aggressive selling. Weak delta with two strong legs is a fight, weak delta with two weak legs is a desert. They are not the same levels.
Step four, read the book for the ambiguous divergence. Price rising, CVD not following: does the bid rebuild one tick higher after every hit, or is there nothing under price? The first is accumulation, the second a vacuum.
And in every case, the decision is made when the aggression ends, not during it. A divergence points at a level to watch. What price does when the pressure stops is what decides, and it is what gives you an invalidation condition: an absorption level that gives way, a vacuum that fills, an accumulation that stops stepping up its bid.
---
7. The opening scene, read again
Back to the ES with the routine.
Starting point: both highs being compared, 9:50 and 10:40, belong to the cash session. Session CVD does show the divergence, 4,200 contracts under its 9:50 high, and Globex CVD shows the same one, shifted by the night. But over the push itself, from the 10:15 low, CVD lost about 1,500 contracts while price gained six points.
Breakdown: both legs are active, roughly 9,000 contracts sold at market against 7,500 bought at market over the push. This is not a desert. There are a lot of aggressive sellers inside a rally.
Book: this is where it all happens. With every tick up, a row of buy limits rebuilds one tick under price, gets hit, refills, then moves up a notch. Above, offers pull before contact. It is the third row of the table in section 3: a passive buyer stepping up, and sellers hitting them.
Conclusion: the divergence was real and it did not say what the textbook makes it say. It said aggressive sellers were losing money against a patient buyer. Selling the new high was a bet against the only force visible on screen.
The same chart, with an empty book under price and offers that do not pull, would have called for the opposite read. The line could not tell the difference. The book could.
---
8. What DeepCharts does with it
Delta and CVD exist on both sides of the DeepCharts ecosystem.
On DeepChart, the charting software, Deep Delta breaks the measure down into delta per bar, cumulative delta, delta profiles by price and CVD on the chart, and Deep Prints shows where in the candle the aggression concentrated.
On DeepDom, DeepCharts' order book, the CVD module documented by the vendor carries the settings this article talks about: Period Mode and Period Value for the starting point, Filtered CVD with a volume threshold per direction and an optional separate axis, Show volumes Bid/Ask for the two legs, and a customisable zero line. Its main value is not in the line, though. It is having the CVD next to the liquidity heatmap and the DOM, in other words being able to do step four without changing screens. For offers pulling before contact, Deep Wall and the Iceberg Detector read what the line cannot see.
A word on data, so you do not pay for what you will not use. Delta and CVD only need the side of each trade, which comes with Level 1 on CME. What needs depth, and MBO for the finer reads, is the book in step four. The difference is explained in the MBO vs MBP article.
DeepDom can be bought on its own, with its own licence: you do not need the full platform to read CVD against the book. There is no native macOS version; on a Mac it runs in Parallels Desktop.
Activate DeepDom →: promo code OFF comes already filled in: an extra 10% off DeepDom, monthly or yearly, on top of any discount running at DeepCharts. Not using the link? Enter OFF at the Payment step. Details: DeepDom promo code.
---
9. What this article does not say
- That CVD is useless. It measures exactly one thing, net aggression, and it measures it well on CME. The problem comes from what people ask of it, not from what it counts.
- That the bearish divergence never works. It sometimes comes before a reversal, when price is rising into a vacuum. It just cannot tell you which of the two cases you are looking at.
- A win rate. No such figure is given here, because it would depend on the contract, the time of day, the anchor and the exit rule. A read is tested on your own trading, with an invalidation condition written down in advance.
- That the Cont, Kukanov and Stoikov numbers apply as is to the ES. They come from US stocks in 2010. What carries over is the mechanism, not the value of the R².
- That the numbers in the example are real. The ES scene is built to illustrate the mechanism, with realistic orders of magnitude, and the diagrams are diagrams.
---
Frequently asked questions
What is CVD in trading?
CVD, for Cumulative Volume Delta, is the running sum of delta since a chosen starting point: on each trade, the volume is added if it comes from an aggressive buyer and subtracted if it comes from an aggressive seller. The line shows the net pressure of market orders over time. On CME futures, the aggressor side is declared by the exchange in the MDP 3.0 feed, so it does not have to be guessed.
What is the difference between delta and CVD?
Delta is the balance of aggressive buys and sells over a single bar or a single price level. CVD adds those balances over time, from a starting point: the Globex reopen, the cash open or the start of a rolling window. Delta describes a bar, CVD describes a session or a period, and its value only means something for that starting point.
Is a CVD divergence a reversal signal?
Not on its own. CVD rising while price does not follow is a fact: aggression absorbed at a level, to be measured and watched. Price rising while CVD does not follow can signal a fragile move into an empty book, or on the contrary a passive buyer stepping up their limits while sellers hit them. Only the book separates the two cases, and the decision is made when the aggression stops.
Why does price rise while CVD falls?
Because price does not depend on market orders alone. It also rises when sellers pull their limits, and when a buyer posts limits higher and higher and gets hit by aggressive sellers. In that last case every fill is a market sale, so CVD falls, while price rises. On US stocks, book imbalance explains on average 65% of ten second price changes, against 32% for trade imbalance alone.
Should CVD be reset every day?
The starting point changes the CVD's level, not necessarily its shape. During the cash session, CVD reset at the Globex reopen and CVD reset at 9:30 differ only by a constant, the overnight delta: two highs of the session give the same divergence on both. The rule is to use a starting point earlier than both points you compare, and never to compare levels taken from different anchors. In DeepDom, the period is set with Period Mode (days, minutes, seconds or number of orders) and Period Value.
Does filtered CVD show institutions?
No. It shows large aggressive orders, so large participants in a hurry. Institutions mostly execute with algorithms that slice the order into small pieces to stay discreet, and those pieces slip under a size filter. The gap between total CVD and filtered CVD is still useful: it tells you whether small or large aggressors are pushing in one direction.
Want to get better at order flow?
We discuss flow, liquidity and our trades live, every day, on the OrderFlowFutures Discord. Join us, it's free.
Join the Discord for free16 online·108 members·Free · instant access
Read next
Get the new guides
One email when we publish an OrderFlow or Heatmap guide. No spam, one-click unsubscribe.
By subscribing, you agree to receive our emails. Educational content, not investment advice.