Updated · first published
What is Option Big Flows (DeepGamma)?
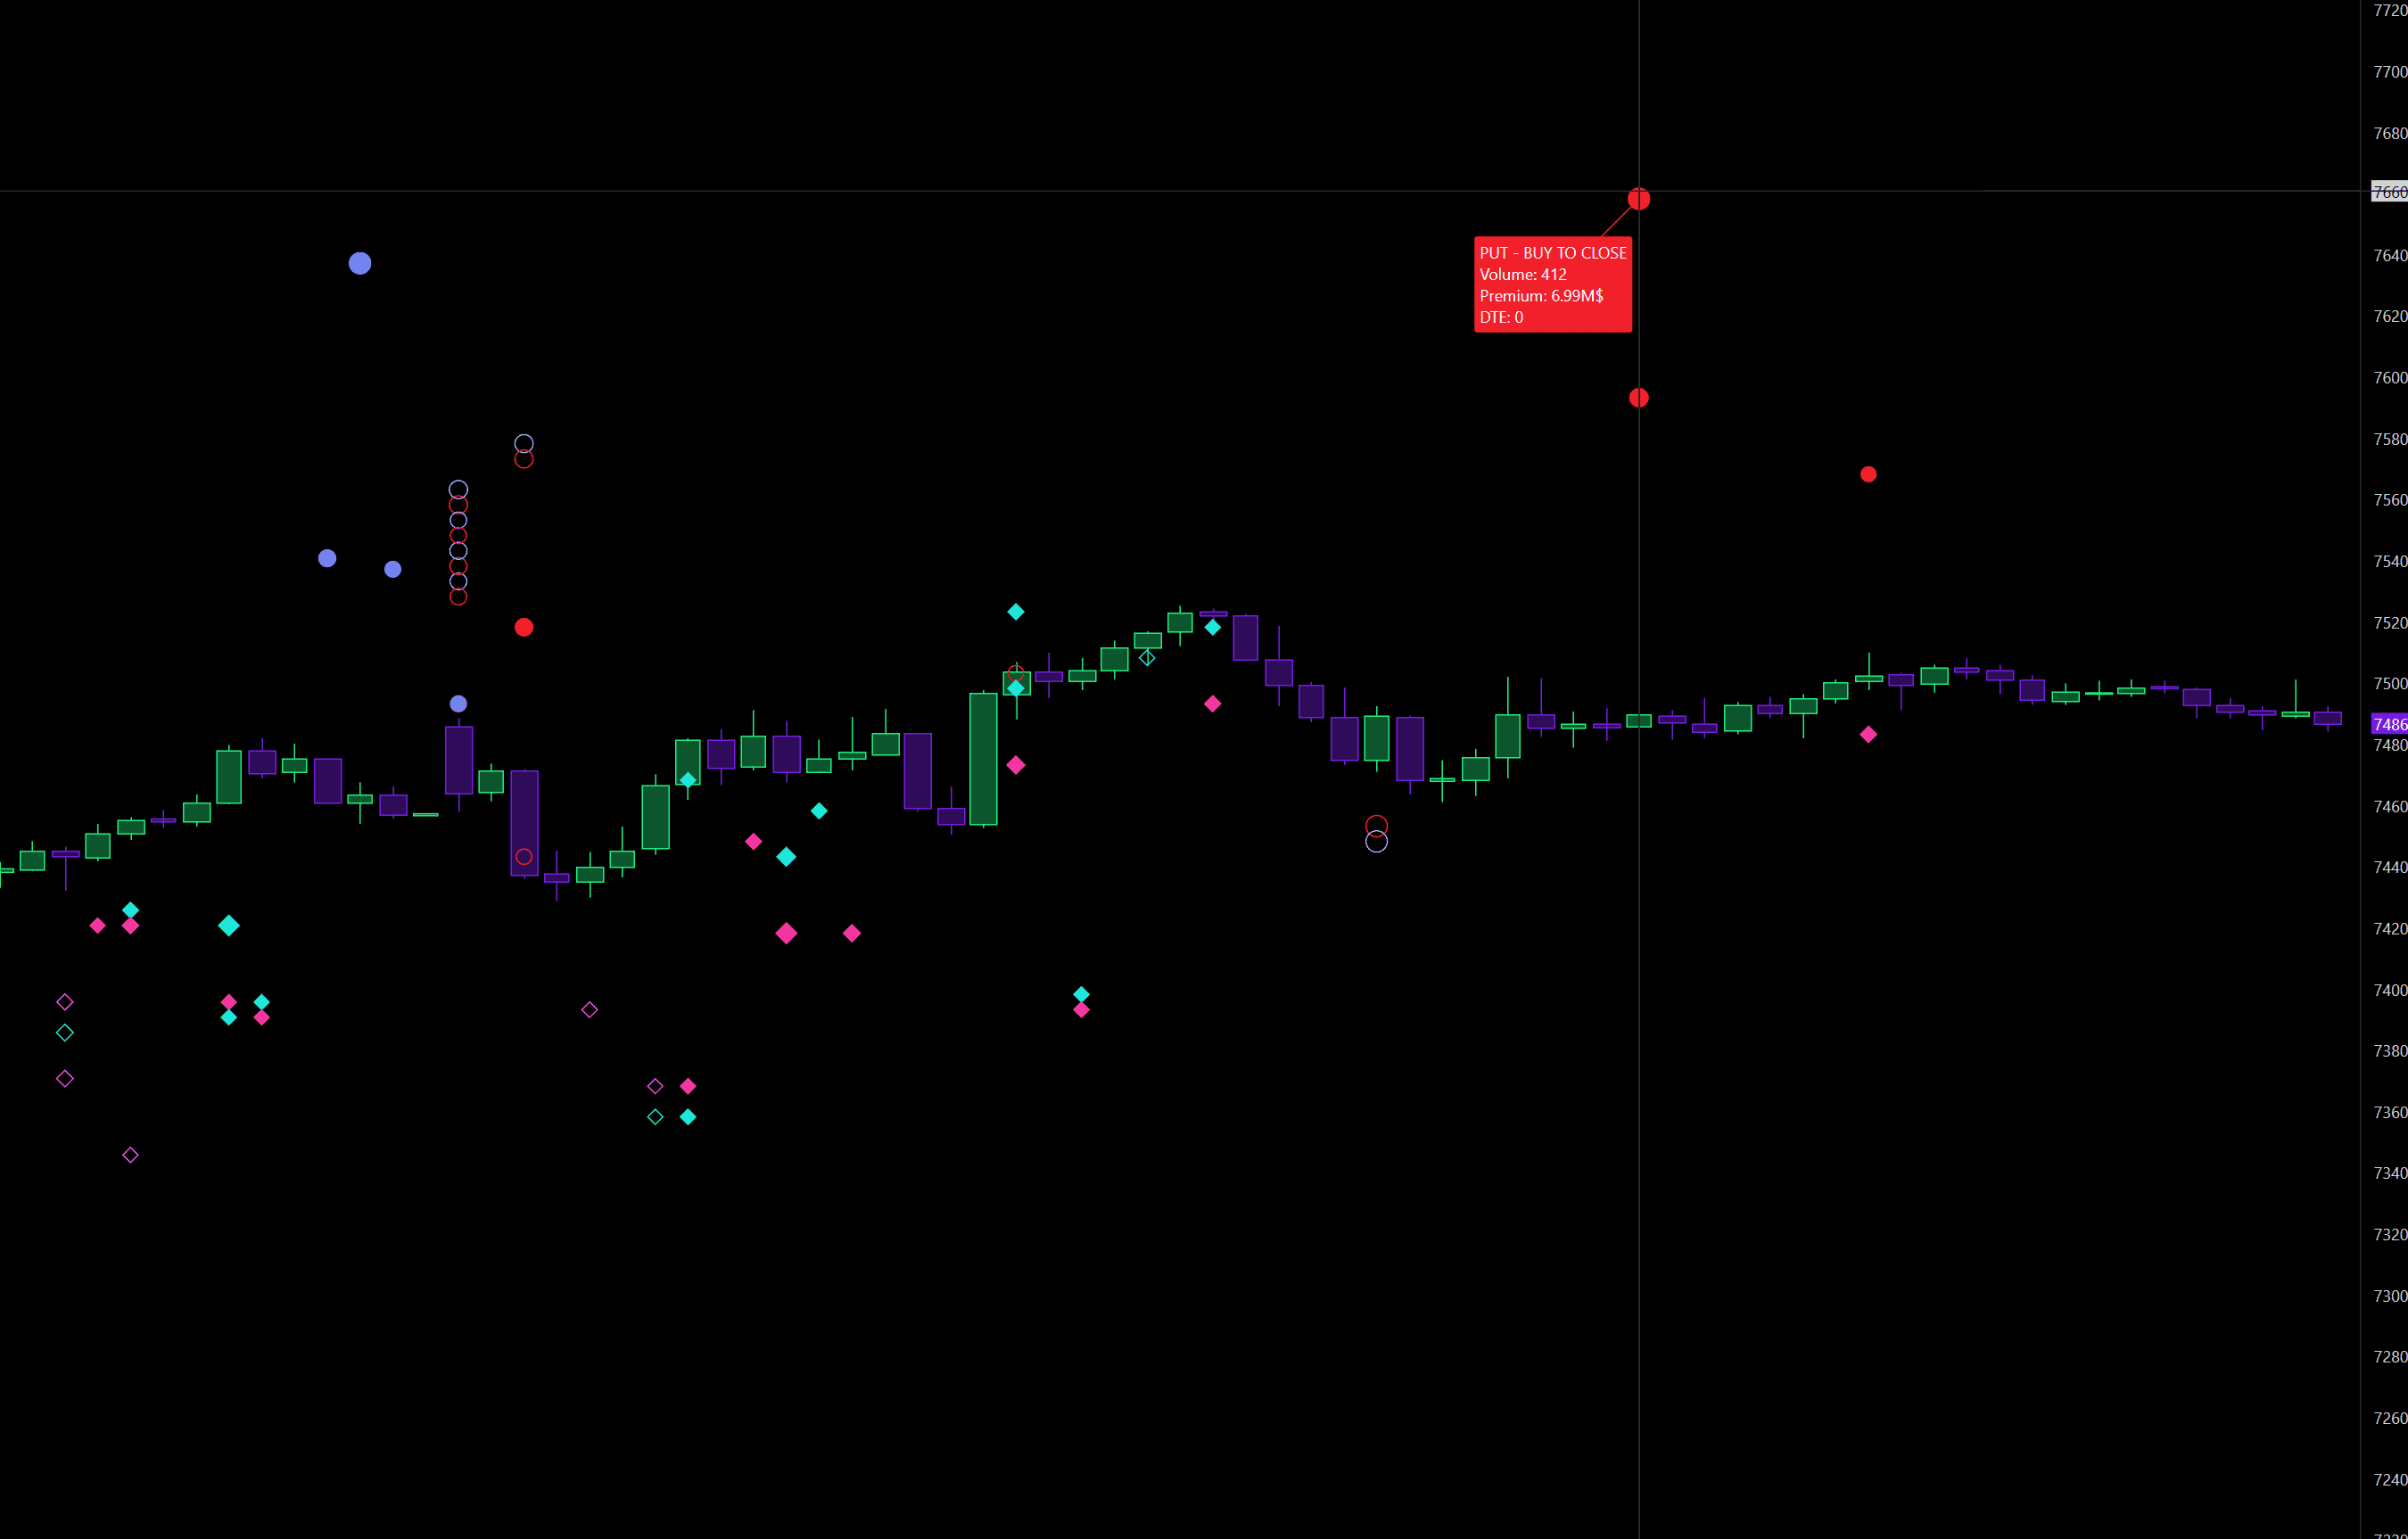
A large option flow leaves a trace before the index moves. Option Big Flows marks trades whose premium exceeds a threshold you set, one million dollars by default, with a simple visual language: shape says call or put, fill says opening or closing a position, color says buy or sell. You watch institutional tickets print alongside your futures order flow.
What DeepCharts does better
The opening-versus-closing information is what's missing everywhere else. A large call buy opening a position and a large call buy unwinding a short tell opposite stories, and most retail option feeds don't distinguish them. On SPX, DeepGamma uses Cboe participant data to settle it, and shows it on the chart you're already watching, with no second subscription.
Using it day to day
Raise the premium threshold rather than lowering it: you want the tickets that matter, not the noise. Filter expiration to your horizon, and lean on it around macro releases and opens, when the big players reposition. The marker isn't a signal: it's a prompt to go look at what the book is doing at that moment.
Example: a run of opening put buys, several million in premium, prints while ES is still holding its highs. Nothing has moved in price, but someone is paying dearly for protection. Within the hour the bid side of the book empties and the move goes. The option flow flagged the imbalance before price showed it.
⚠ The trap to avoid
The trap: following a large ticket as a directional signal. Many of these trades hedge a portfolio you can't see, or are one leg of a spread. A large put buy isn't necessarily a bearish bet: sometimes it's insurance on a long book.
Combine it with
Combine them with the GEX Profile (strikes already carrying exposure) and your footprint on ES: a large ticket landing on a strike already loaded with gamma, confirmed by aggression on the tape, is worth far more than the three read separately.
FAQ
Which instruments does Option Big Flows work on?+
SPX only, because it requires real Cboe participant data to identify the direction and nature of each trade.
How do I read the markers?+
Shape separates calls from puts, fill separates opening from closing a position, and color separates buying from selling. A filled green marker on a call therefore corresponds to an opening long position.
What premium threshold should I use?+
The default is one million dollars of premium. Raising it cuts noise and keeps only genuinely institutional tickets; lowering it buries the chart under trades that carry no weight.
How do I tell an opening from a closing trade on screen?+
By the marker fill. The defaults set Open to Fill and Close to Hollow: a solid symbol is a position being opened, a hollow one a position being unwound. Shape, diamond or square, tells you the side; colour tells you the action.
Which premium threshold should I choose?+
The default is one million dollars. There is no universal value: adjust in steps, chart open, until you get a marker density you can genuinely read during the session. A chart covered in diamonds is no better than an empty one.
Tutorial & settingsOption Big Flows: the complete setup, tab by tab
+Premium threshold, expiration filter, marker shape and colour, proportional sizing: every setting with its default value and what it changes on screen.
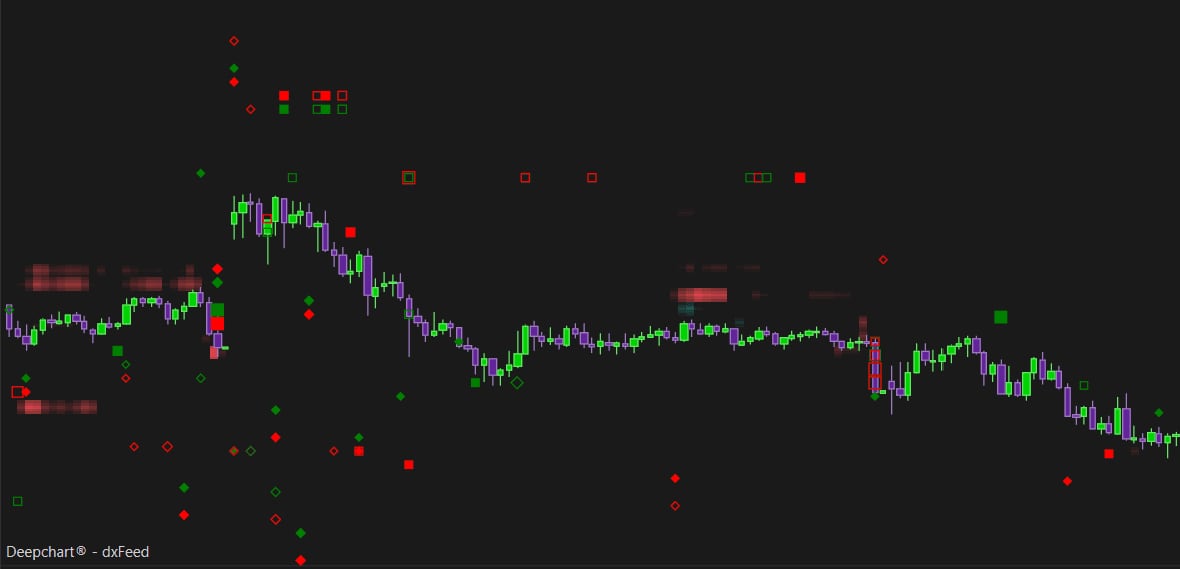
Option Big Flows prints large option tickets straight onto the chart, separating four pieces of information per trade: call or put, buy or sell, opening or closing a position. Before configuring it you need an SPX option chart: the indicator requires real Cboe participant data, the only source able to settle the direction and nature of each execution. This tutorial walks through every settings tab, with the values worth knowing and what each one changes on screen.
- An SPX option chart opened through New then Option Chart (symbol ES-CME, exchange CME)
- An active DeepGamma subscription: without Cboe participant data no flow is displayed
Step by step
- 01
Open an SPX option chart
Go to New in the top menu, then Option Chart. The selection box opens: pick SPX, which shows symbol ES-CME and exchange CME. It is the only accepted symbol, because the indicator needs Cboe participant data to settle the direction and nature of each trade.
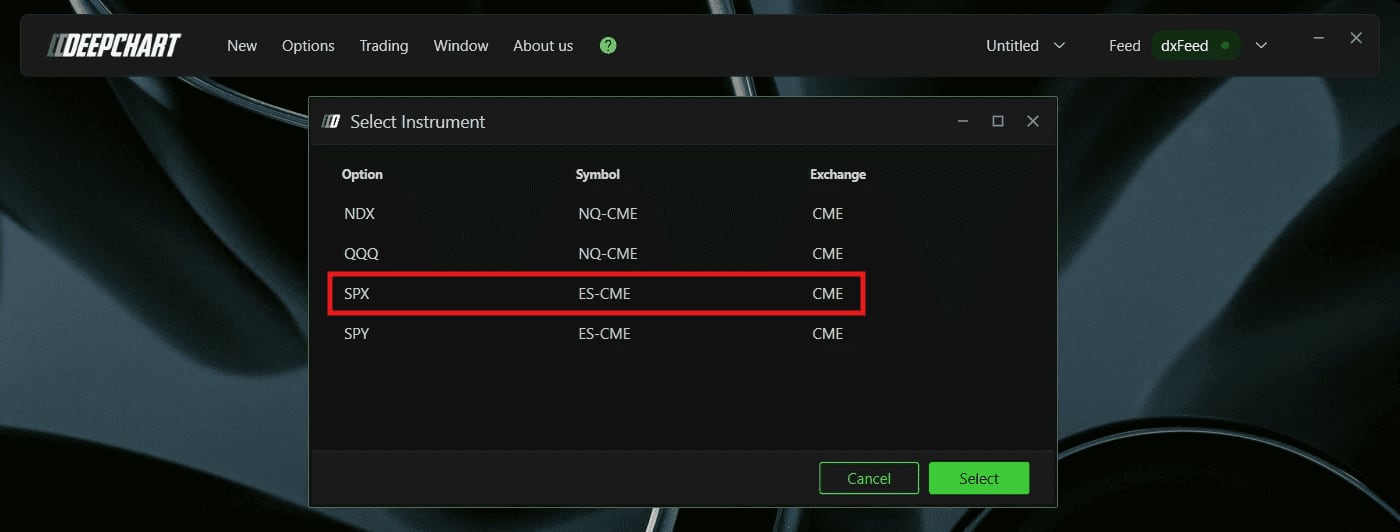
The instrument selection box with SPX, symbol ES-CME, exchange CME.© DeepCharts - 02
Add the indicator
Once the chart loads, click Indicator Add in the toolbar, search for Option Big Flows, add it with the plus, then open the settings icon. The window splits into four tabs: General, Call Plot, Put Plot and Size Settings. Only one of them changes what you see, the other three only change how it is displayed.
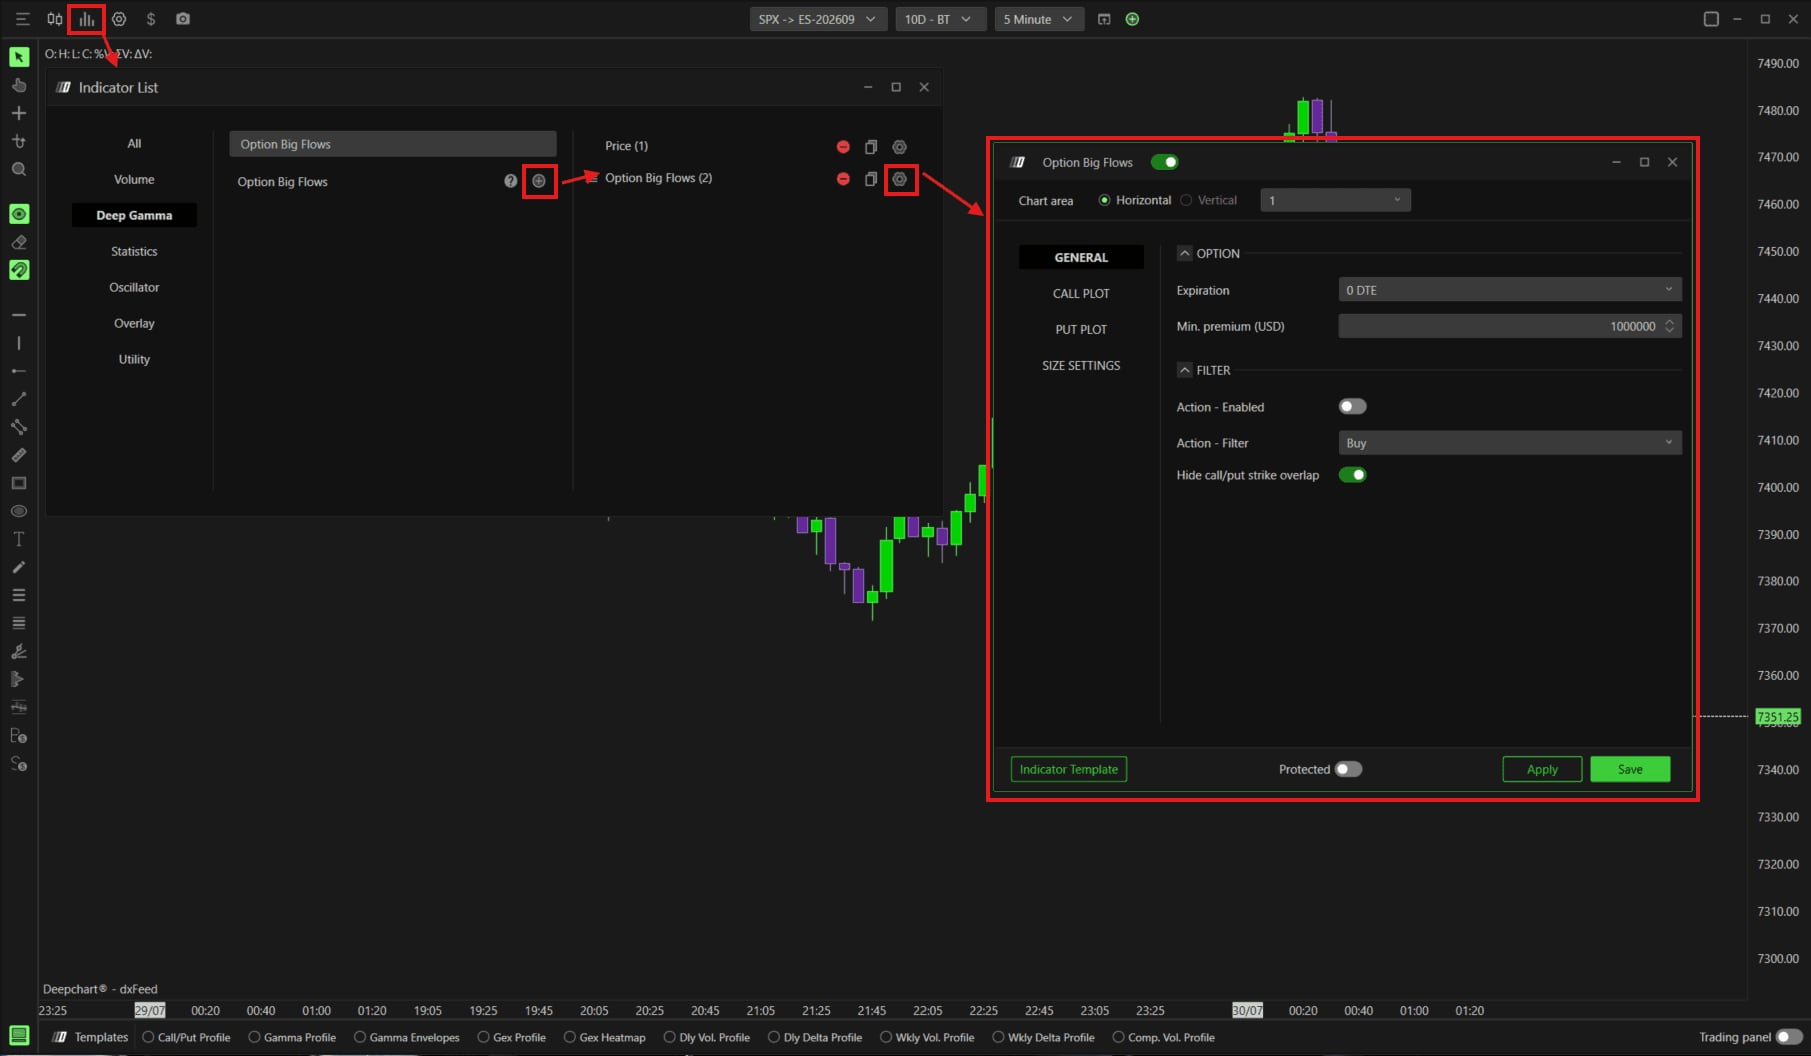
The indicator list with Option Big Flows added, and its settings window open.© DeepCharts - 03
Set the premium threshold, the expiration and the filter
Min. Premium (USD) is one million dollars by default: only trades whose premium exceeds that amount are plotted. It is the one setting that genuinely changes what you see, and the first to tune. Too low and the chart fills with markers until the word big means nothing; too high and you see two tickets a session. Just above it, Expiration is 0 DTE, meaning same day options, whose flow weighs on the session immediately, and widens out to All expirations. In the Filter section, Action - Enabled is off: turn it on to keep only buys or only sells through Action - Filter. Hide call/put strike overlap is on by default and deserves to stay on: it hides trades where a call and a put execute at the same strike simultaneously, typically offsetting structures whose net directional exposure is zero.
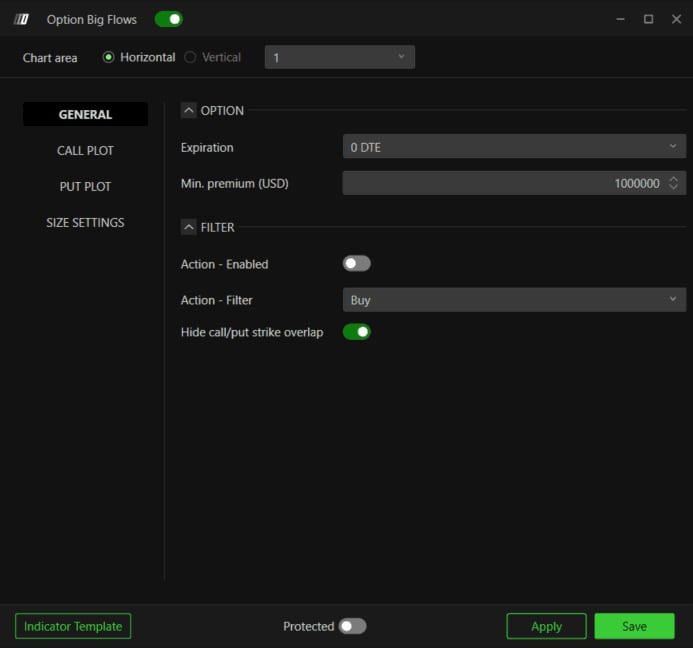
The General tab with Expiration, Min. premium (USD) and the Filter section.© DeepCharts - 04
Configure the call markers
The Call Plot tab starts with Marker, Diamond by default, with Circle, Square and Text as alternatives. Then come three sections that look alike but do not serve the same moment: Generic, Open and Close. Each has its Display mode, Fill or Hollow, and its colour pair, Buy in green, Sell in red. The key point is the default convention: Open is Fill, Close is Hollow. A solid diamond is therefore a position being opened, a hollow diamond a position being unwound, and that is exactly the information missing from most retail option feeds.
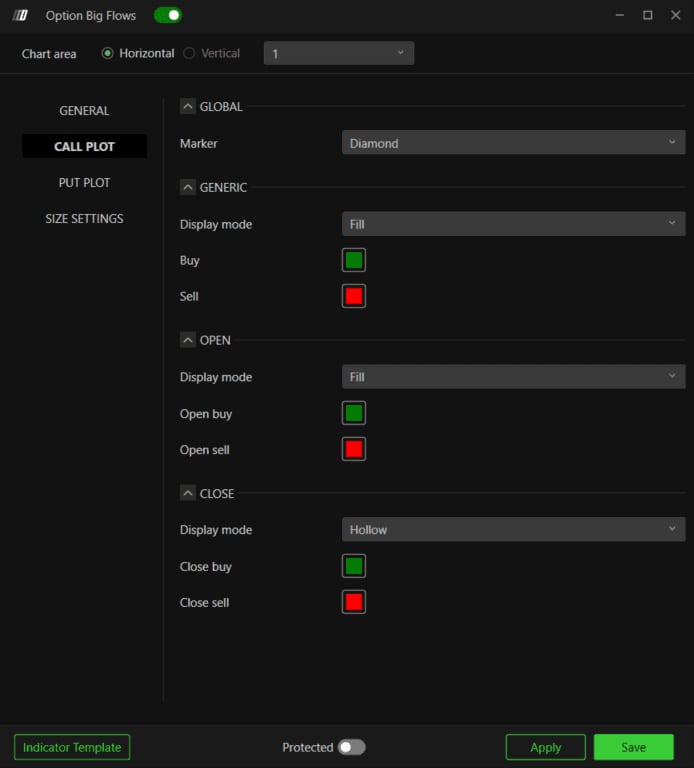
The Call Plot tab with Marker on Diamond and the Generic, Open and Close sections.© DeepCharts - 05
Configure the put markers, and decide your colour convention
The Put Plot tab repeats the same structure, with Marker on Square by default: puts are squares, calls are diamonds, so shape alone separates the two sides. Colours follow the same convention as calls: green for Buy, red for Sell. That is the literal action, not market sentiment, so a large put buy shows up green. If you would rather read sentiment, invert the colours in the Put Plot only: green will then mean up and red down across both tabs.
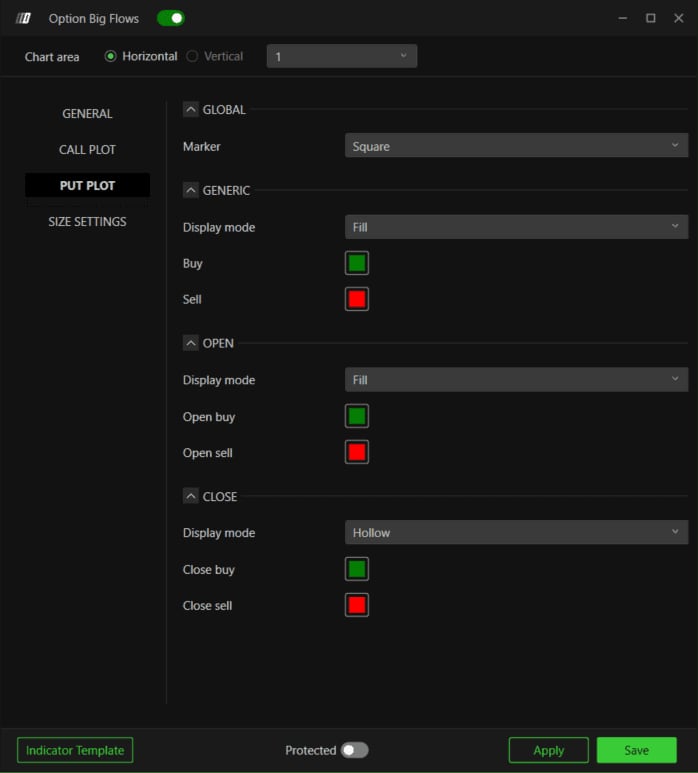
The Put Plot tab with Marker on Square and the Buy and Sell colour pair.© DeepCharts - 06
Calibrate marker size
The Size Settings tab decides readability. Text size is twelve and Text color white: those two only matter when Marker is set to Text. Marker min size is sixty, Marker max size one hundred and twenty: those bounds frame symbol size on screen, and the gap between them is what makes a very large ticket obvious at a glance. Marker max std dev is one and drives the scaling: it decides at what premium standard deviation a marker reaches its maximum size.
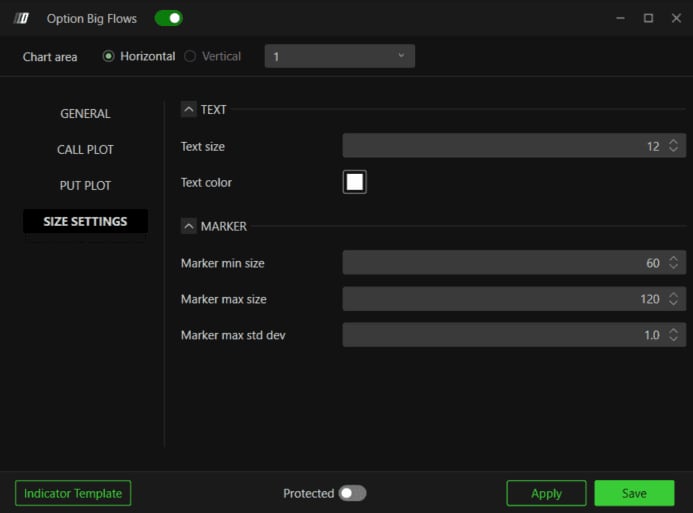
The Size Settings tab with Marker min size, Marker max size and Marker max std dev.© DeepCharts
Settings, tab by tab
Up to 1 to 7 days, 31 d, 91 d, or All expirations.
Premium threshold in dollars below which a trade is not plotted.
Turn on to filter by trade direction.
Active only when Action - Enabled is ticked.
Hides a call and a put executed at the same strike simultaneously: net exposure is neutral.
Circle, Square, Diamond or Text.
Solid marker: the position is being opened.
Hollow marker: the position is being unwound.
Same structure as Call Plot, minus the marker shape.
Shape separates puts from calls, not colour.
Literal action, not market sentiment.
Only applies when Marker is set to Text.
Premium standard deviation at which a marker reaches maximum size.
⚠ Traps to avoid
- Lowering Min. Premium to see more. The indicator exists only to isolate the exceptional: below the threshold these are not big tickets any more, they are execution noise covering your chart.
- Reading a large green put buy as bullish. Colour encodes the action, not sentiment: green means Buy, in both tabs. Either you hold the convention in your head, or you invert the Put Plot colours, but you cannot half do both.
- Turning off Hide call/put strike overlap without knowing why. It hides combinations whose net directional exposure is zero: letting them through means counting as a directional bet something that is not one.
Want to get better at order flow?
We discuss flow, liquidity and our trades live, every day, on the OrderFlowFutures Discord. Join us, it's free.
Join the Discord for free7 online·76 members·Free · instant access