Updated · first published
What is GEX Profile (DeepGamma)?
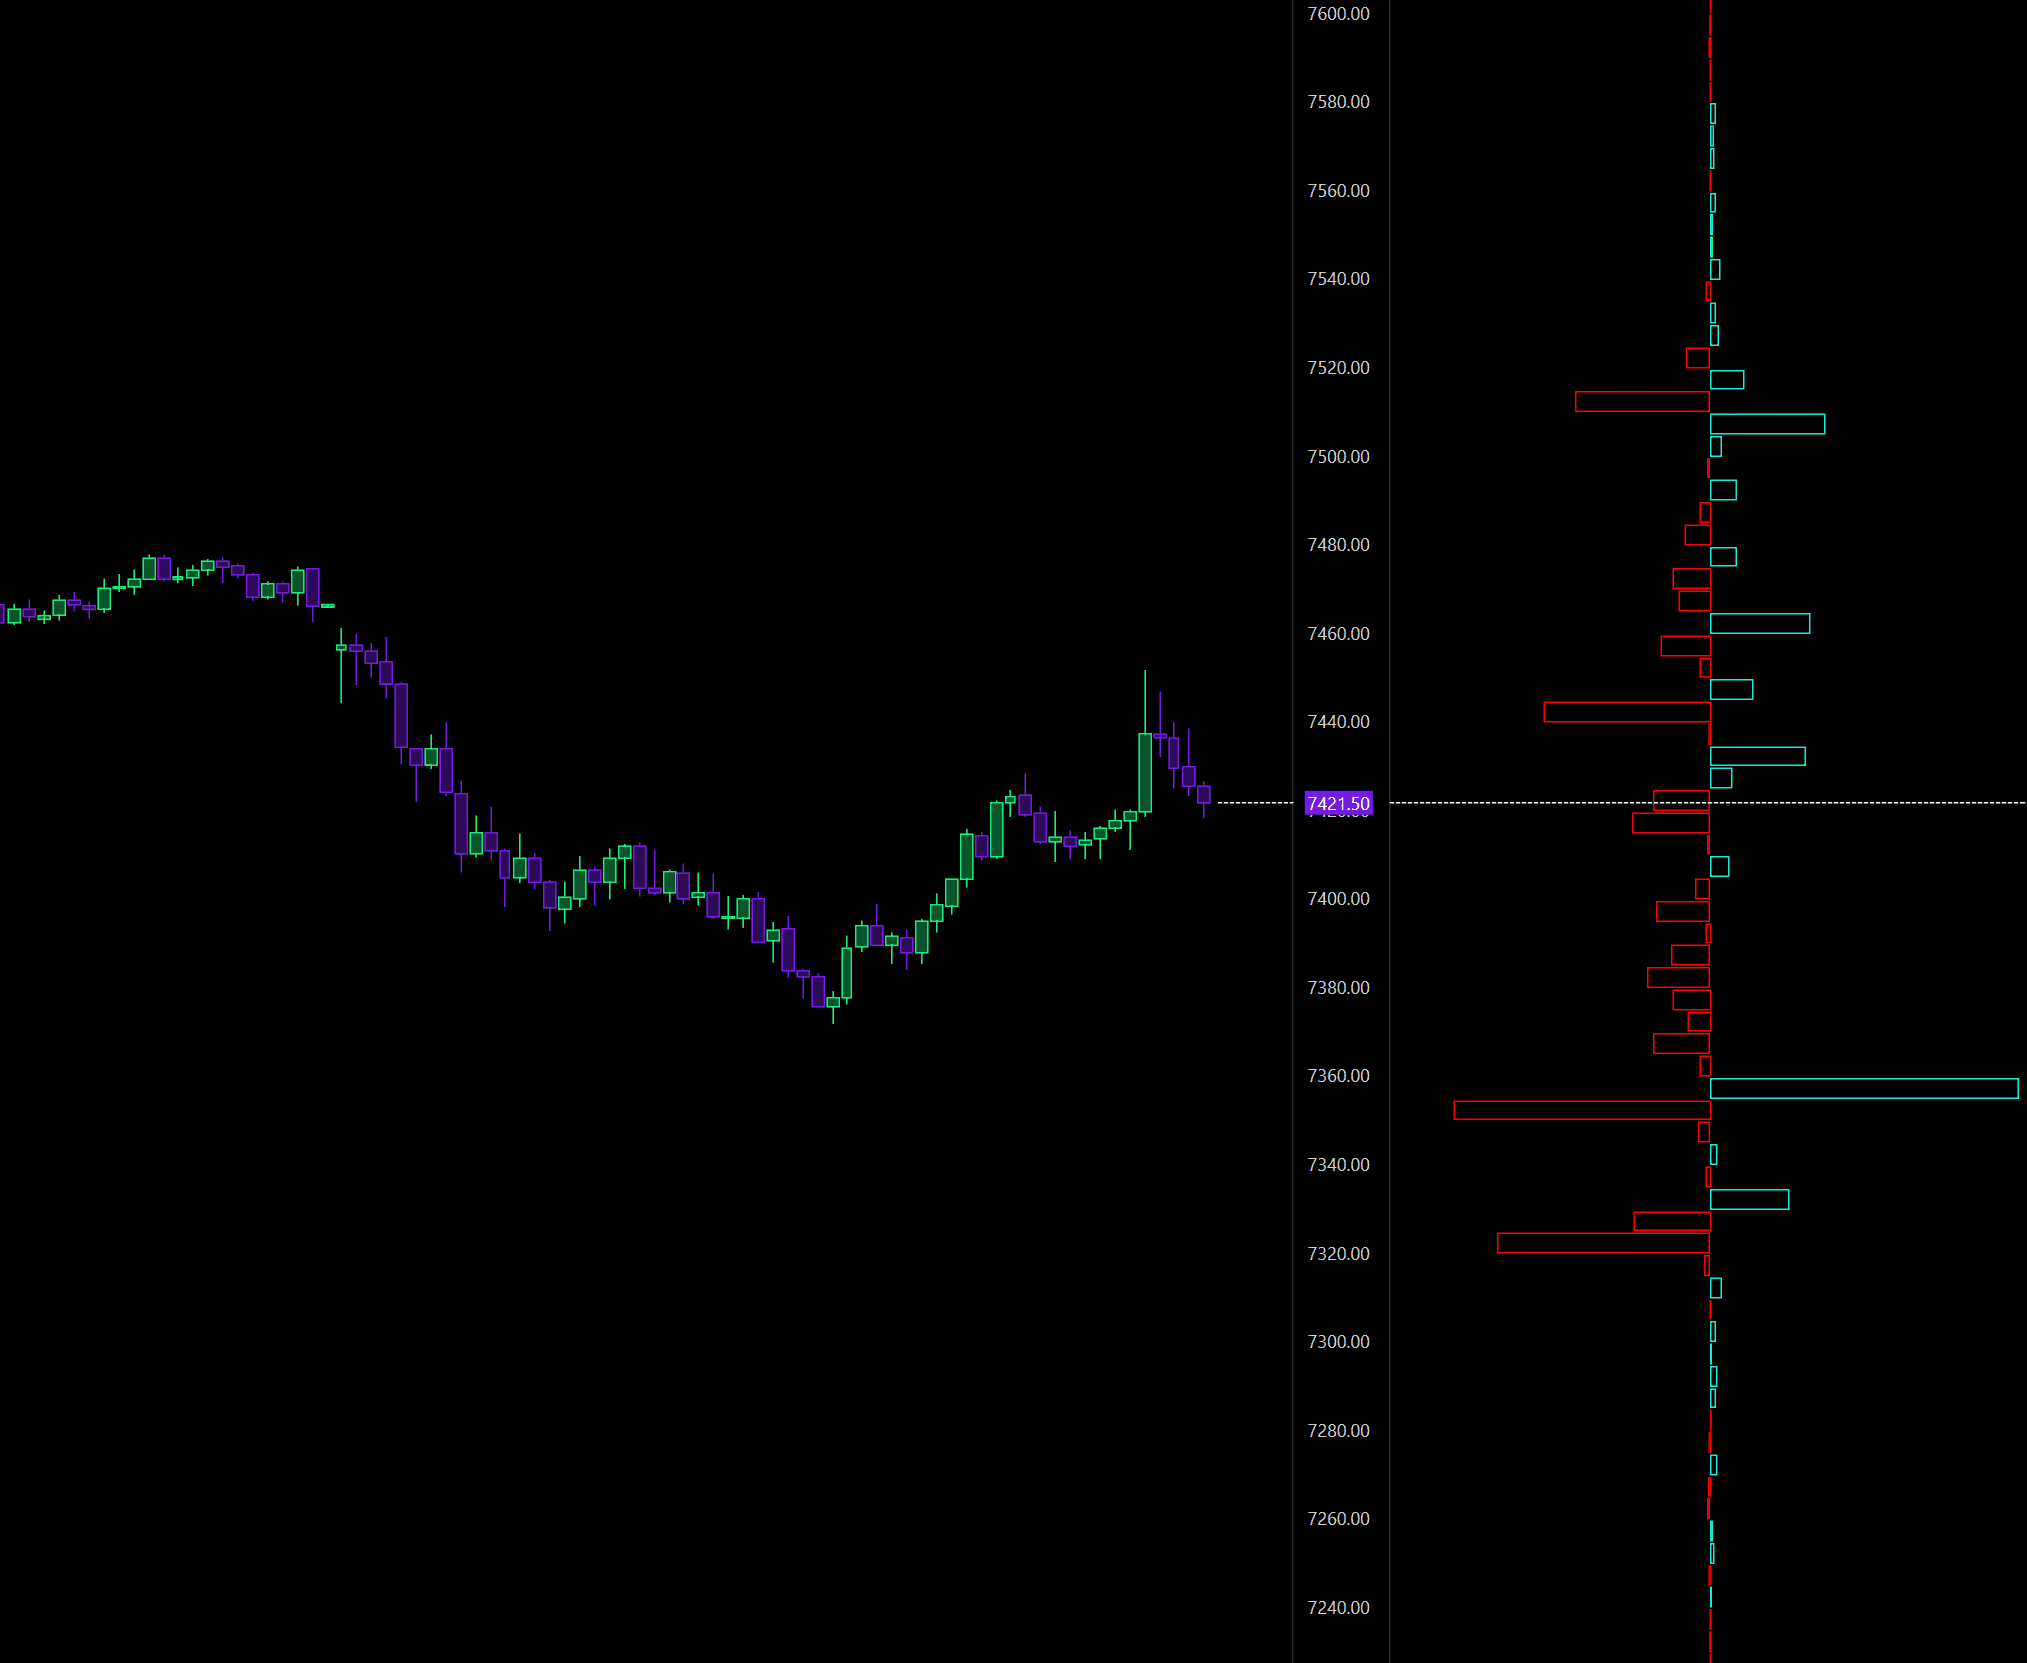
When a market maker sells an option they aren't betting on direction: they hedge by buying or selling futures. Gamma measures how fast that hedge must be readjusted. The GEX Profile stacks this exposure strike by strike, like a volume profile: the call wall above, the put wall below, and the zero-gamma level separating the two regimes.
What DeepCharts does better
On SPX, DeepGamma doesn't guess who holds what: it reads the participant data published by Cboe, which actually identifies market-maker executions. Most GEX tools apply a convention ("dealers sell calls, buy puts") and compute from there. Here positioning is observed rather than assumed, and it renders inside the same chart as your order flow, refreshed every minute, with no separate subscription.
Using it day to day
Day to day, open the GEX Profile before the US open and write down three levels: call wall, put wall, zero gamma. They become your context boundaries for the session on ES and, by correlation, on NQ. Filter by expiration: 0DTE drives today's session, further-out expirations explain the underlying trend.
Example: before the open, the SPX call wall sits well above price, the put wall just below, with clearly positive GEX. The session ranges between the two and every impulse fades: dealers sell rallies and buy dips to stay neutral. Your order flow gives you the entry at the extremes; the GEX Profile told you not to chase the break.
⚠ The trap to avoid
The trap: treating a call wall as a sell order. GEX tells you where obligatory flow should concentrate, not which way the market will go: DeepCharts says so explicitly. A wall can be broken, and when it breaks in negative gamma the move accelerates instead of stalling. It's context to confirm on the tape, never an entry signal.
Combine it with
Combine it with the GEX Heatmap (how levels evolve through time) and above all with your footprint: gamma gives you the place, order flow gives you the moment. Without absorption or aggression confirming at the level, all you have is a line on a chart.
FAQ
What is GEX (gamma exposure)?+
It's the net gamma exposure of market makers on an index's options. It sets the direction of their hedging: in positive GEX they buy dips and sell rallies, dampening volatility; in negative GEX they do the opposite and amplify the move.
Does the GEX Profile work on NQ?+
The GEX Profile relies on SPX options, listed on Cboe, whose hedging spills into the ES future. NQ has no equivalent participant data: DeepCharts computes NDX, QQQ and SPY from OPRA data with a proprietary formula, an approximation, not a measurement.
How often do the levels change?+
SPX data refreshes every minute. The big walls move little intraday, but the zero-gamma level can shift noticeably when price accelerates or as an expiration approaches.
Which instruments does the GEX Profile work on?+
SPX only, through an Option Chart on symbol ES-CME. The indicator relies on the participant data published by Cboe, which actually identifies market maker executions, and that data exists only on SPX options.
What is the difference between Gex and Gex split?+
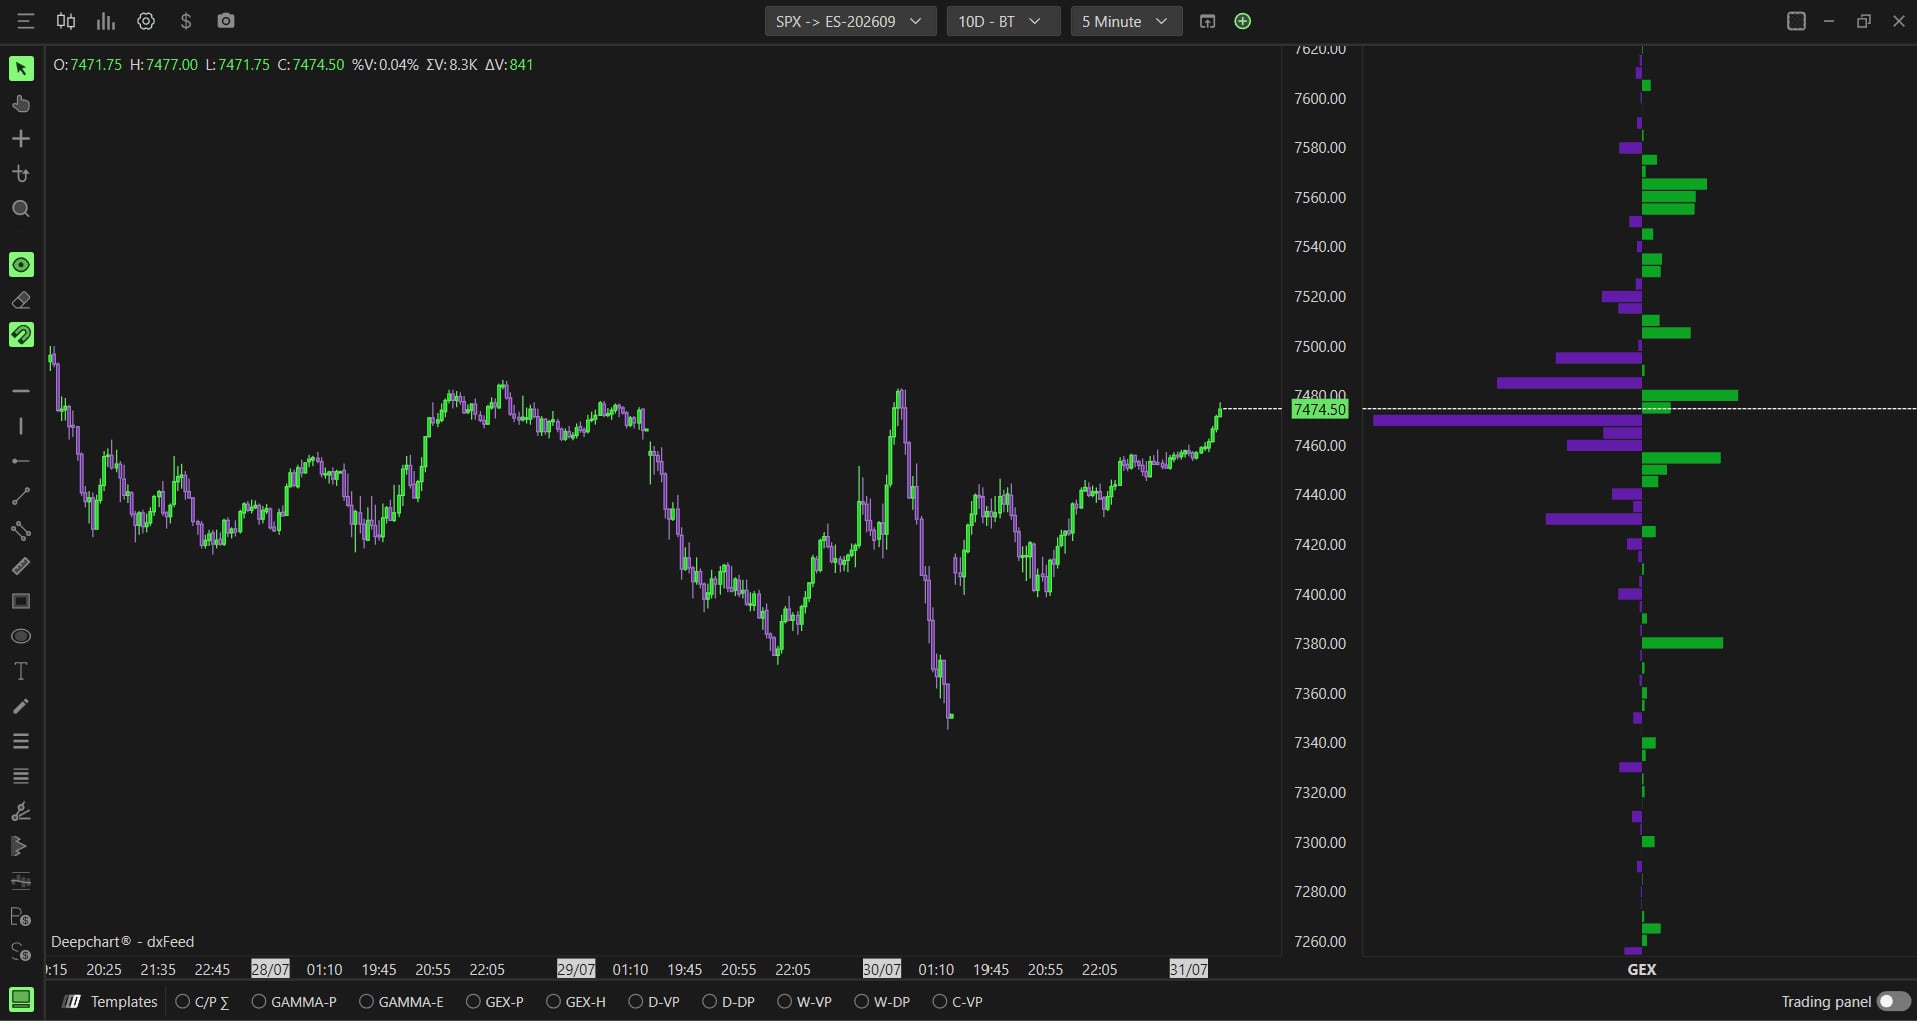
The single mode draws one column, green marking positive GEX and purple negative GEX. The split mode, obtained with the Gex (Market Maker C/P) source, places the call side and the put side either side of a centre line, which makes comparing the two immediate.
Do I need to turn the peak lines on?+
They already are: Show Line is on by default in both sections of the Peak tab, while Enable and Highlight are not. So you get the horizontal lines without touching anything, and Highlight only adds colouring of the matching bar.
Tutorial & settingsGEX Profile: the complete setup, tab by tab
+Data source, profile width, peak lines, rolling values and summary: every setting with its default value and what it changes on screen.
The GEX Profile shows dealer gamma exposure strike by strike, in a vertical panel pinned to the right edge of the chart. Before configuring it you need an SPX option chart: the indicator requires real Cboe participant data and exists on no other symbol. This tutorial walks through every settings tab in the order DeepCharts presents them, with the values worth knowing and what each one changes on screen.
- An SPX option chart opened through New then Option Chart (symbol ES-CME, exchange CME)
- An active DeepGamma subscription: without Cboe participant data the indicator stays empty
Step by step
- 01
Open an SPX option chart
The indicator cannot be added to an ordinary futures chart. Go to New in the top menu, then Option Chart, and pick SPX in the selection box, which shows symbol ES-CME and exchange CME. It is the only accepted symbol: the GEX Profile reads the participant data published by Cboe, which exists only on SPX options.
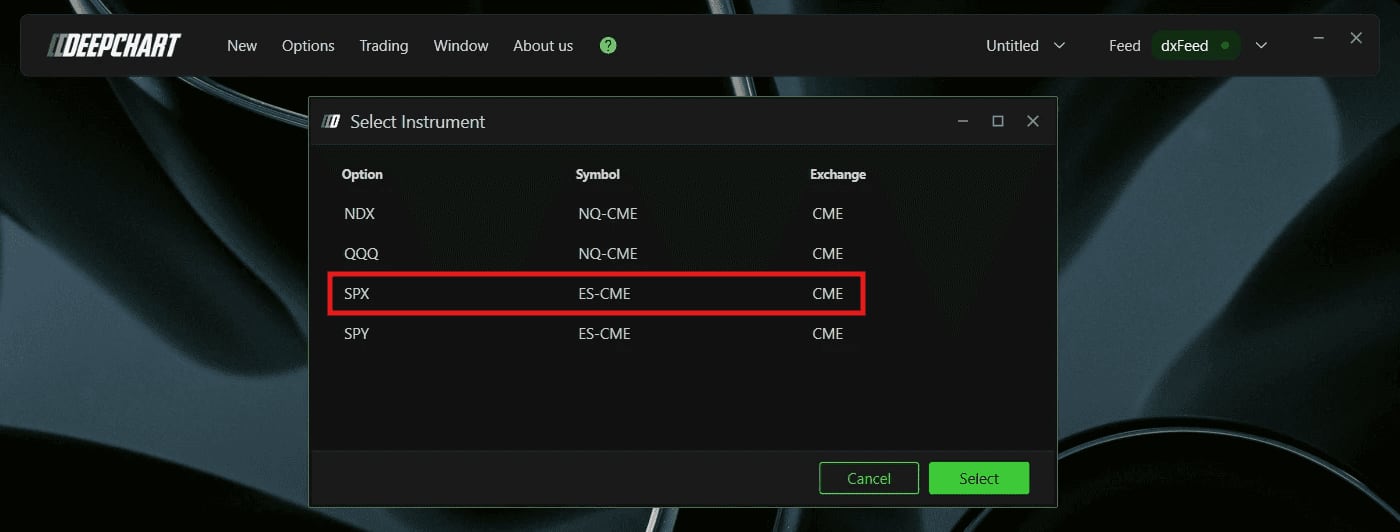
The Option Chart instrument selection box, with SPX and its ES-CME symbol.© DeepCharts - 02
Add the indicator, or load it in one click
Two routes reach the same result. The first goes through the Indicator Add button in the toolbar: search for Option Gex Profile, click the plus, then the settings icon. The second, faster during the session, uses the Templates bar at the bottom of the chart: the GEX-P button loads the indicator with the last settings used, and right clicking that tab opens Settings directly.

The Templates bar at the bottom of the chart, with the GEX-P button and its Settings context menu.© DeepCharts - 03
Pick the data source in the General tab
Data source is the only setting that changes what you read, every other one changes only how it is displayed. Gex (Market Maker), the default, gives net dealer gamma exposure as Cboe reports it: the reference read. Gex (Market Maker C/P) takes the same data but separates the call side from the put side, which produces the two column profile around a centre line. The other four sources answer different questions: Market Maker Net Flow isolates net dealer delta flow, Call/Put OI-R shows real time open interest with no gamma weighting, Dex (Market Maker) shows directional hedging pressure rather than gamma sensitivity, and Gex (Call OI-R - Put OI-R) recomputes gamma on live open interest.
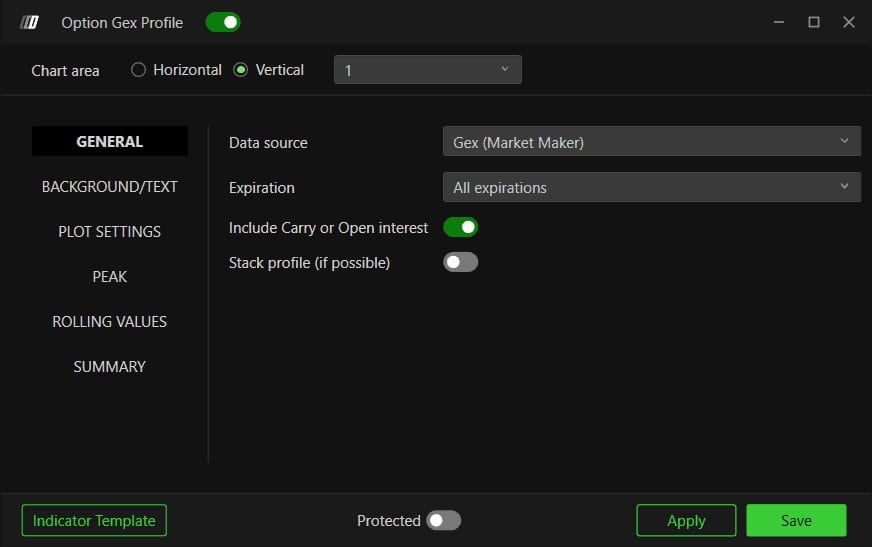
The General tab: Data source and its six sources, Expiration, Include Carry or Open interest, Stack profile.© DeepCharts - 04
Set the profile geometry in Plot Settings
The Width/Offset section controls how much room the profile takes. Width type is Automatic by default, with three manual modes available: Percentual period, Window width, Fixed bars. Current Width, ten by default, and Current Offset, zero, size and shift the current session profile; Previous Width, fifteen, and Previous Offset, zero, do the same for earlier sessions. The Visual Appearance section handles the rest: Number of profile, five by default, sets how many sessions show at once, Vbp opacity is ninety, Border width one, and Visual style switches between Solid and Hollow. Show above bars, Align to the right and Always visible are off by default; the last one keeps the profile on screen while you scroll the chart.
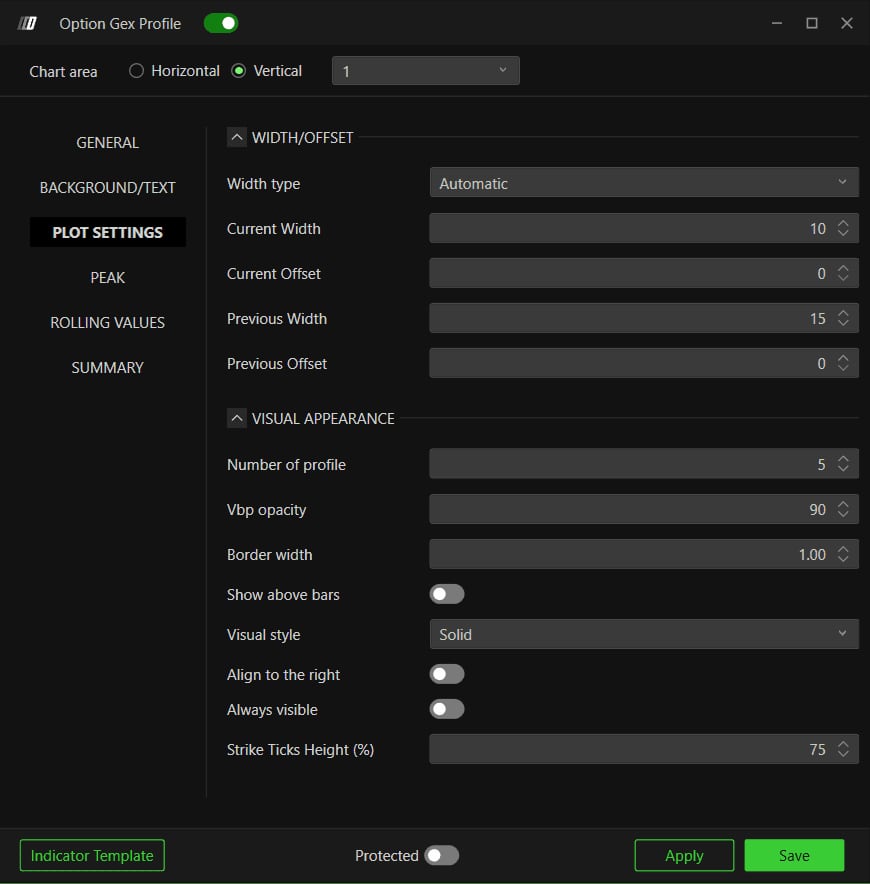
The Plot Settings tab, Width/Offset and Visual Appearance sections.© DeepCharts - 05
Turn on the peak lines in the Peak tab
The Peak tab marks the two most loaded strikes, one per side, and it is the setting that makes the profile readable at a glance. Two identical sections: Positive (Call Side) and Negative (Put Side). Enable and Highlight are off by default, Show Line is on: you already get the horizontal lines without touching anything. Highlight Color is green on the call side, purple on the put side, Line Width is one, and Line Style offers Solid, Dash, Dot, Dash dot and Dash dot dot, with Dash by default. Turn Highlight on if you also want the bar itself coloured, not just the line drawn.
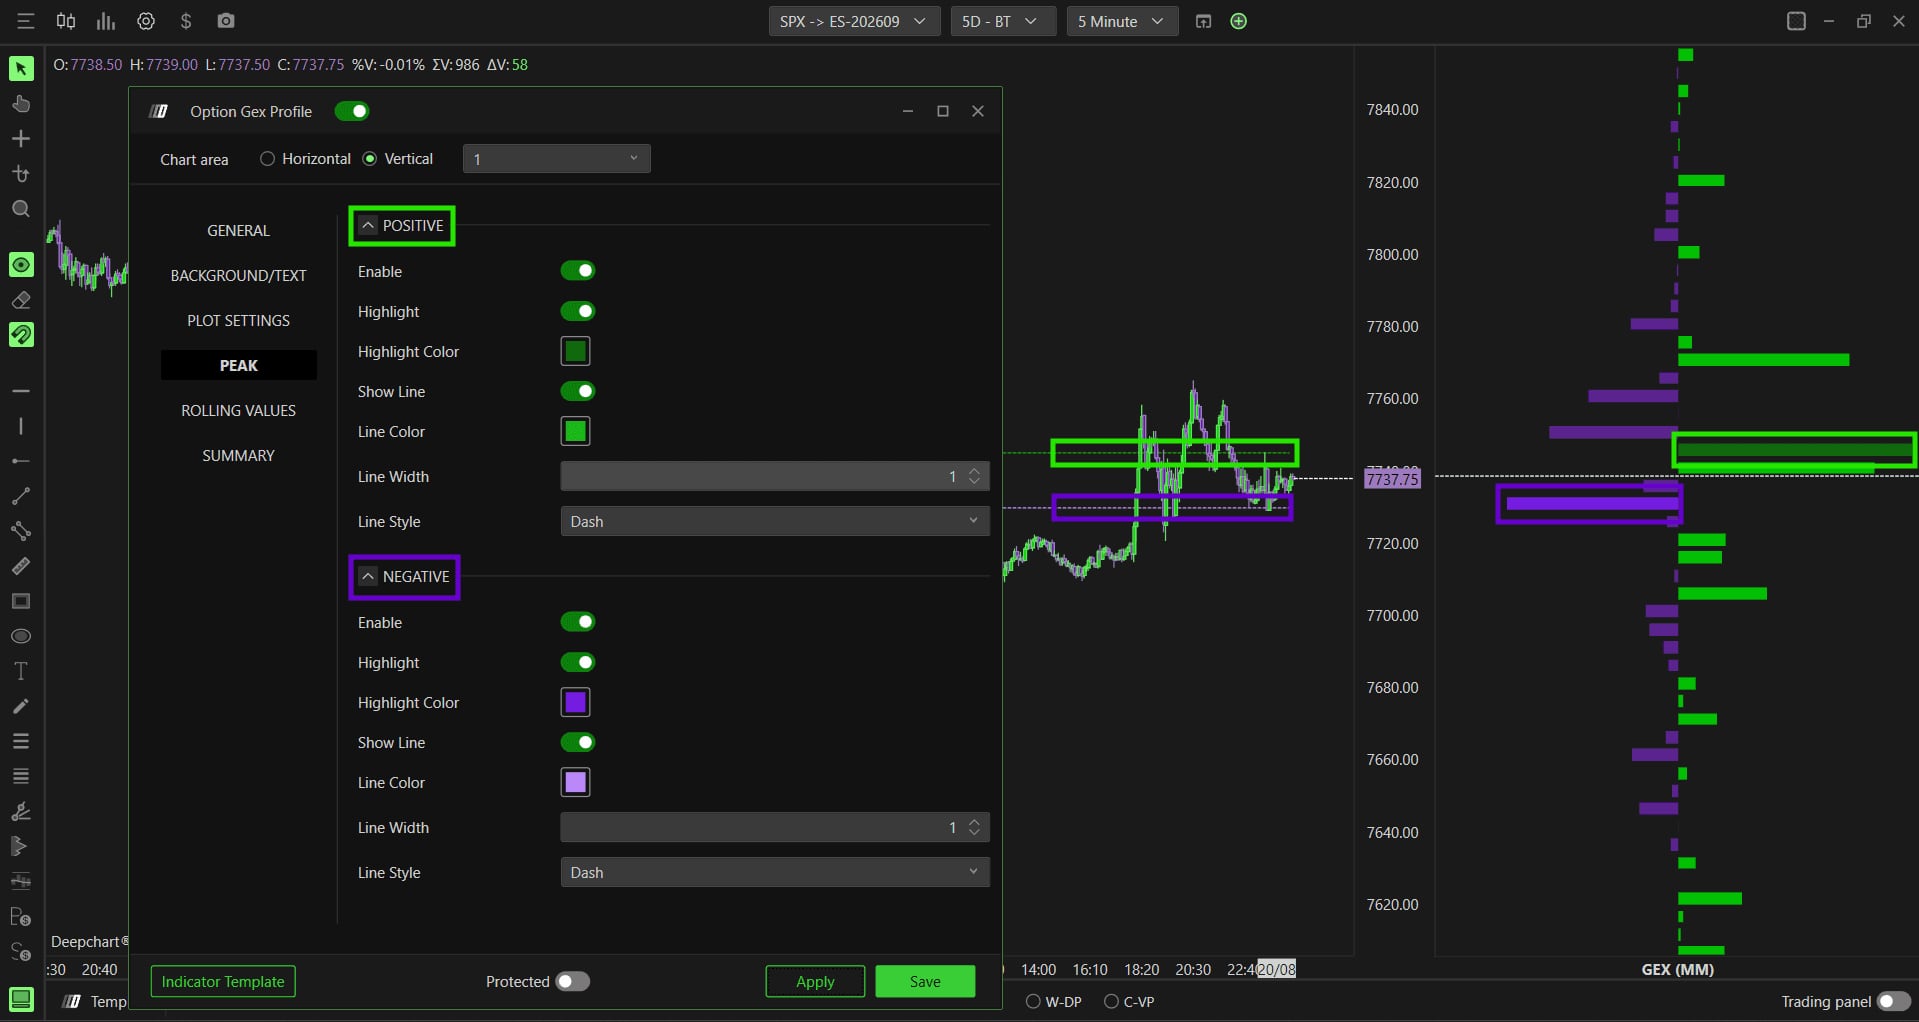
The Peak tab, with the Positive (Call Side) and Negative (Put Side) sections.© DeepCharts - 06
Add rolling values and the summary
Rolling Values redraws the profile as it stood one, five, fifteen and thirty minutes ago, as overlaid lines: that is how you watch positioning build or unwind during the session. All four steps are off by default, each with its own width, line style (Dot for M1 and M5, Dash for M15, Solid for M30) and colour. The Summary tab, also off by default, prints cumulative totals straight on the chart, with Text Color white, Positive Color green, Negative Color red and Text size twelve. Turn both on gradually: four rolling lines at once make the profile unreadable.
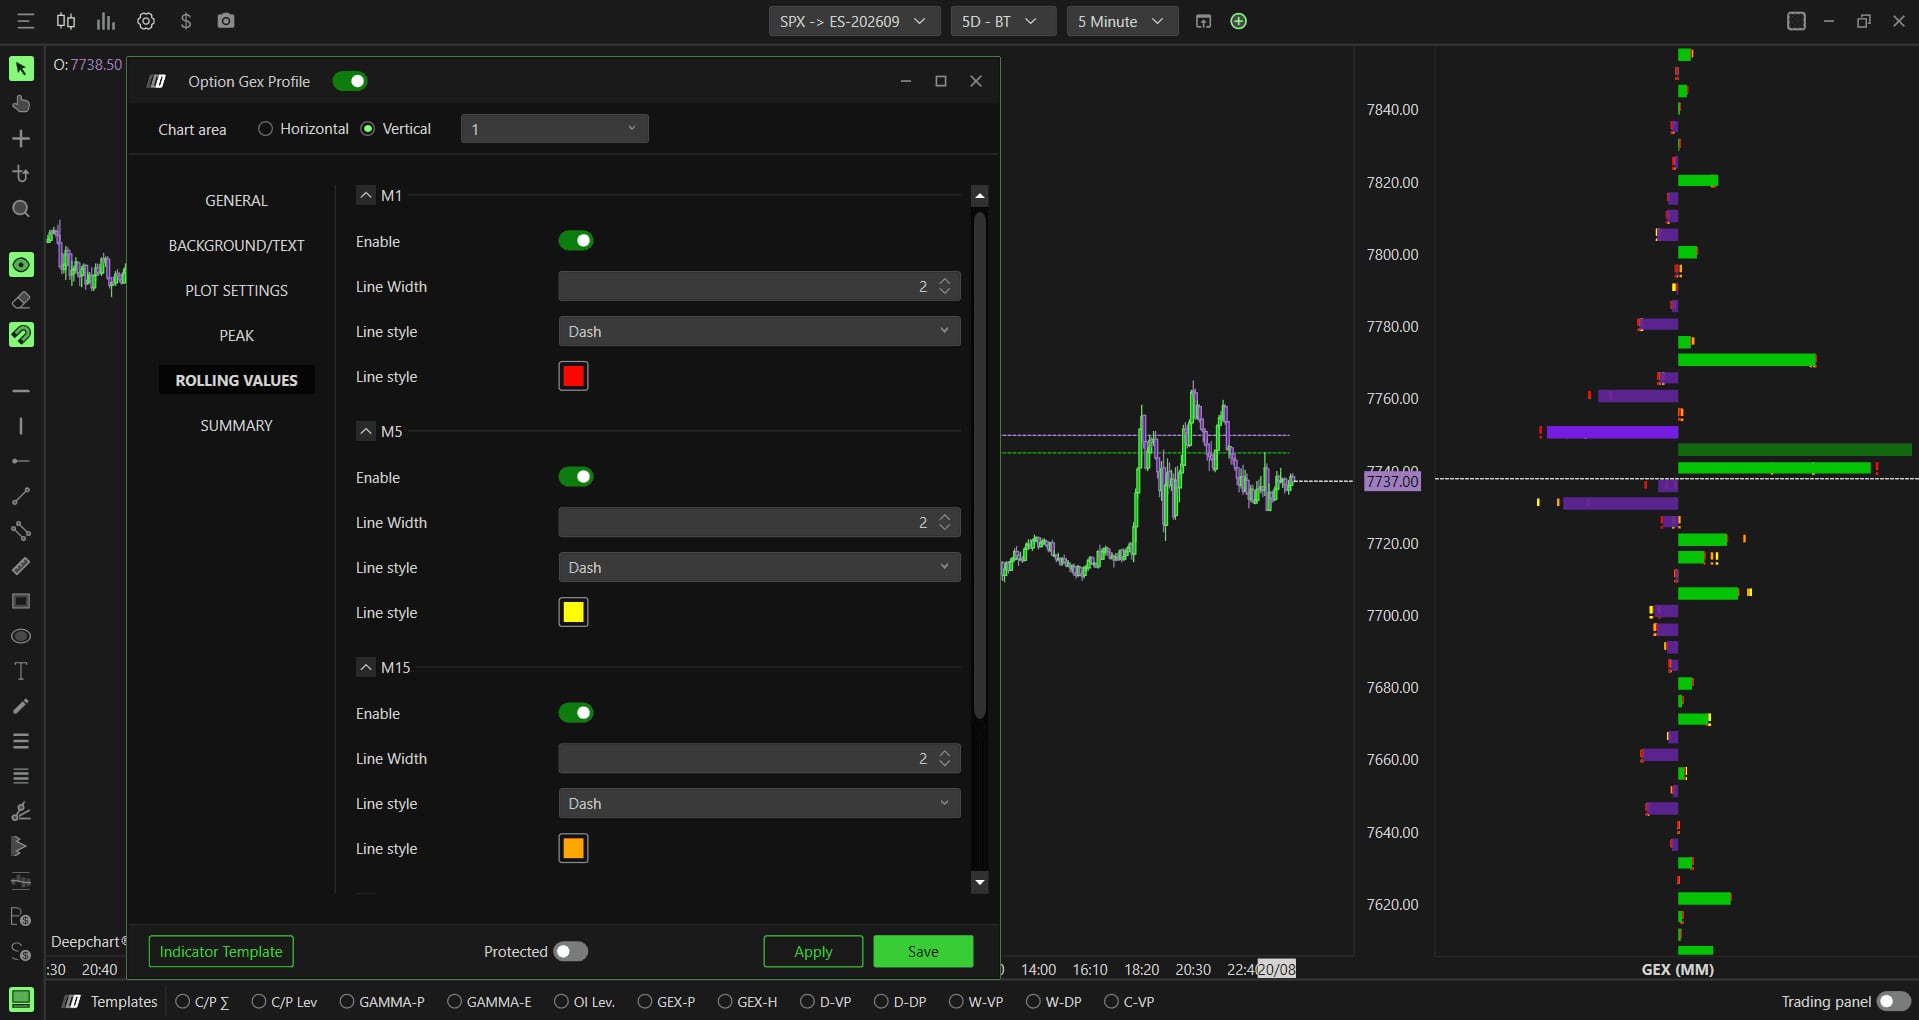
The Rolling Values tab, its four time steps, and their lines overlaid on the live profile.© DeepCharts
Settings, tab by tab
The only tab that changes the data being read rather than how it looks.
Net dealer gamma exposure as reported by Cboe.
Produces the two column read around a centre line.
Isolates market maker buy and sell activity.
Standing positions, with no gamma weighting.
Directional hedging pressure rather than gamma sensitivity.
Structural view of positioning.
Tighten onto short expirations to keep only same day hedging.
Includes open interest carried from previous sessions.
Stacks session profiles instead of placing them side by side.
Prints the numeric labels on the profile.
Marks strikes where the data overlaps.
Other modes: Percentual period, Window width, Fixed bars.
Width and shift of the current session profile.
Same settings for earlier sessions.
How many sessions show at once.
Solid or Hollow.
Always visible keeps the profile on screen while you scroll.
Height of each strike bar, as a percentage of the available spacing.
Colours the most loaded strike's bar, on top of the line.
Horizontal line at the most concentrated positive GEX strike.
Solid, Dash, Dot, Dash dot, Dash dot dot.
Horizontal line at the most concentrated negative GEX strike.
Same options as the call side.
The profile as it stood 1, 5, 15 and 30 minutes ago, drawn as lines.
Prints cumulative totals on the chart.
⚠ Traps to avoid
- Looking for the GEX Profile on anything other than SPX. It requires real Cboe participant data: on ES, NQ or any other futures chart the indicator will not appear, and that is not a settings problem to solve.
- Confusing Gex and Dex in Data source. The first measures gamma sensitivity, so the intensity of hedging flow to come; the second measures delta exposure, so the direction already taken. Two different questions, not two ways of showing the same thing.
- Turning on all four Rolling Values steps at once. Four ghost profiles stacked on the live one and you read nothing. One step at a time, chosen to match your trade horizon.
Want to get better at order flow?
We discuss flow, liquidity and our trades live, every day, on the OrderFlowFutures Discord. Join us, it's free.
Join the Discord for free7 online·76 members·Free · instant access