Updated · first published
What is GEX Heatmap (DeepGamma)?
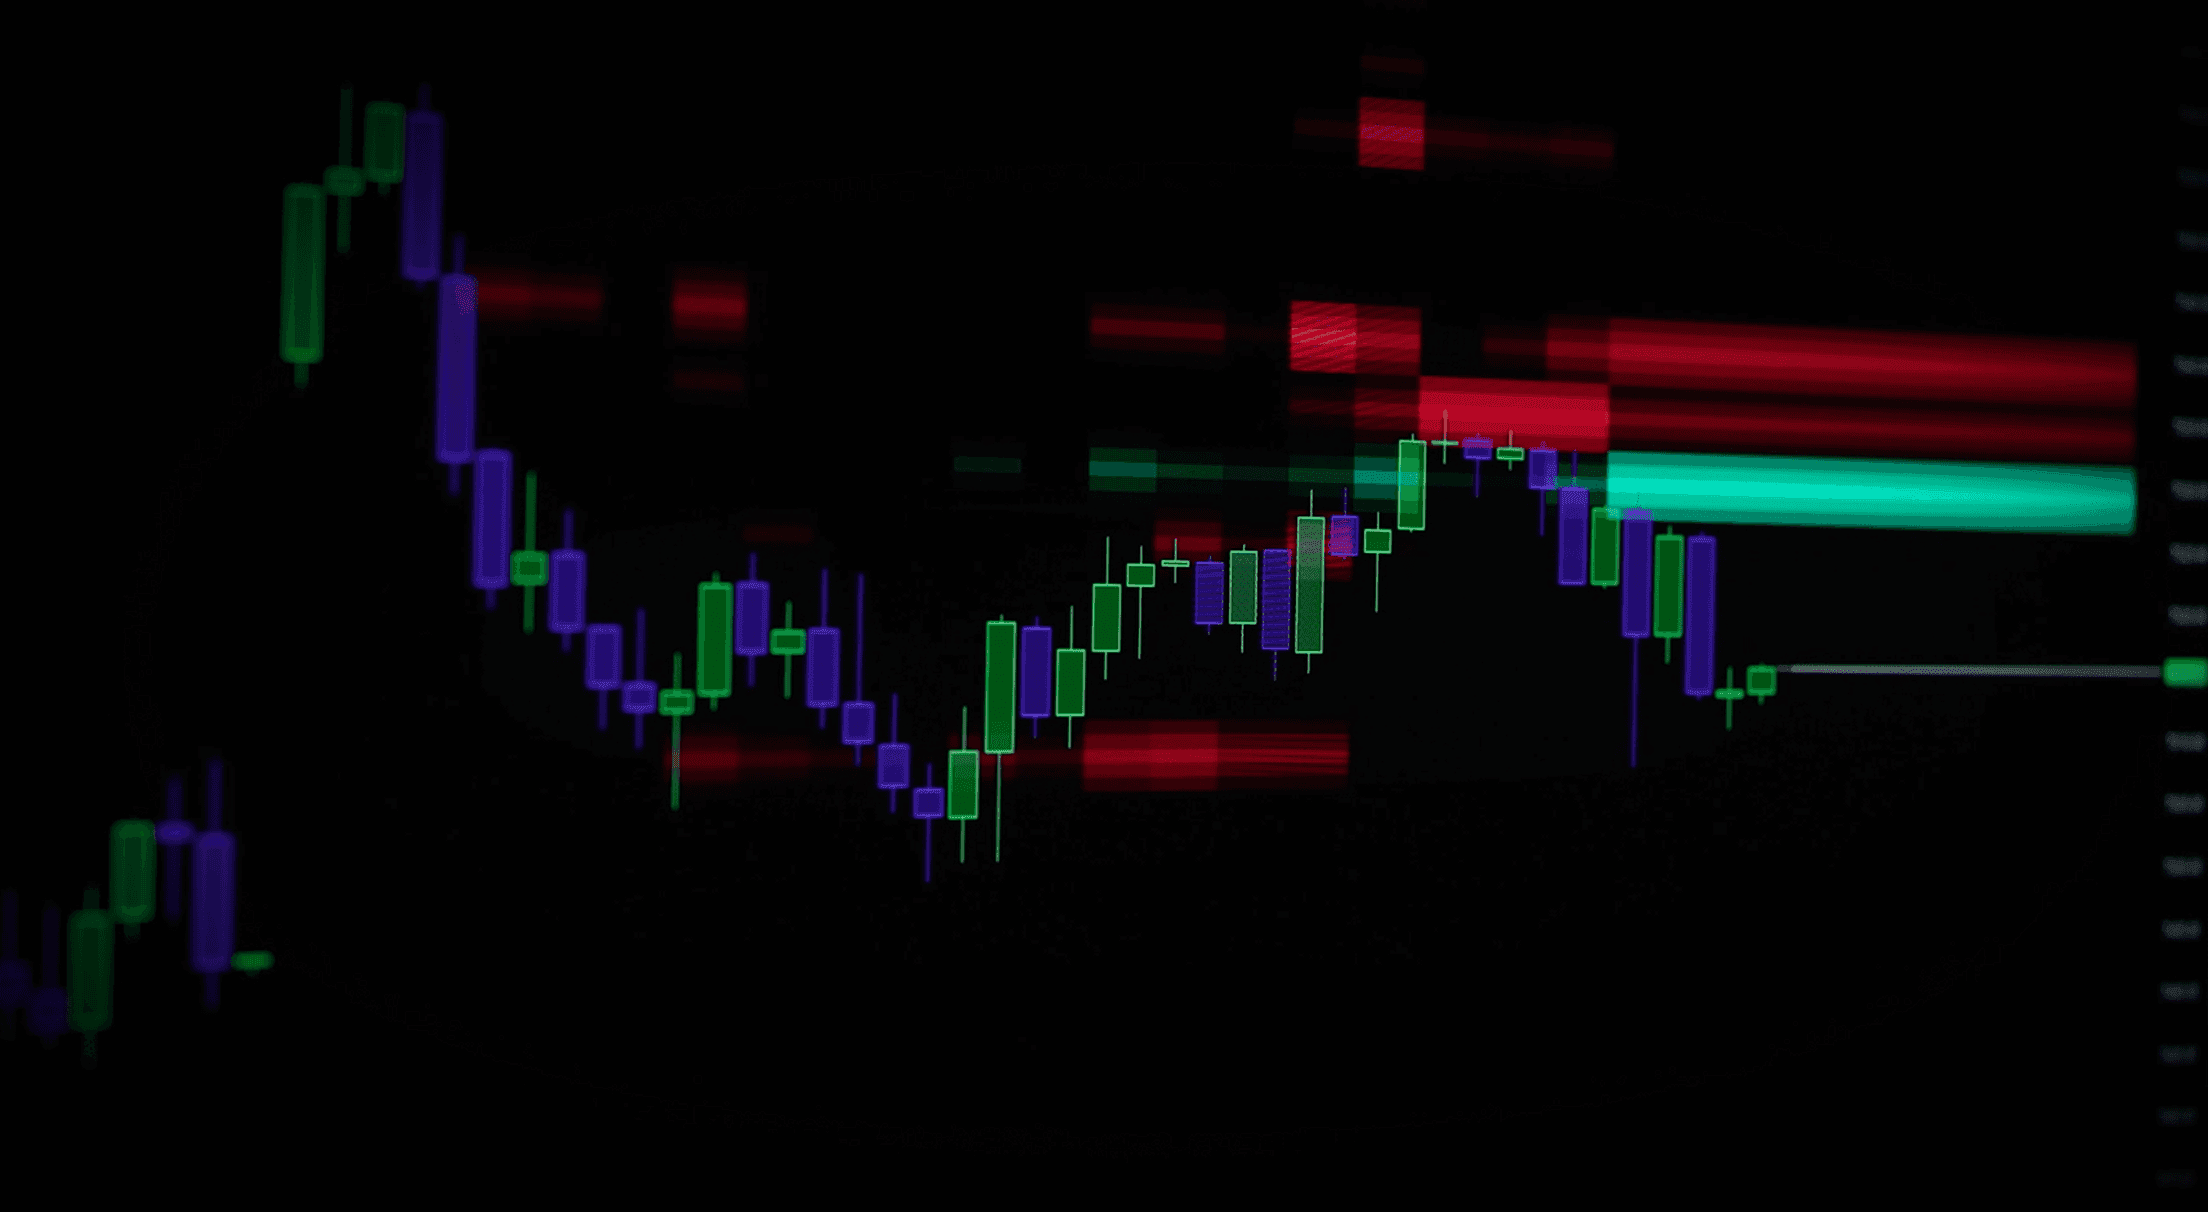
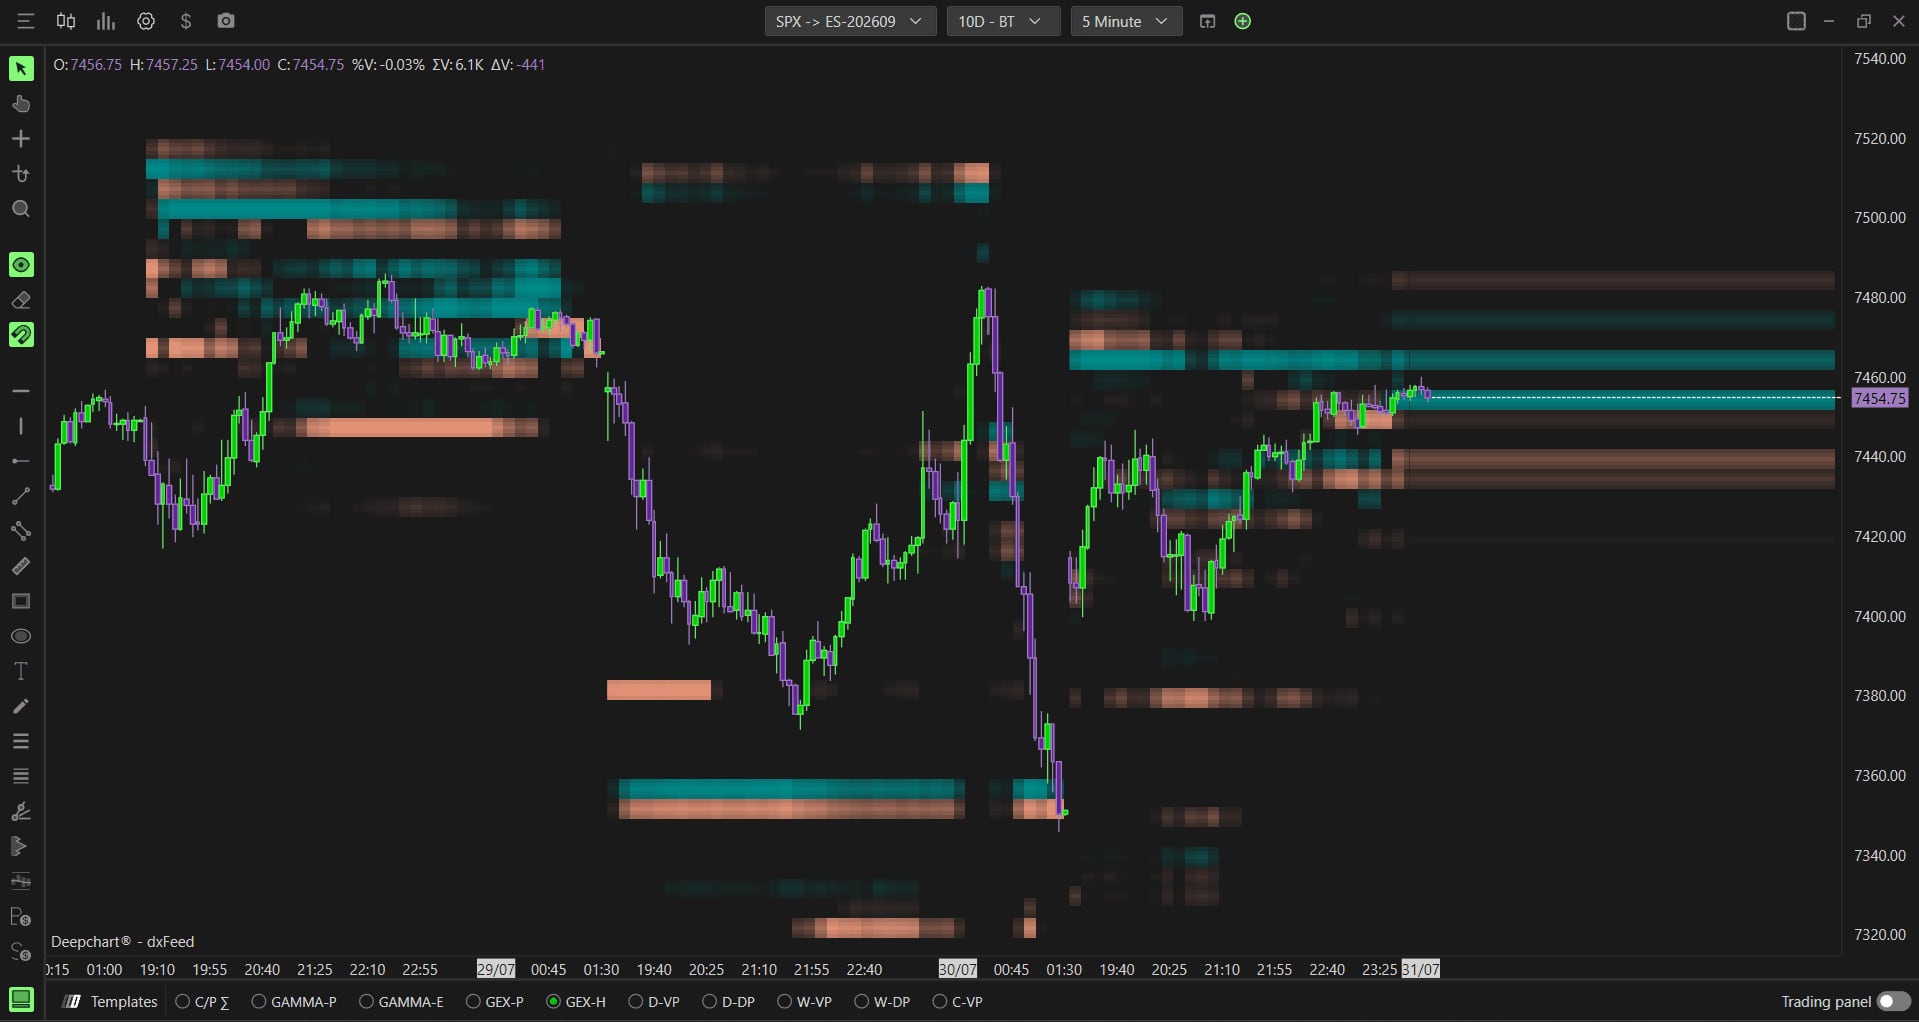
The GEX Profile is a photograph: exposure at one moment. The heatmap is the film. It paints colored blocks on the price chart at each level: cool tones where dealers are long gamma at that price, their hedging dampens the move, warm tones where they are short gamma, their hedging amplifies it. Color intensity gives the strength of the exposure.
What DeepCharts does better
Like the rest of DeepGamma on SPX, the heatmap is computed from Cboe participant data, so from identified market makers rather than a convention. More importantly, it renders inside the same platform as the DeepDom liquidity heatmap: you overlay two layers of context, resting liquidity in the book, and the gamma exposure that will generate obligatory flow, without juggling two pieces of software.
Using it day to day
Read it like the liquidity heatmap: what matters is how price reacts approaching a dense block, not the block itself. Filter expiration to your horizon (0DTE for the session, longer for the week's context) and keep it in the chart background at low opacity so it doesn't drown your order flow.
Example: ES rises toward a thick warm band, a negative-gamma zone. Instead of stalling, price cuts through and accelerates: short-gamma dealers have to buy while it goes up. The same band in cool tones would have produced the opposite, a soft ceiling. Two structures that look identical, two opposite behaviors: the color is what separates them.
⚠ The trap to avoid
The trap: reading it as classic support and resistance. A dense block in positive gamma brakes; the same block in negative gamma accelerates. Confusing the two puts you exactly on the wrong side of the hedging flow.
Combine it with
Combine it with the GEX Profile (the numeric levels), the DeepDom liquidity heatmap (orders actually resting in the book) and the footprint (execution). Gamma explains why a zone reacts; the book shows what it reacts with.
FAQ
Which instruments is the GEX Heatmap available on?+
SPX only, because it requires real Cboe participant data. The other option symbols DeepGamma covers (NDX, QQQ, SPY) rely on OPRA data and a proprietary formula.
What do the colors mean?+
Cool tones mark positive GEX: dealers are long gamma and their hedging dampens moves. Warm tones mark negative GEX: their hedging amplifies moves. Intensity indicates the size of the exposure at that level.
Can it be backtested?+
Yes. DeepCharts advertises roughly nine months of granular history on this data, replayable alongside order flow: enough to check a read on past sessions rather than take it on faith.
Which instruments does the GEX Heatmap work on?+
SPX only, through an Option Chart on symbol ES-CME, because it requires real Cboe participant data. The other option symbols DeepGamma covers rely on OPRA data and a proprietary formula.
Which intensity mode should I choose?+
Proportional combined, the default, is the one DeepCharts recommends: it weights half the current session and half the same time of day in previous sessions, which stops a quiet morning from flattening the whole map or a violent open from saturating it.
What exactly does % Cut off do?+
It sets the minimum percentage below which a block is no longer drawn. It is the density dial for the map: the higher you push it, the more weak levels disappear and the more the genuinely loaded zones stand out.
Tutorial & settingsGEX Heatmap: the complete setup, tab by tab
+Data source, expiration filter, intensity mode, cut off threshold and palette: every setting with its default value and what it changes on screen.
The GEX Heatmap paints dealer gamma exposure straight onto price, as horizontal blocks whose colour tells you the side and whose intensity tells you the strength. Before configuring it you need an SPX option chart: like the rest of DeepGamma on that symbol, it requires real Cboe participant data. This tutorial walks through every settings tab in the order DeepCharts presents them, with the values worth knowing and what each one changes on screen.
- An SPX option chart opened through New then Option Chart (symbol ES-CME, exchange CME)
- An active DeepGamma subscription: without Cboe participant data the heatmap stays empty
Step by step
- 01
Open an SPX option chart
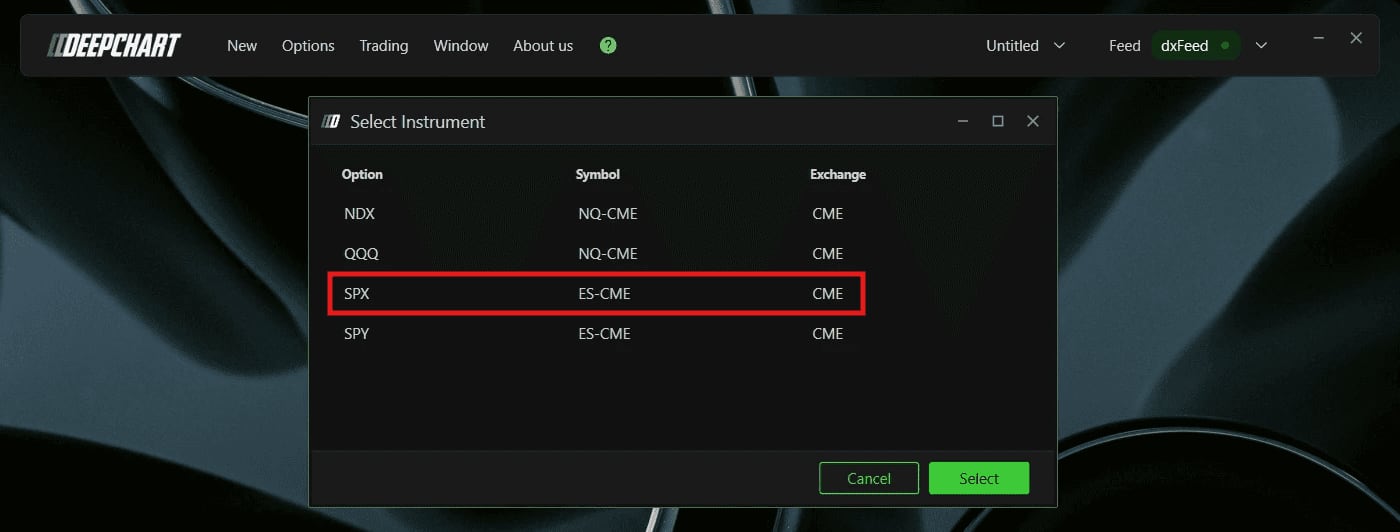
The heatmap cannot be added to an ordinary futures chart. Go to New in the top menu, then Option Chart, and pick SPX in the selection box, which shows symbol ES-CME and exchange CME. It is the only accepted symbol: the indicator reads the participant data published by Cboe, which exists only on SPX options.
The Option Chart instrument selection box, with SPX and its ES-CME symbol.© DeepCharts - 02
Add the heatmap, or load it in one click
Two routes reach the same result. The first goes through the Indicator Add button in the toolbar: search for Option Gex Heatmap, click the plus, then the settings icon. The second, faster during the session, uses the Templates bar at the bottom of the chart: the GEX-H button loads the indicator with the last settings used, and right clicking that tab opens Settings directly.

The Templates bar at the bottom of the chart, with the GEX-H button and its Settings context menu.© DeepCharts - 03
Read the colours before touching any setting
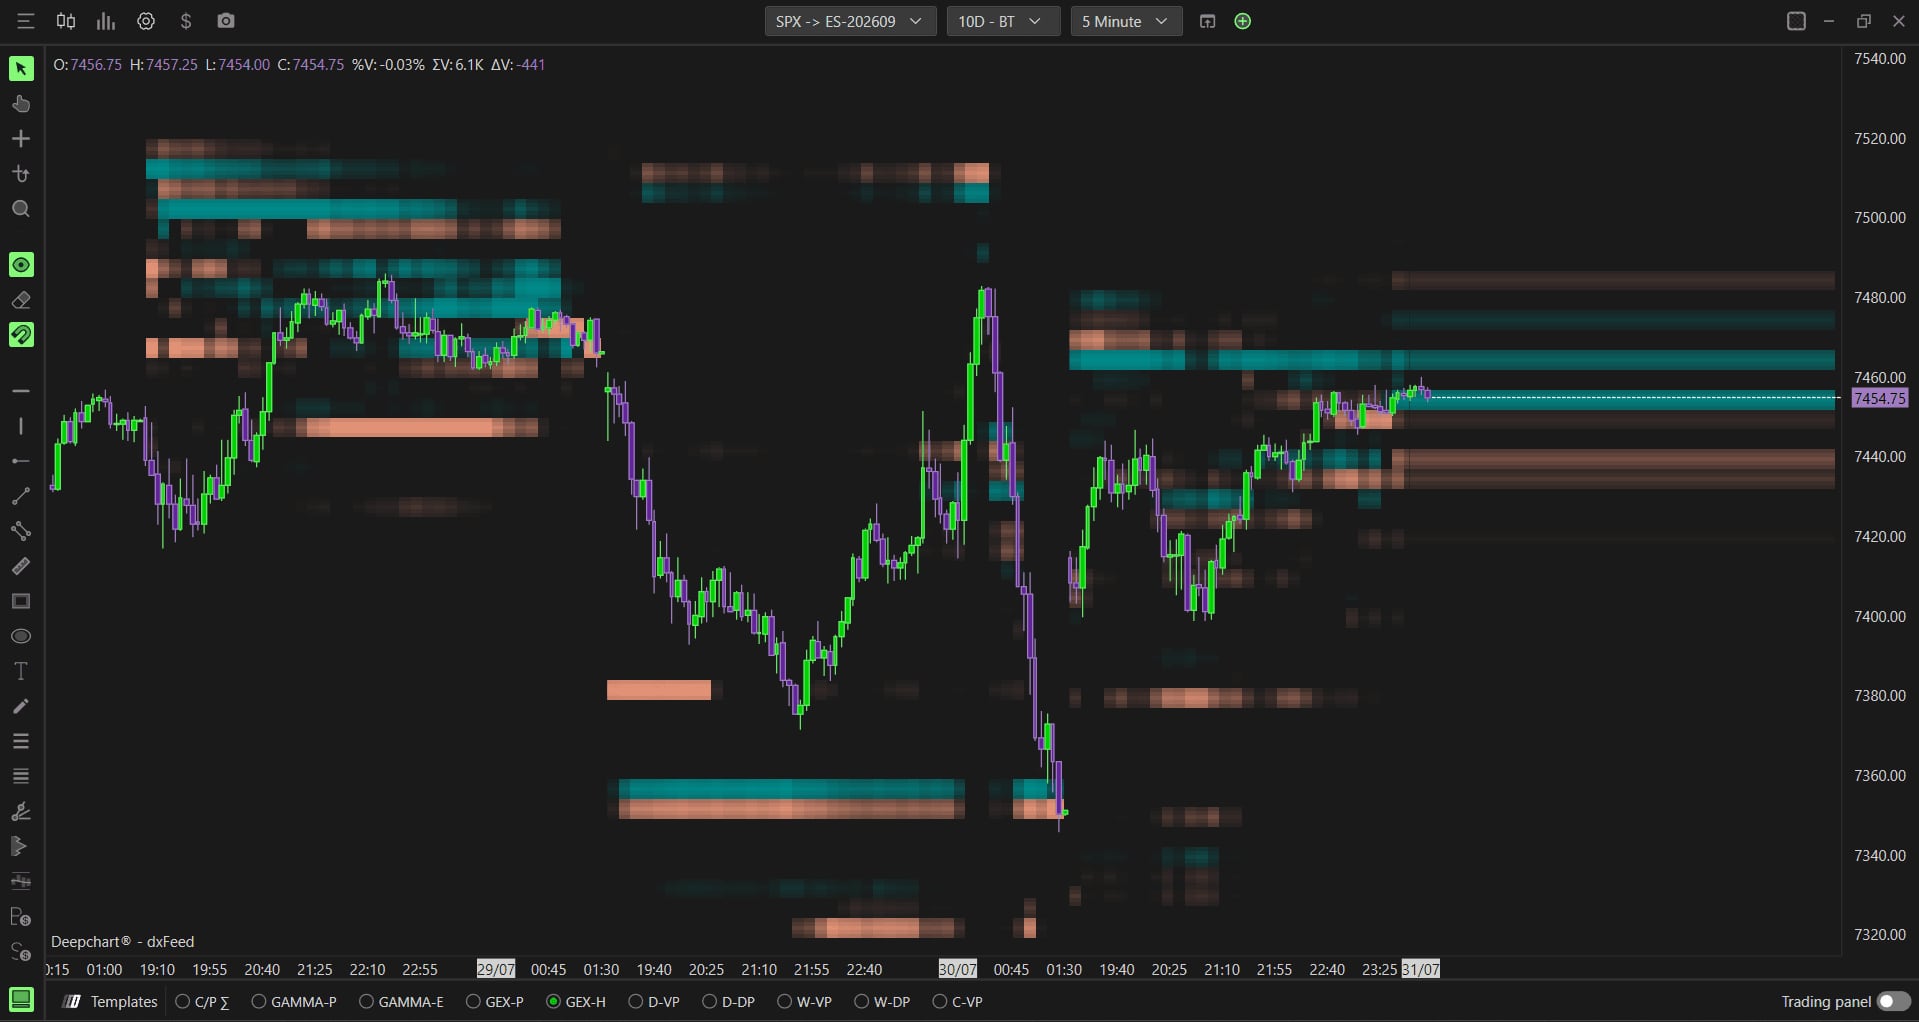
Cyan blocks mark positive gamma: dealers are long gamma and their hedging dampens moves. Orange blocks mark negative gamma: they are short gamma, and their hedging amplifies moves. The wider the block and the more intense the colour, the more significant the exposure at that level. Everything else in the configuration only decides which data feeds those blocks, and which blocks deserve to be drawn.
The heatmap on price, with cyan blocks above and orange blocks below.© DeepCharts - 04
Pick the source and frame the expirations in the General tab
Data source offers eight reads. Gex (Market Maker), the default, is the only one built on gamma exposure actually reported by Cboe: keep it until you have a specific reason to switch. Gex (Call - Put) applies the standard market convention, that dealers are long calls and short puts; its whole point is to compare that naive calculation against the real data. Dex (Market Maker) switches to delta exposure, Gex (Call OI-R - Put OI-R) computes gamma on real time open interest, Market Maker Net Flow isolates net dealer delta flow, and the last three, Call/Put Sigma, Call Sigma - Put Sigma and Call/Put OI-R, show raw activity with no gamma weighting at all. Just below, Option expiration type is 0 DTE by default, meaning only options expiring the same day, whose hedging weighs most on the session; the other values widen out step by step to All expirations. Include Carry or Open Interest, off by default, adds open interest carried over from previous sessions. Widening both at once changes the map completely: move one setting at a time.
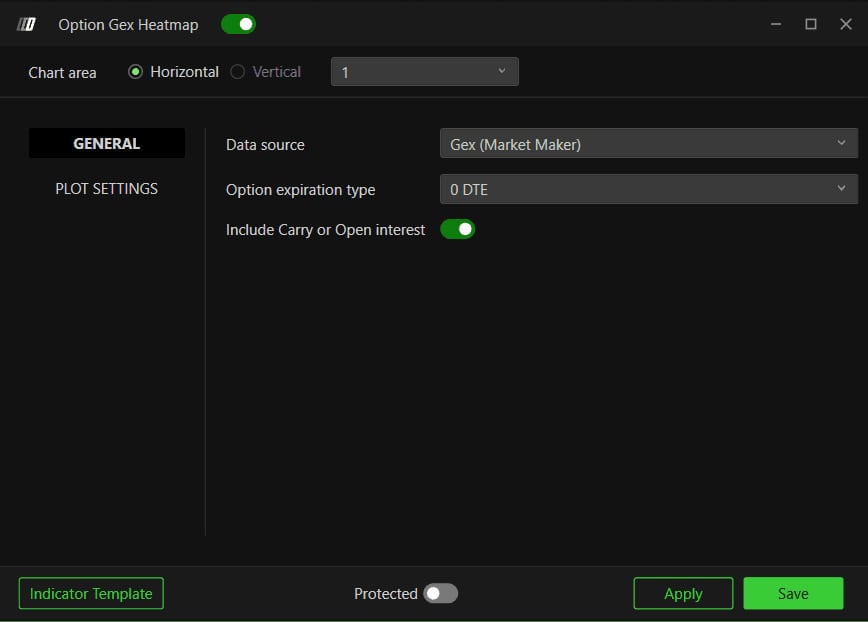
The General tab with Data source, Option expiration type and Include Carry or Open Interest.© DeepCharts - 05
Set intensity, colours and spread in Plot Settings
The Intensity section decides readability. Mode is Proportional combined by default, and it is the value DeepCharts recommends: intensity is weighted half on the current session, half on the same time of day in previous sessions. Proportional session looks only at today, Proportional time average only at the history at that hour. Std. Dev is one. % Cut off is thirty: the threshold below which a block is no longer drawn, so the dial to raise when the map is crowded and to lower when it is too empty. % Max. opacity is ninety. The Colors section holds just two entries, Call / Positive in cyan and Put / Negative in orange: this is where you pull the palette apart from the DeepDom liquidity heatmap if you stack the two. The Various section holds Extend far right, off by default, which stretches the blocks further right beyond their normal range.
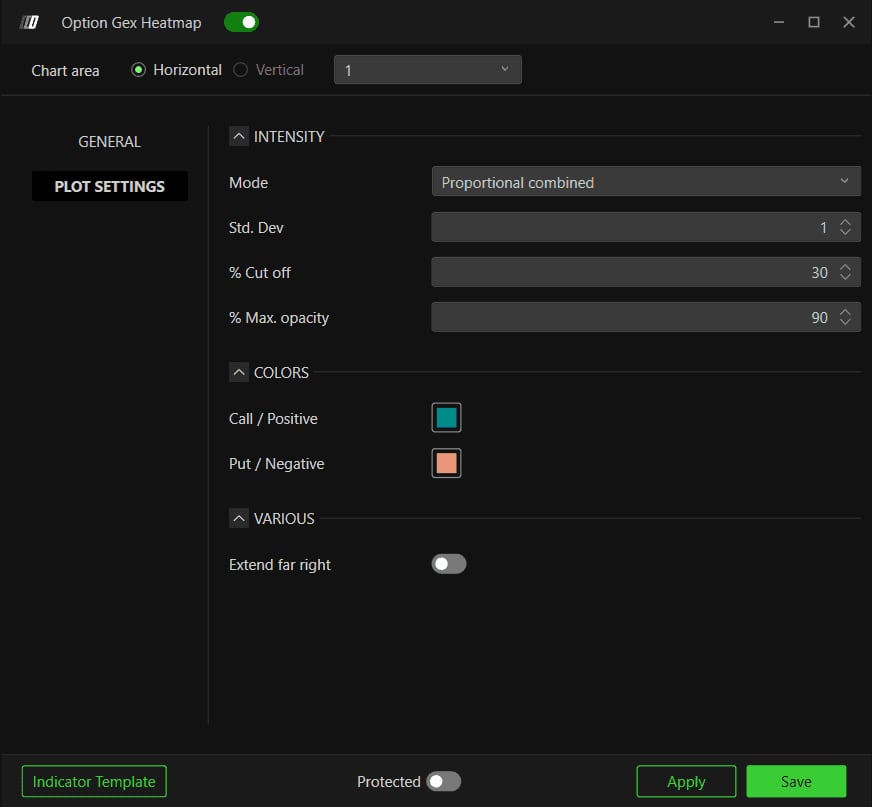
The Plot Settings tab with the Intensity, Colors and Various sections.© DeepCharts
Settings, tab by tab
Dealer gamma exposure as actually reported by Cboe.
Assumes dealers are long calls and short puts.
Up to 1 to 7 days, 31 d, 91 d, or All expirations.
Adds open interest carried from previous sessions.
The group that decides how readable the map is.
50/50 weight between current session and past time average, the recommended value.
Threshold below which a block is not drawn. Raise it when the map is crowded.
Stretches blocks further right beyond their normal range.
⚠ Traps to avoid
- Leaving % Cut off at thirty on a heavy session, then concluding the heatmap is unreadable. That threshold exists precisely to filter: raise it until only the levels that matter remain on screen.
- Switching to All expirations for more information. The hedging that weighs on the session comes first from same day options; opening every expiration drowns the intraday signal under months of positioning.
- Comparing the Gex (Market Maker) source with Gex (Call - Put) as if one confirmed the other. The second is a calculation by convention, not a measurement: the gap between them tells you about the convention, not about the market.
Want to get better at order flow?
We discuss flow, liquidity and our trades live, every day, on the OrderFlowFutures Discord. Join us, it's free.
Join the Discord for free7 online·76 members·Free · instant access