Updated · first published
What is Gamma Bands (DeepGamma)?
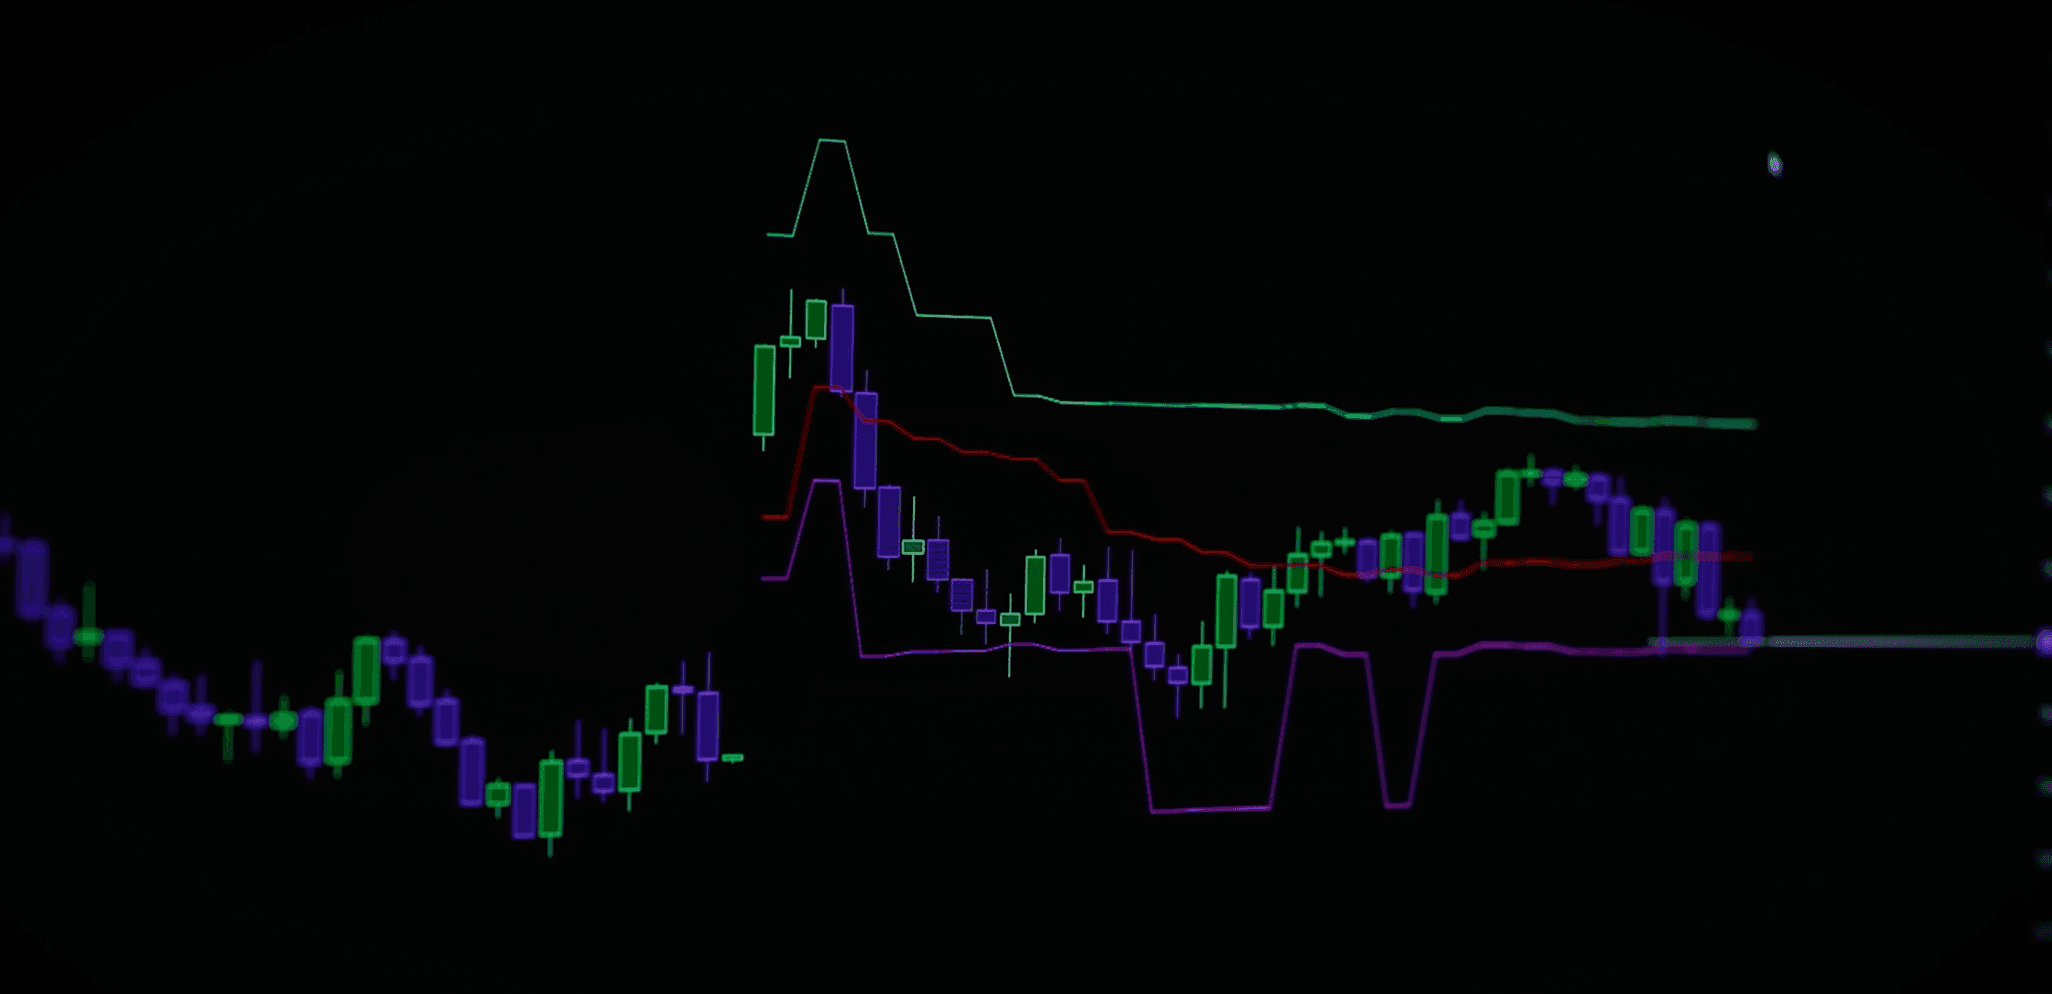
Gamma Bands turn gamma exposure into a pair of boundaries drawn around price. While the market trades inside them, dealer hedging works against the move: it absorbs. When a boundary gives way, the same mechanic flips and starts pushing in the direction of the break. The band isn't a magic level: it's the frontier between two volatility regimes.
What DeepCharts does better
Three things. The bands are computed from observed Cboe market-maker positioning rather than an assumption. They're native to the platform, so they overlay on your footprint and DOM without hand-copying levels exported from a third-party service. And they're replayable over history alongside the flow, so you can check how they hold session after session instead of taking them at face value.
Using it day to day
Draw them in the morning and leave them. They pick your strategy, not your entry: inside, you fade the extremes and cut your targets; on a confirmed break, you switch to trend-following and let it run. On ES, and by correlation on NQ.
Example: ES spends the morning pinned between its two bands, every attempt to leave gets absorbed, a range-scalping day. Early afternoon the upper band gives way with sustained aggression on the footprint: the regime flips, dealers have to buy higher. The trader who kept selling the highs out of habit took the move square in the face.
⚠ The trap to avoid
The trap: treating them as Bollinger bands. A Gamma Band has no statistical virtue of its own; its value comes from marking a change in dealer behavior. Without flow confirming the break, you're trading a line, not a market.
Combine it with
Combine them with the GEX Profile (the session's fixed levels: call wall, put wall, zero gamma) and delta (the real effort behind a break). The bands frame the session, order flow arbitrates each attempt.
FAQ
Gamma Bands vs GEX Profile, what's the difference?+
The GEX Profile shows exposure strike by strike, like a volume profile. Gamma Bands derive boundaries drawn on price from it, more directly usable intraday to tell whether you're in a range or a trending regime.
Should I trade bounces off the bands?+
Only with confirmation. A band indicates where dealer hedging should slow price, not that it will. A rejection has to show on the footprint, as absorption and a lack of aggressive follow-through, before it's tradable.
Do the bands change intraday?+
Yes. They track an exposure that evolves with traded option volume, particularly as a 0DTE expiration approaches.
Which instruments are Gamma Bands available on?+
NDX, QQQ, SPY and SPX, through an Option Chart. Unlike the GEX Heatmap and Option Big Flows, this indicator is not restricted to SPX alone.
Why are Major and Minor Gamma BrokerLine rather than Line?+
BrokerLine extends the stroke to the right edge of the chart with its price label, like an order line. It is the default for these two levels because they act as session references, meant to stay visible even when price moves away from them.
Which expiration should I pick for day trading?+
The setting starts on All expirations. Tightening to 0 DTE or one week makes the levels more mobile, but brings them closer to the hedging actually at work during the day. Test both over several sessions before deciding.
Tutorial & settingsGamma Bands: the complete setup, tab by tab
+Data source, expirations, then the three Zero Gamma, Major Gamma and Minor Gamma lines configured one by one, with their defaults.
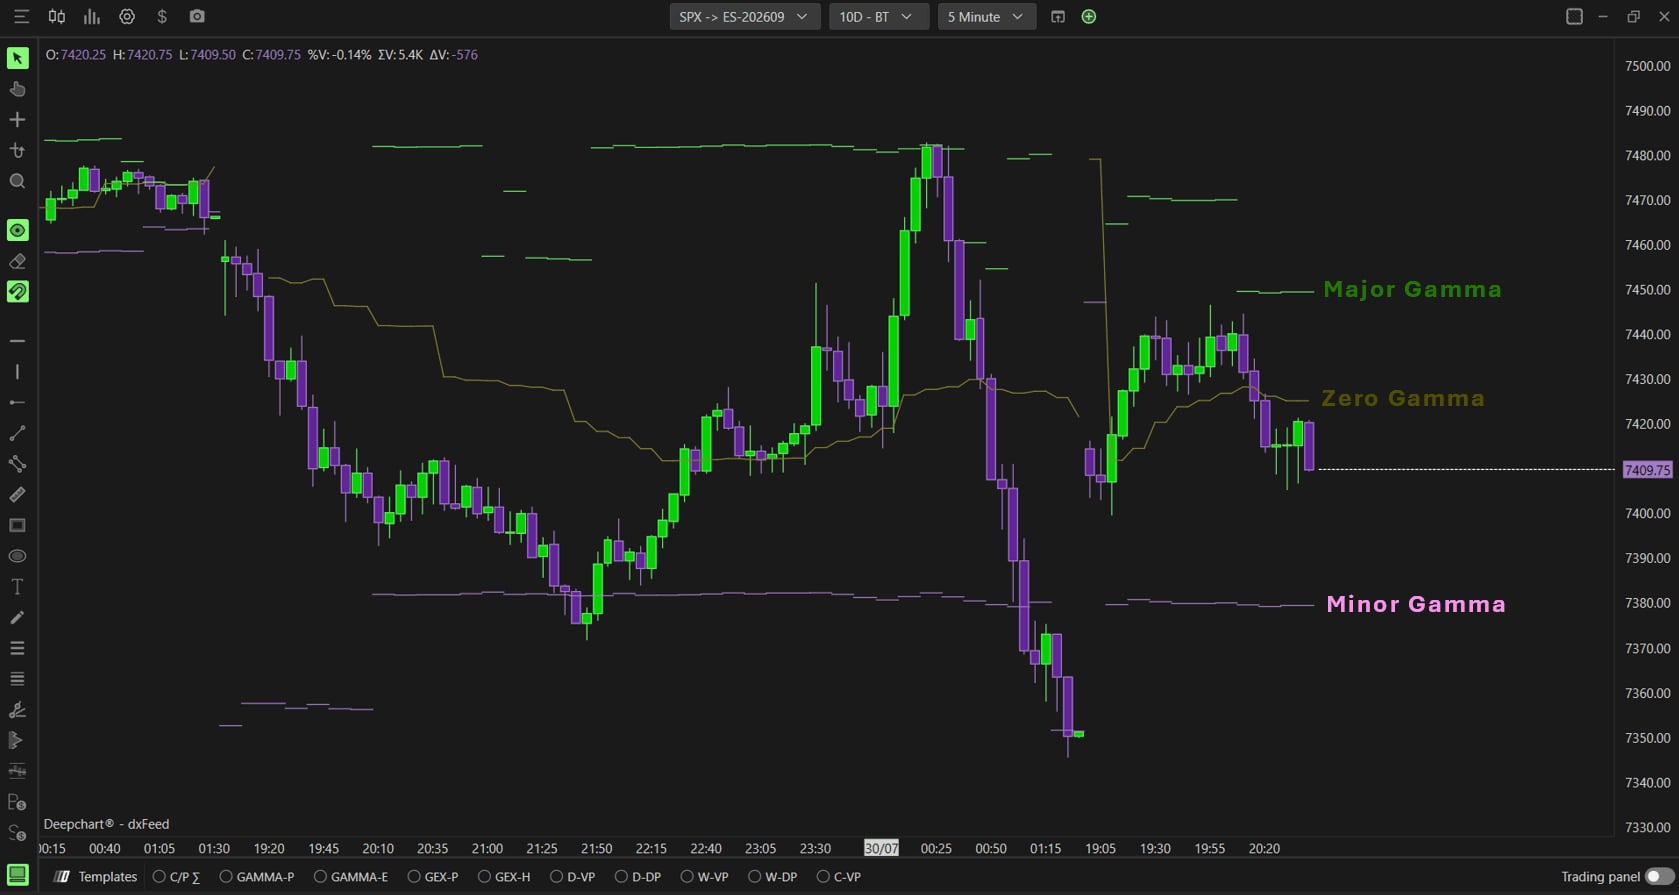
Gamma Bands draw three levels derived from gamma exposure: Zero Gamma, the price where dealer exposure flips from positive to negative, then Major Gamma and Minor Gamma, the two strongest hedging concentrations. Inside the platform the indicator is called Option Envelopes: that is the name to search for in Indicator Add. This tutorial walks through every settings tab, with the values worth knowing and what each one changes on screen.
- An option chart opened through New then Option Chart, on NDX, QQQ, SPY or SPX
- Search for Option Envelopes in Indicator Add: "Gamma Bands" is not the module's name inside the platform
Step by step
- 01
Open an option chart
Go to New in the top menu, then Option Chart. The selection box opens on the four covered symbols: NDX, QQQ, SPX and SPY. Unlike the GEX Heatmap or Option Big Flows, this indicator is not restricted to SPX, but it is still an option indicator: it does not exist on an ordinary futures chart.
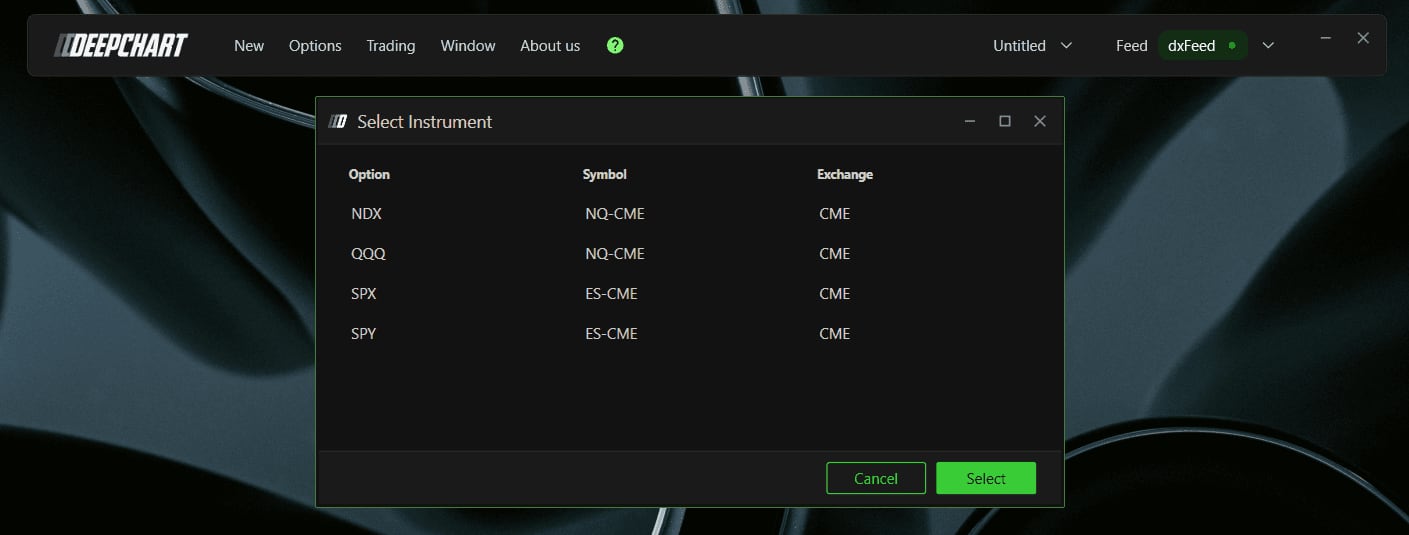
The instrument selection box with NDX, QQQ, SPX and SPY.© DeepCharts - 02
Add Option Envelopes
Once the chart loads, click Indicator Add in the toolbar, search for Option Envelopes, add it with the plus, then open the settings icon. The module's display name on the site is Gamma Bands, but the indicator itself sits under Option Envelopes: searching the other name returns nothing. Its settings window is titled Option Levels/Envelopes, and splits into two tabs, Parameters and Subgraphs.
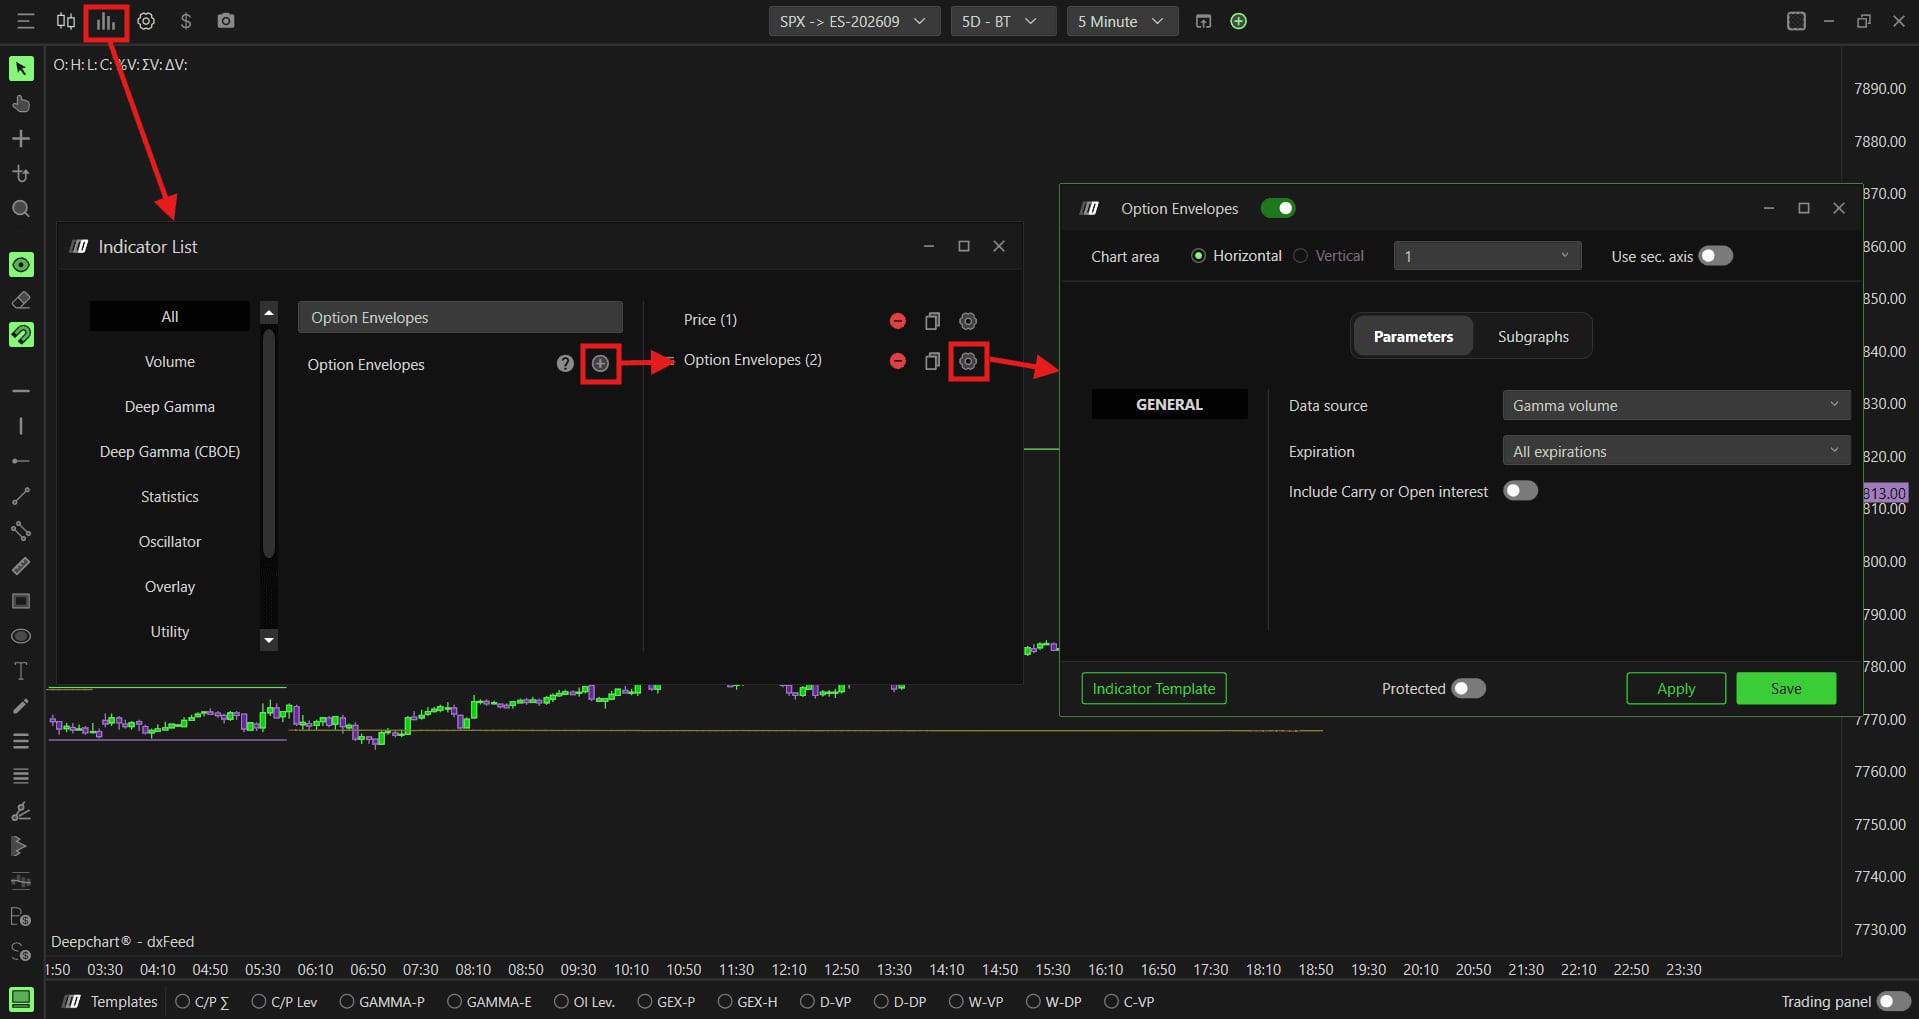
The indicator list with Option Envelopes added, and its settings window open.© DeepCharts - 03
Choose the calculation base and frame the expirations
The Parameters tab holds only three settings, and they are the only ones that change the levels themselves. Data source is Gamma volume by default: levels are computed on volume multiplied by the gamma greek, so weighted by each strike's real sensitivity. Call put computes on raw call and put volume, unweighted, and reads activity rather than exposure; Open interest eod computes on the prior session's end of day open interest, which gives stable levels but a session behind. Expiration is All expirations by default, unlike the GEX Heatmap which starts at 0 DTE, and tightens to 0 DTE, one day, seven days, thirty one days or ninety one days. Include Carry or Open interest, off by default, adds open interest carried from previous sessions. Change the source and every level moves: keep one, and judge it over weeks.
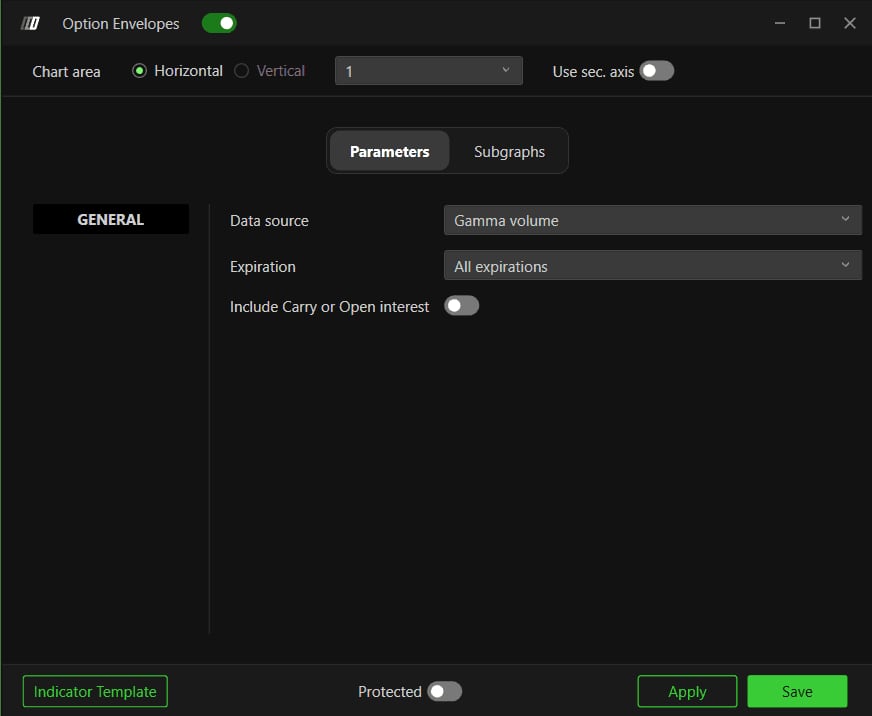
The Parameters tab with Data source, Expiration and Include Carry or Open interest.© DeepCharts - 04
Configure Zero Gamma in the Subgraphs tab
Zero Gamma is the most important of the three lines: the price where dealer gamma exposure flips from positive to negative, so the border between a regime where their hedging absorbs moves and one where it amplifies them. It is drawn in gold yellow, Line style, Solid stroke, width one. Like the other two lines it carries the standard DeepCharts subgraph set: Color and 2° Color, Subgraph Style, Auto Color (None by default, otherwise Slope or +/-), Line Style, Line Width, Short Name to rename the series, and four label switches, Name Label, Value Label, Name Background and Value Background. Include on Auto Center is off: leave it that way, or the chart recentres on the line and you lose your price scale.
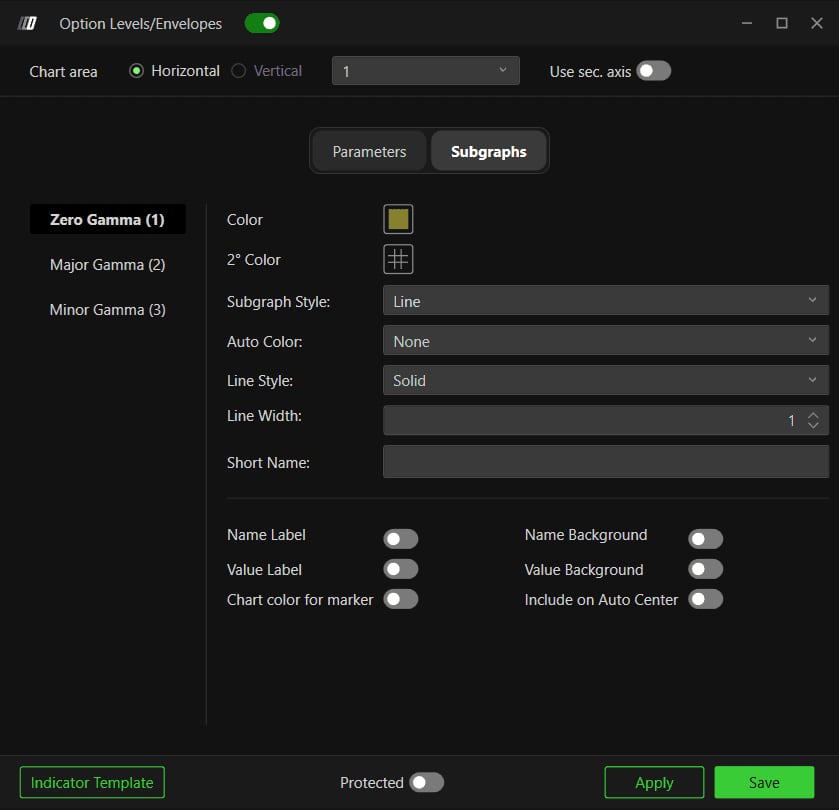
The Zero Gamma (1) section of the Subgraphs tab, in gold with Line style.© DeepCharts - 05
Configure Major Gamma
Major Gamma marks the strongest gamma concentration above price. It is green, and its Subgraph Style is BrokerLine rather than Line: the stroke extends to the right edge of the chart with its price label, like an order line. That is the right style for a session level, one you want visible even when price moves away from it. Every other setting matches Zero Gamma.
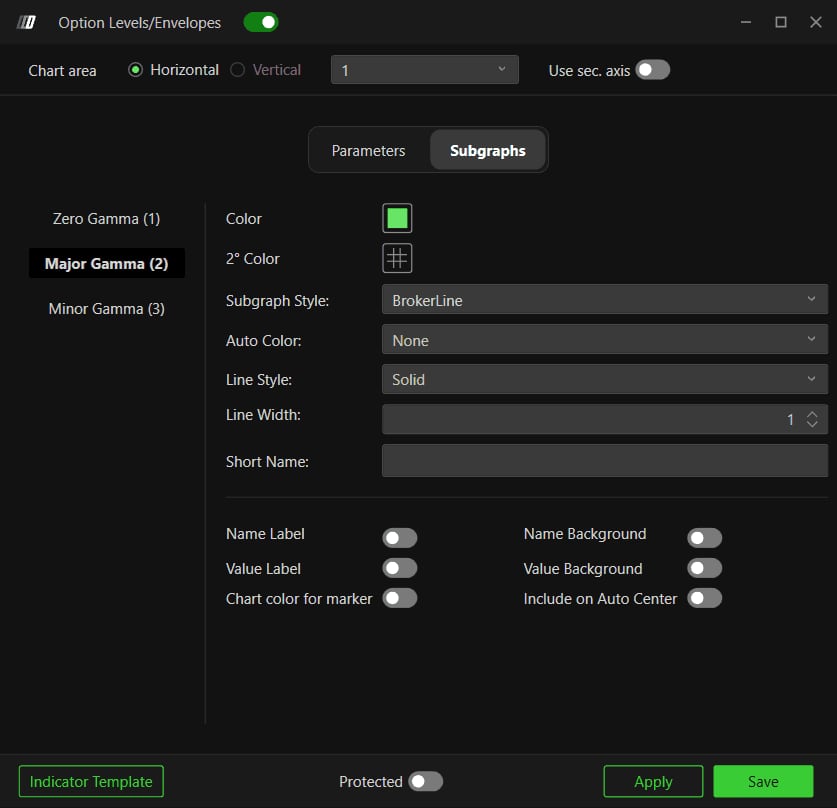
The Major Gamma (2) section, in green, with its Subgraph Style on BrokerLine.© DeepCharts - 06
Configure Minor Gamma
Minor Gamma marks the secondary concentration, in purple, with the same settings and the same BrokerLine style. It is the first line to switch to Hidden if your chart already carries a GEX Profile with its peak lines: three gamma levels plus two peak lines is the point where you stop knowing which one you are looking at. Set it to Dash rather than Solid if you want to keep it while telling it apart from the other two at a glance.
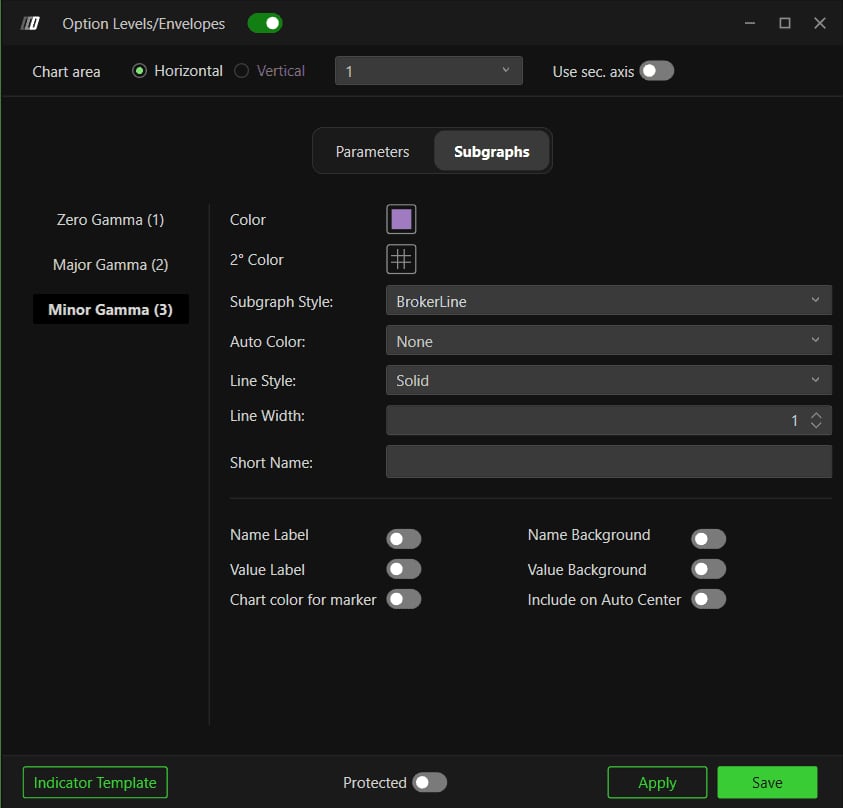
The Minor Gamma (3) section, in purple, with the same settings as Major Gamma.© DeepCharts
Settings, tab by tab
Volume multiplied by the gamma greek: levels weighted by each strike's sensitivity.
An activity read, with no gamma weighting.
Stable levels, but one session behind.
0 DTE, <= 1 d, <= 7 d, <= 31 d, <= 91 d, All expirations.
Adds open interest carried from previous sessions.
The price where dealer gamma exposure flips from positive to negative.
Line or Hidden.
None, Slope or +/-.
Leave it off, or the chart recentres on the line.
The strongest gamma concentration above price.
Line, Hidden or BrokerLine.
The secondary gamma concentration.
⚠ Traps to avoid
- Searching for "Gamma Bands" in Indicator Add. The indicator is called Option Envelopes inside the platform: the module's commercial name will not find it.
- Switching Data source halfway through. Gamma volume, Call put and Open interest eod do not produce the same levels on the same chart: changing it moves your whole reference history and makes any session to session comparison meaningless.
- Treating Zero Gamma as support or resistance. It is not a level price bounces off, it is the border where dealer behaviour inverts: above it their hedging absorbs, below it pushes. What it changes is your strategy, not your entry point.
Want to get better at order flow?
We discuss flow, liquidity and our trades live, every day, on the OrderFlowFutures Discord. Join us, it's free.
Join the Discord for free7 online·76 members·Free · instant access