Updated · first published
What is Expected Move (DeepGamma)?
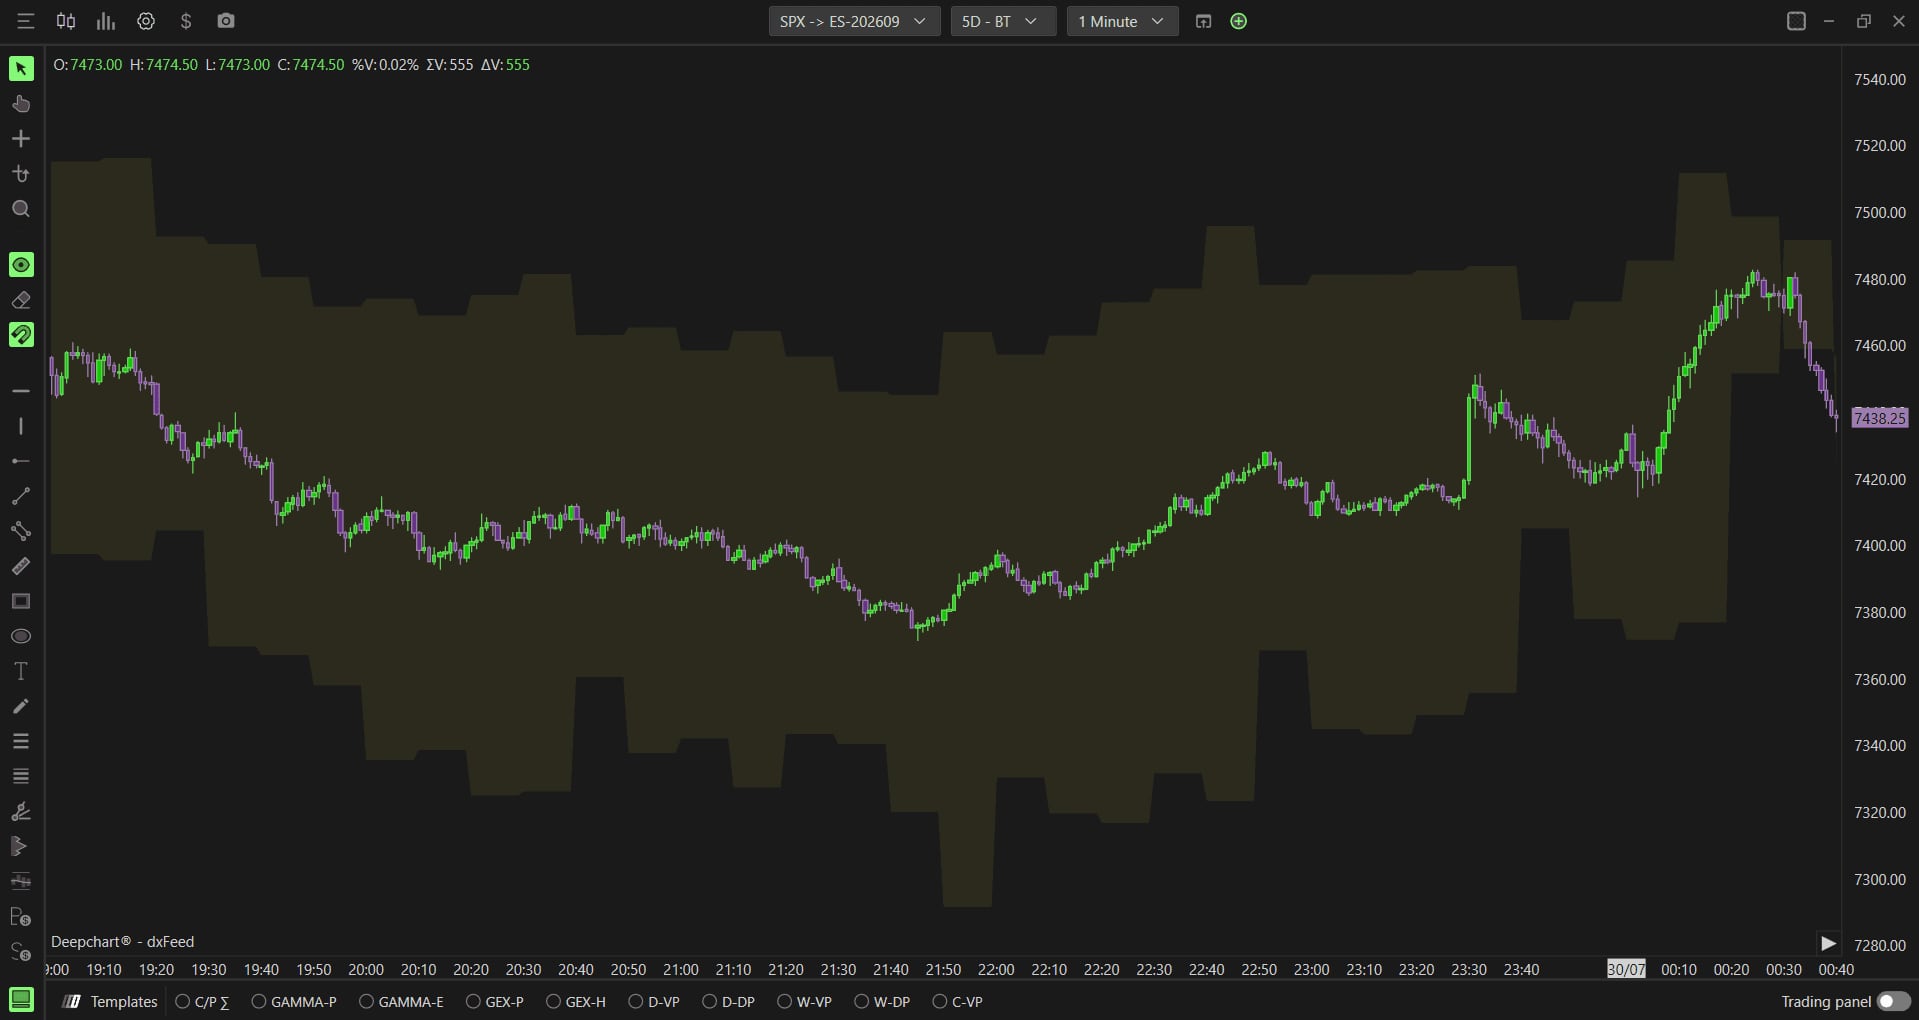
Option prices contain a forecast: the move the market expects out to a given expiration. Expected Move turns it into a band around price. It isn't a direction call, it's an order of magnitude: the distance the market currently considers normal, beyond which a move becomes statistically unusual.
What DeepCharts does better
Rendered natively next to your order flow, Expected Move becomes a management tool rather than a statistic you look up elsewhere. Inside DeepGamma it sits alongside total options volume and net option delta: expected range, the activity underpinning it, and the directional bias of the flow, on one screen and one dataset.
Using it day to day
Use it to calibrate, not to enter. If the day's expected range is narrow, your targets should be too and breakouts deserve suspicion. If it's wide, FOMC day, CPI day, your usual stops are too tight and the morning range probably won't hold.
Example: on a quiet Tuesday, Expected Move gives a narrow band. The market opens, tests the top of it and stalls; aiming twice as far would have turned a good read into a round trip. On CPI Thursday the same band doubles: the trader keeping yesterday's stop gets taken out on first-minute noise.
⚠ The trap to avoid
The trap: taking it as a hard ceiling. An expected-range band is a probability, not a wall: it gets exceeded regularly, and those are precisely the sessions where the biggest moves happen. It's a sizing tool, not a reversal level.
Combine it with
Combine it with Gamma Bands (the session's regime) and the GEX Profile (the levels that structure the range). Together they tell you what size of move to aim for and where it's likely to stop: order flow tells you when to enter.
FAQ
How is Expected Move calculated?+
It derives from the implied volatility of options at the chosen expiration: the options market prices a magnitude, which is converted into a price band around the current level.
Can I trade the Expected Move boundaries?+
They're mainly for sizing targets and stops. Treating them as reversal levels assumes the range won't be exceeded, which happens regularly: especially on data days.
Is it useful for scalping?+
Yes, indirectly: a narrow expected range signals a range session where targets should be short, a wide one signals impulsive moves where holding longer pays.
Which instruments is Expected Move available on?+
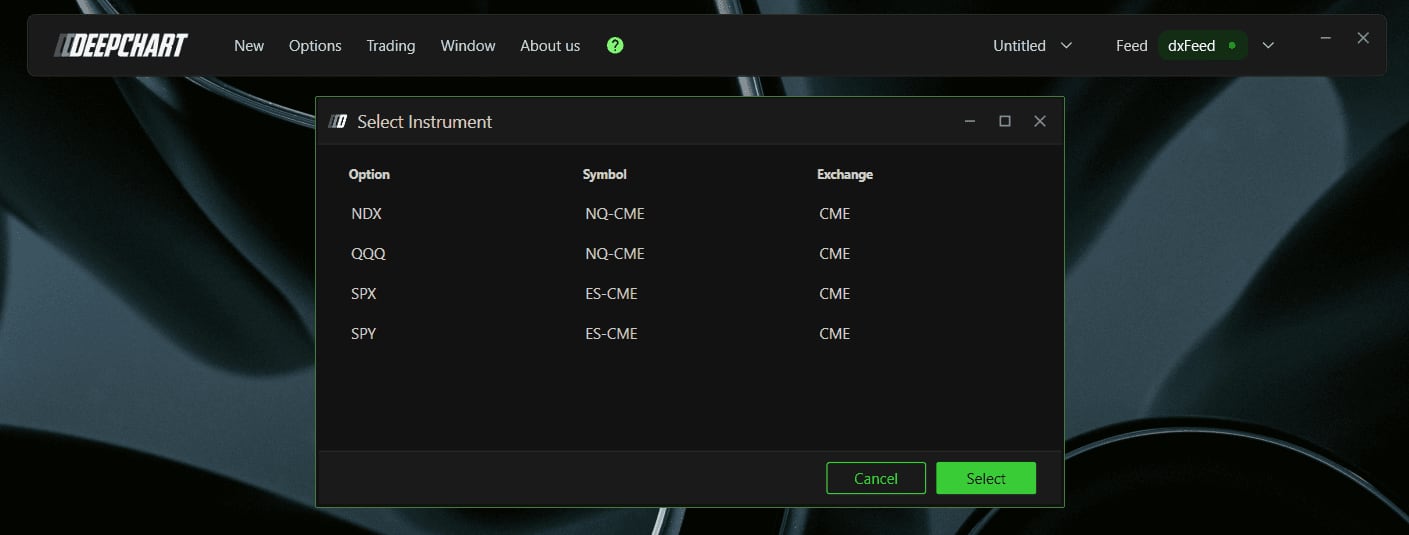
NDX, QQQ, SPY and SPX, through an Option Chart. Unlike the GEX Heatmap and Option Big Flows, it is not restricted to SPX alone.
What is the difference between Daily and Thirty minute?+
Daily computes the band over the whole session: you draw it in the morning and it frames the day. Thirty minute recomputes on a rolling thirty minute window, giving far more mobile intraday targets, suited to scalping but useless as a session frame.
Why are my boundaries not showing?+
Because Range + and Range - have their Subgraph Style set to Hidden by default. Switch them to Line for a normal stroke, or to BrokerLine for a stroke extended to the right edge with its price label.
Tutorial & settingsExpected Move: the complete setup, tab by tab
+Calculation horizon, standard deviation used, band style and boundary labels: every setting with its default value and what it changes on screen.
Expected Move draws on the chart the price band that option implied volatility assigns to the session. Only two settings decide what you read, Interval and Value; everything else is presentation. The indicator is available on NDX, QQQ, SPY and SPX, through an option chart. This tutorial walks through every settings tab, with the values worth knowing and what each one changes on screen.
- An option chart opened through New then Option Chart, on NDX, QQQ, SPY or SPX
- An active DeepGamma subscription: the band is computed from option implied volatility
Step by step
- 01
Open an option chart
Go to New in the top menu, then Option Chart, and pick one of the four covered symbols: NDX, QQQ, SPX or SPY. Unlike the GEX Heatmap and Option Big Flows, Expected Move is not restricted to SPX: it is computed from option implied volatility, not from Cboe participant data.
The instrument selection box with NDX, QQQ, SPX and SPY.© DeepCharts - 02
Add the indicator
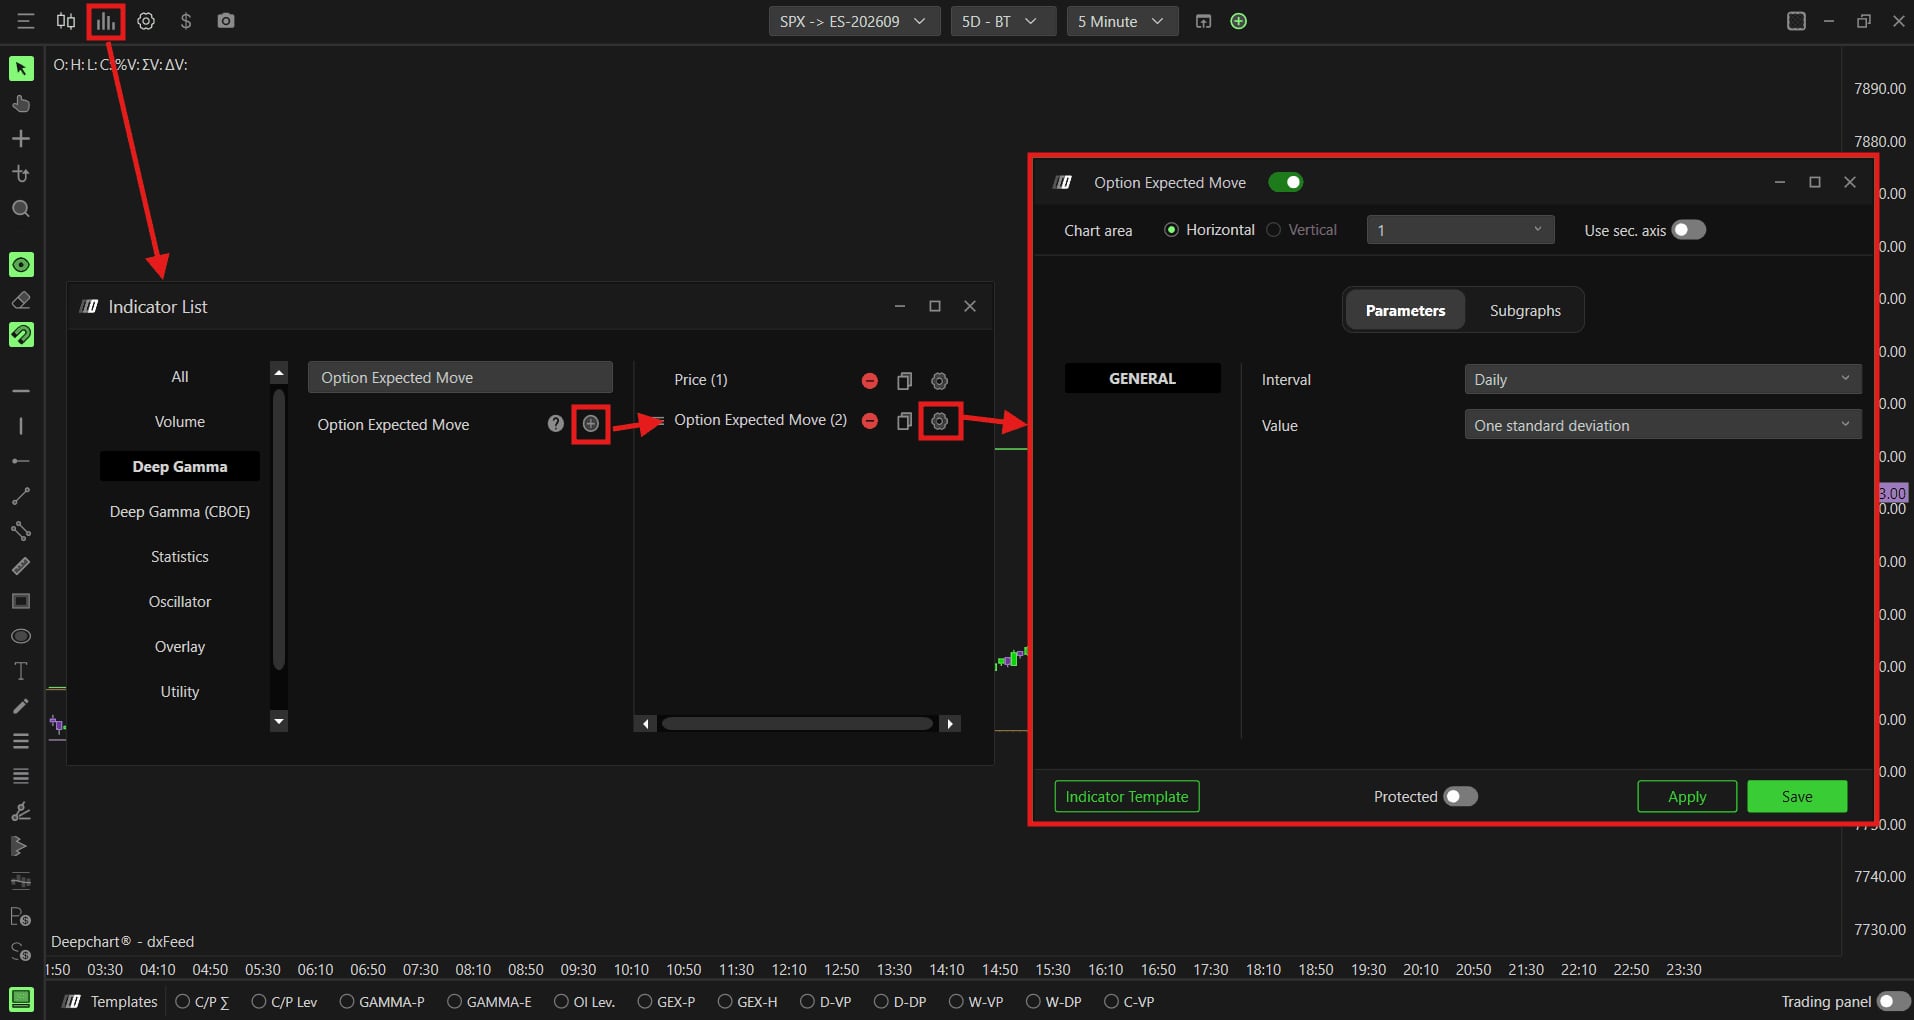
Once the chart loads, click Indicator Add in the toolbar, search for Option Expected Move, add it with the plus, then open the settings icon. The band appears immediately around price. It has three components, which the settings window treats as three separate series: Range, the full band, Range + its upper boundary and Range - its lower one.
The indicator list with Option Expected Move added, and the band drawn on price.© DeepCharts - 03
Choose the horizon and the standard deviation
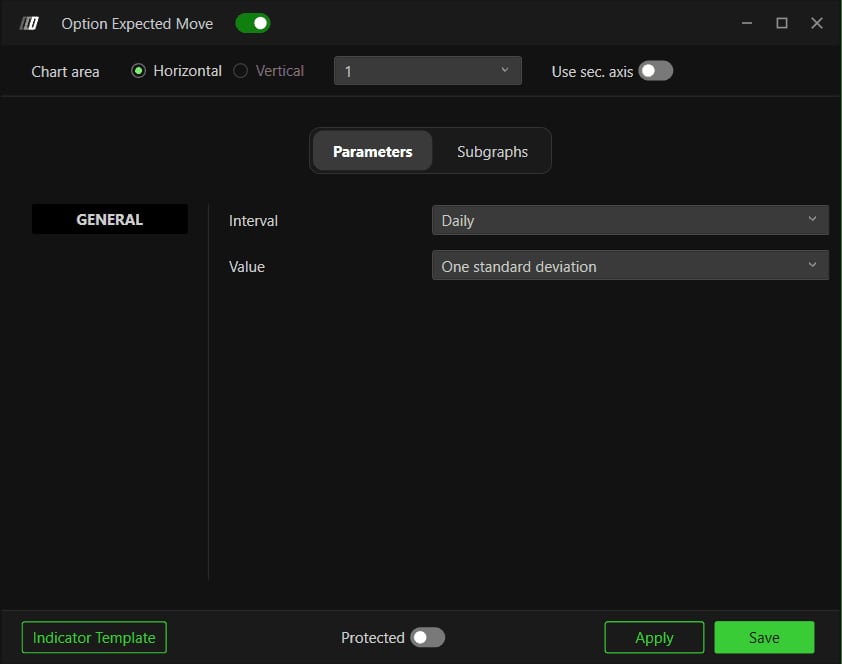
The Parameters tab holds only two settings, and they are the only ones that change the band itself. Interval is Daily by default: the band covers the whole session, and that is the setting to keep for framing day targets; Thirty minute recomputes on a rolling thirty minute window, which produces far more mobile intraday targets. Value is One standard deviation, roughly a seventy percent probability that the session closes inside the band: the right starting point. Two standard deviation widens it to roughly ninety five percent, useful for placing stops rather than targets, and Average uses plain mean implied volatility, with no statistical construction.
The Parameters tab with the Interval and Value lists.© DeepCharts - 04
Style the main band, Range (1)
The Range series is the shaded band itself. Line sets its border colour, Background its fill, with 2° Line and 2° Background as secondary colours. Subgraph Style is Range and can switch to Hidden if you want the boundaries without the shading. Auto Color is None by default, with Slope and +/- as alternatives, Line Style toggles between Solid and Dash, Line Width is one. Short Name renames the series, and four switches govern the labels. Leave Include on Auto Center off, here and on both boundaries: turned on, it brings the band into the chart's auto centring calculation, and on a session with high implied volatility your candles end up squashed in the middle of the screen.
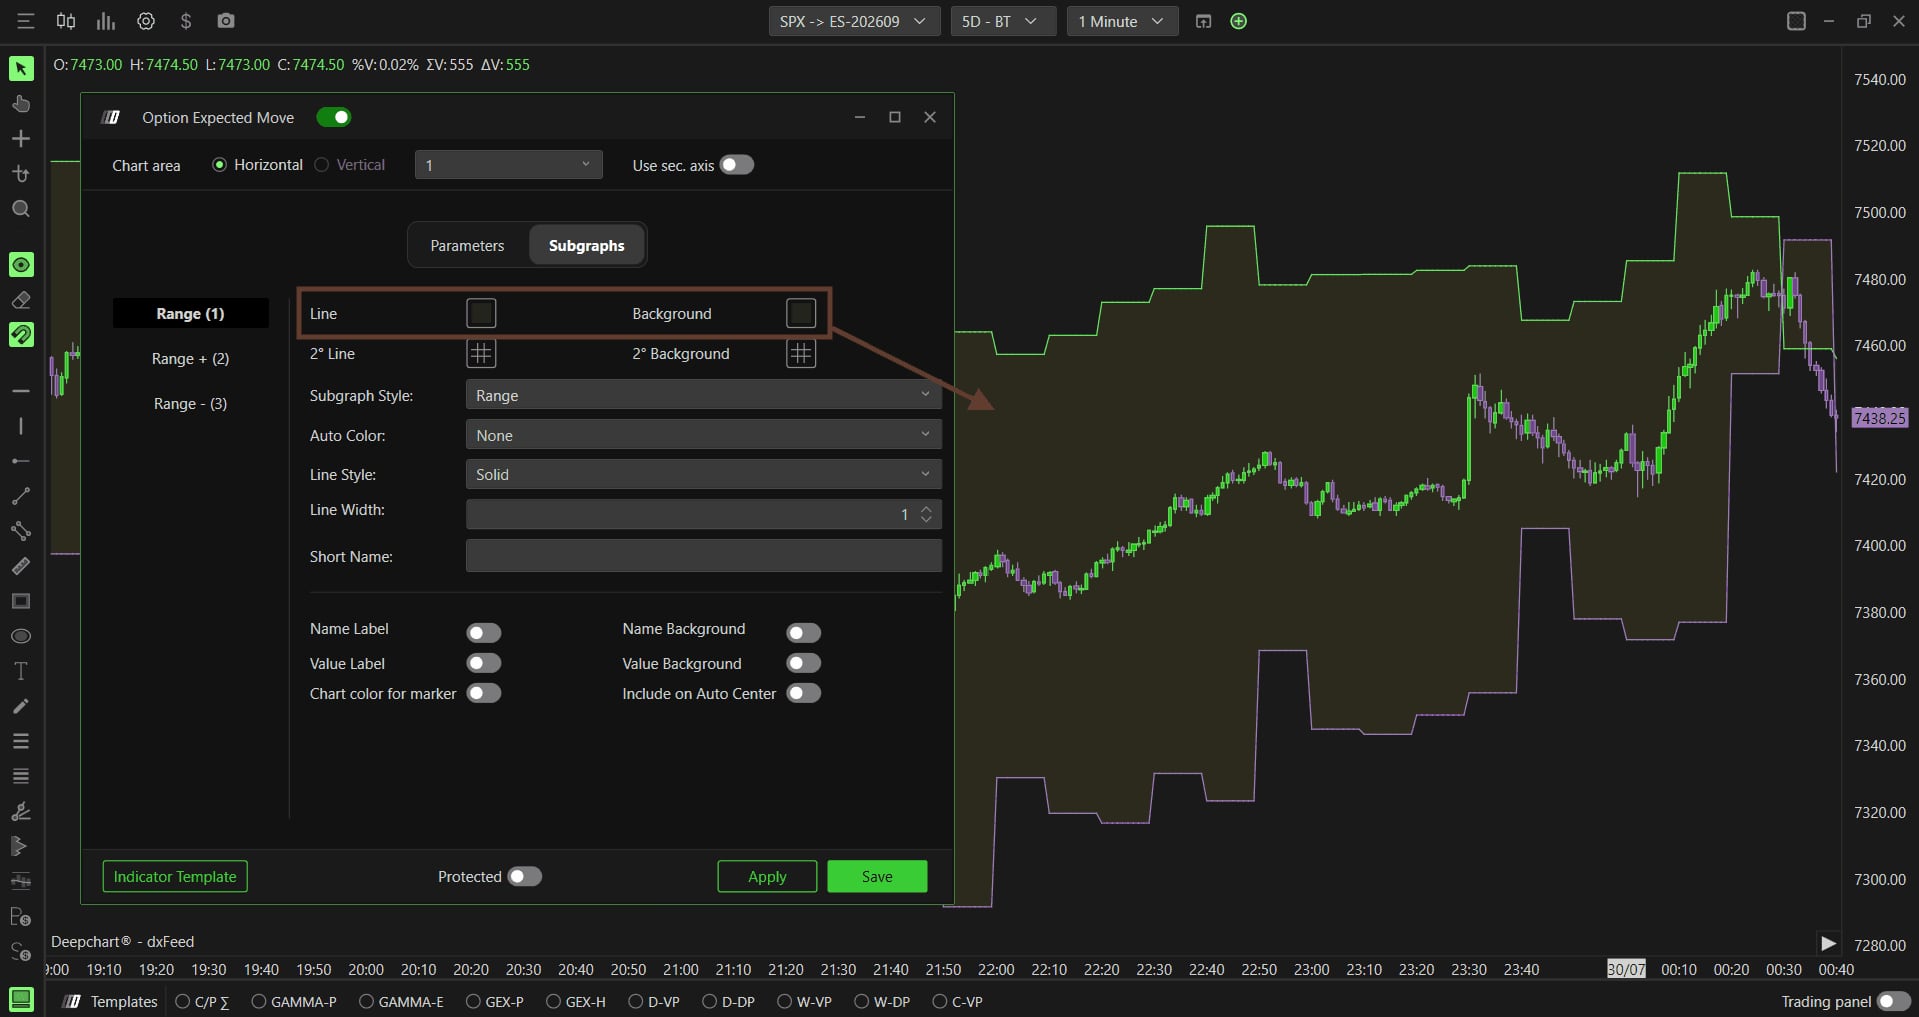
The Range (1) series in the Subgraphs tab, with Line and Background highlighted.© DeepCharts - 05
Show the upper boundary, Range + (2)
The upper boundary exists as a standalone series, but its Subgraph Style is Hidden by default: you see the band, not its line. Switch it to Line for a normal stroke, or to BrokerLine for a stroke extended to the right edge with its price label. It is green, and its Short Name is 0DTE R+. The rest matches Range: Auto Color, Line Style, Line Width and the four label switches.
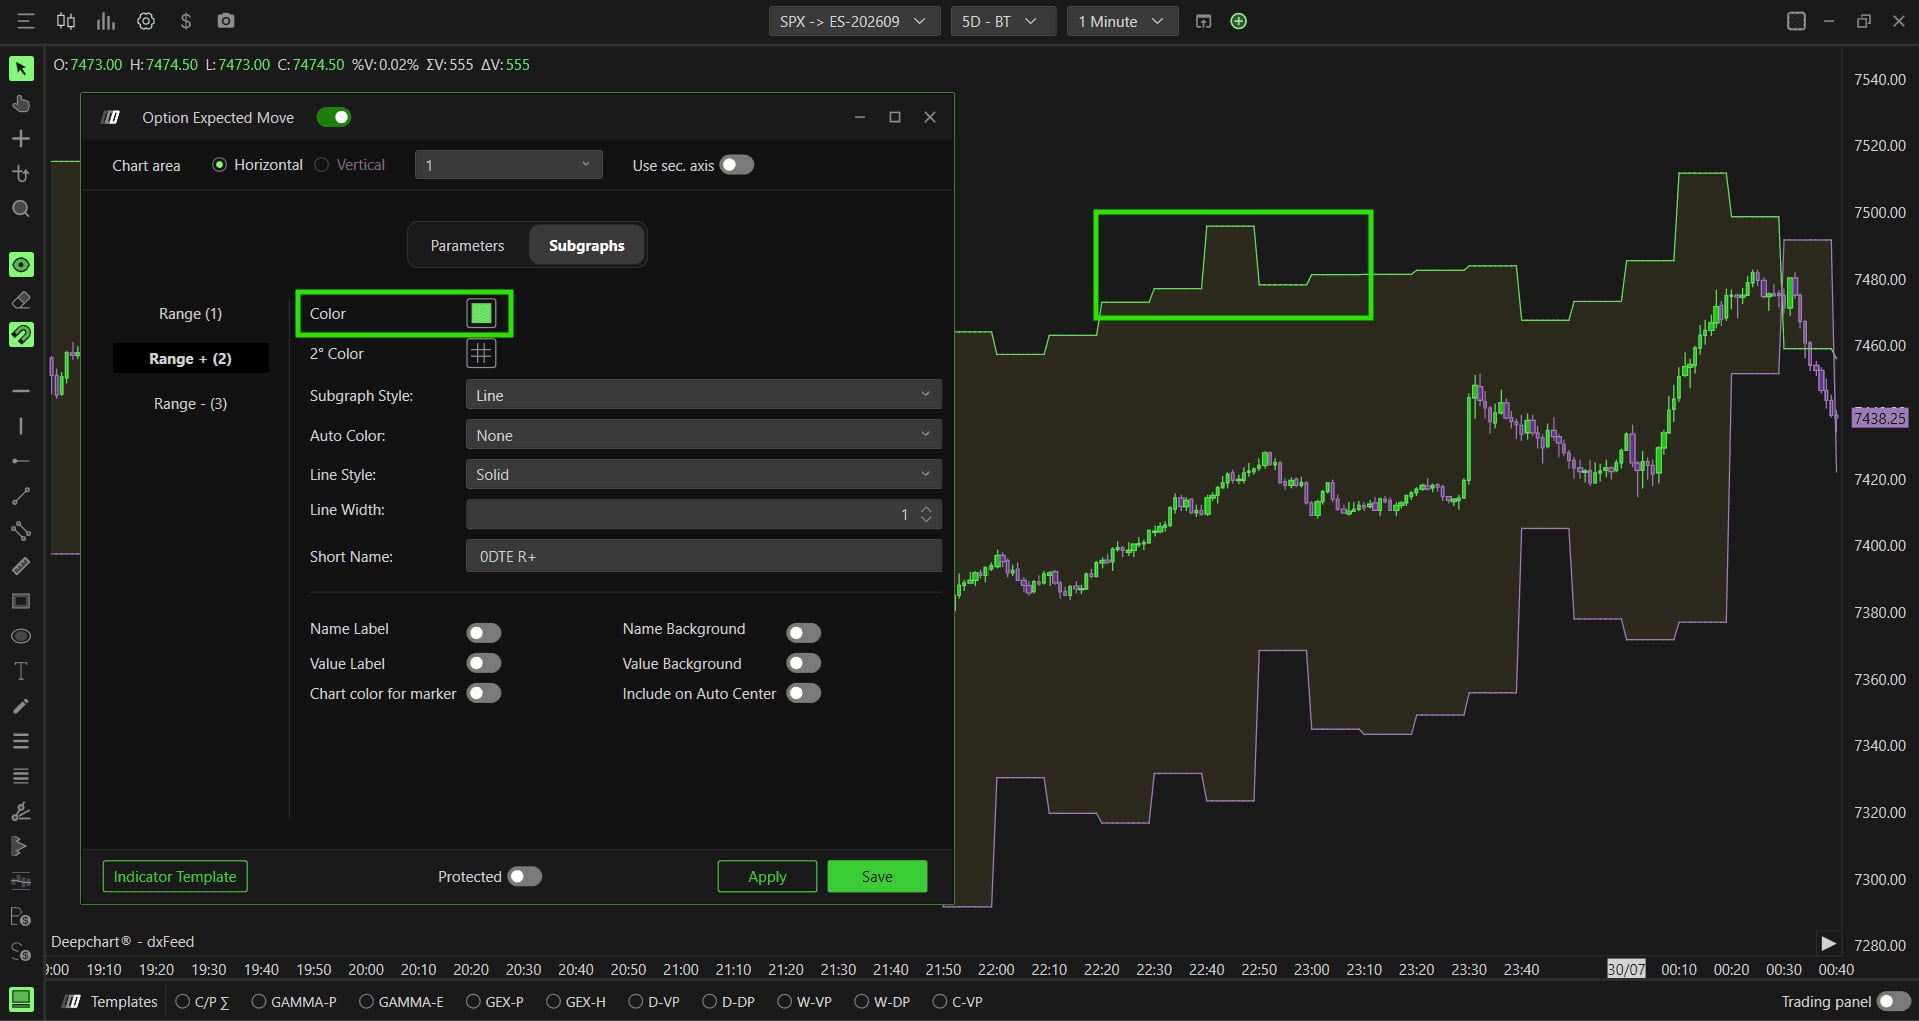
The Range + (2) series, in green, with its 0DTE R+ short name and the boundary drawn on the chart.© DeepCharts - 06
Show the lower boundary, Range - (3)
Same on the downside: Subgraph Style is Hidden by default, switch it to Line or BrokerLine to make it appear. It is purple, and its Short Name is 0DTE R-. With both boundaries shown, the band becomes a readable pair of targets, with no need to guess where the edge of the shading sits.
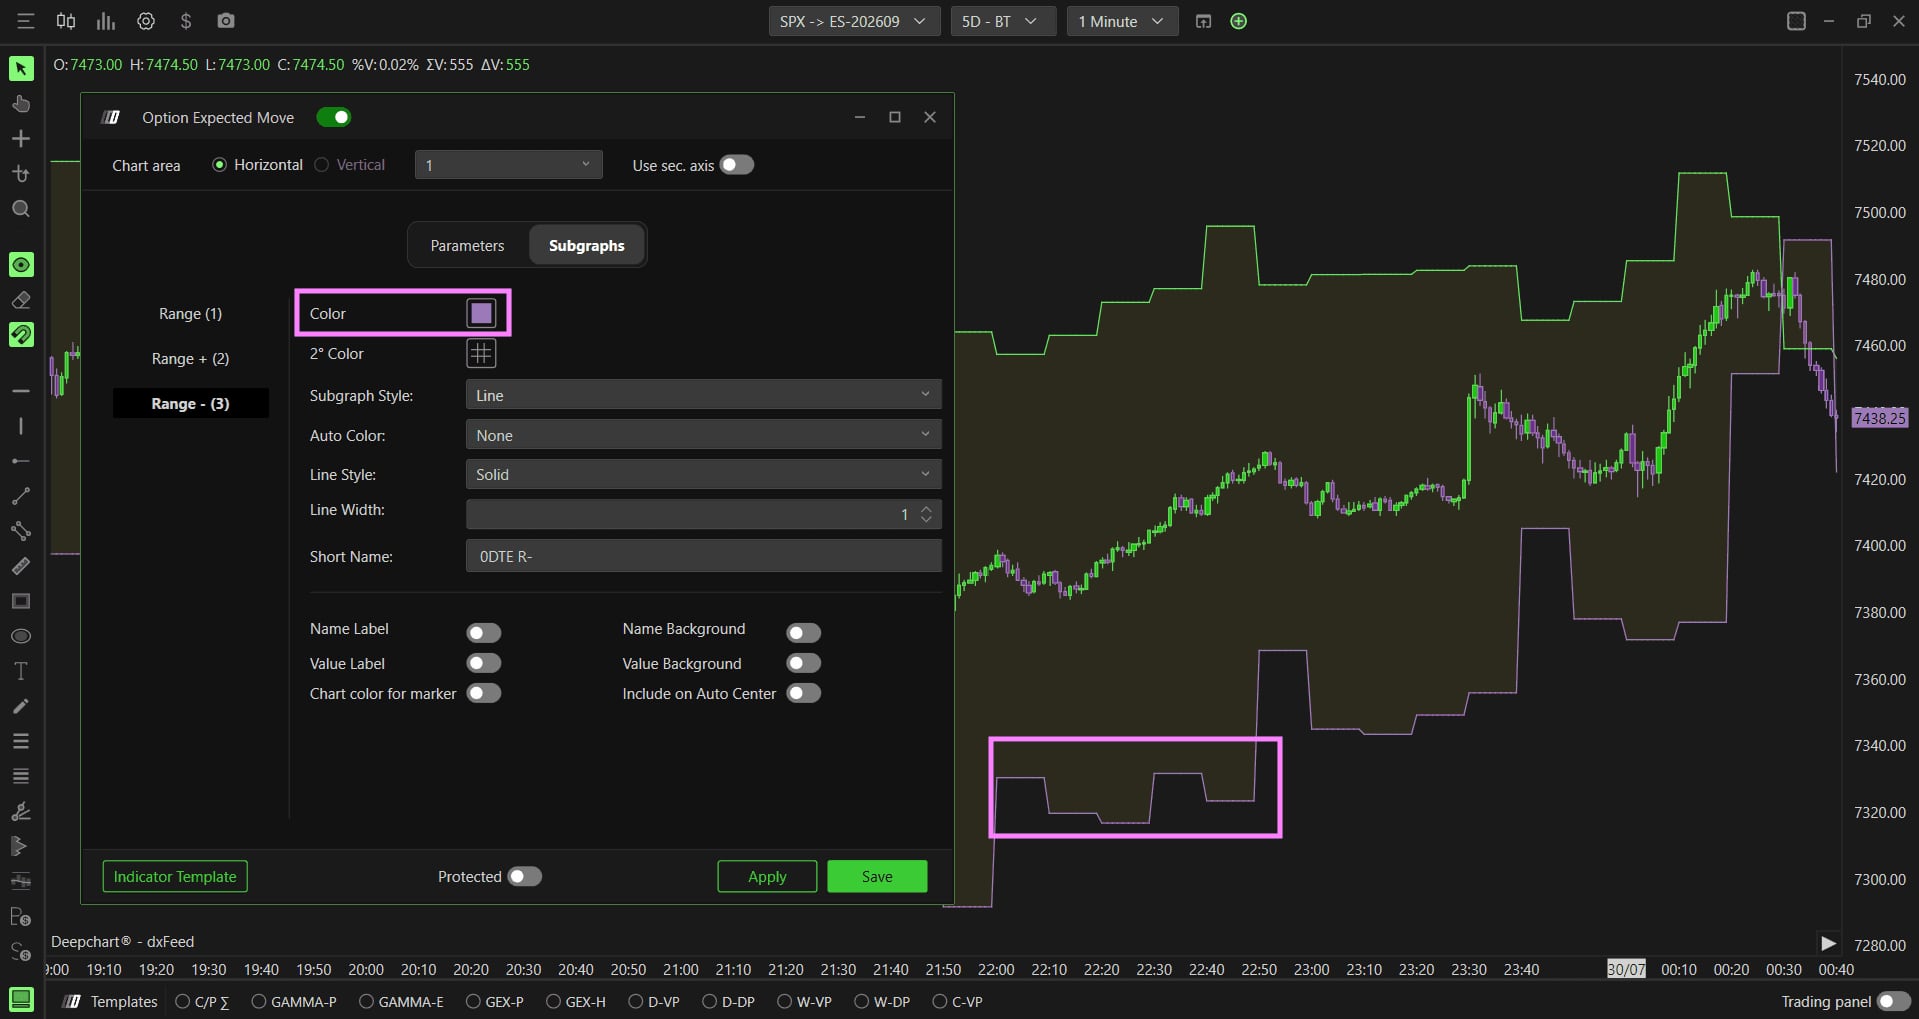
The Range - (3) series, in purple, with its 0DTE R- short name and the lower boundary drawn.© DeepCharts
Settings, tab by tab
The only two settings that change the data rather than its presentation.
Daily for the whole session, Thirty minute for a rolling 30 minute window.
Roughly a 70% probability of closing inside the band.
Extreme moves, better suited to stops than targets.
Narrower band, no statistical construction.
The full shaded band.
Range or Hidden.
None, Slope or +/-.
Leave it off, or the price scale stretches to fit the band.
The upper boundary of the band.
Line, Hidden or BrokerLine. Switch to Line to see the boundary.
The lower boundary of the band.
Line, Hidden or BrokerLine.
⚠ Traps to avoid
- Hunting for the boundary lines and concluding the indicator is broken. Range + and Range - are Hidden by default: the band renders, its lines do not. Switch their Subgraph Style to Line or BrokerLine.
- Taking the band for a forecast. It translates what implied volatility prices, a consensus of options at one moment, not a trajectory. A close outside the band invalidates nothing: it simply says the session moved more than the market had paid for.
- Switching to Two standard deviation because price keeps leaving the band. Widening does not make the read more accurate, it makes it more permissive. The better habit is to keep one standard deviation for targets and reserve two for stops.
Want to get better at order flow?
We discuss flow, liquidity and our trades live, every day, on the OrderFlowFutures Discord. Join us, it's free.
Join the Discord for free7 online·76 members·Free · instant access