Mis à jour le · publié le
Comment lire une heatmap de liquidité ?
On lit trois choses : les zones denses, où la liquidité s'accumule et freine le prix ; les murs qui se rechargent, signe d'absorption réelle ; et ceux qui disparaissent à l'approche du prix, signe de spoofing. La couleur donne la taille, l'axe horizontal donne le temps.
DeepDom, c'est quoi ?
DeepDom est le module carnet d'ordres et heatmap de DeepCharts. Il affiche la liquidité en attente ordre par ordre (MBO), rafraîchie toutes les 0,01 seconde, avec détection des icebergs et des chasses aux stops. C'est l'outil qu'on utilise pour lire les murs de liquidité avant qu'ils bougent.
Une heatmap transforme le carnet d'ordres en image : chaque ordre en attente, coloré selon sa taille, empilé dans le temps. Tu vois littéralement la liquidité, les murs que laissent les gros acteurs, bien avant que le prix n'y réagisse. C'est la façon la plus intuitive de lire l'order flow, et la moins indulgente avec les lectures paresseuses : tout le monde voit le mur, peu savent s'il va tenir.
Ce guide va de la mécanique au trade : ce que l'image dessine vraiment, comment distinguer un vrai mur d'un leurre, les cinq comportements qui reviennent, un entonnoir de décision et trois setups de référence, illustrés par des captures officielles DeepDom. Pour t'exercer en lisant, ouvre la démo interactive gratuite dans un autre onglet.
Ce que la heatmap dessine
Tout part du carnet d'ordres (DOM) : la liste de tous les ordres limit en attente, classés par prix. Les acheteurs attendent en dessous (le bid), les vendeurs au-dessus (l'ask). Ce carnet est complet mais illisible : il change cent fois par seconde et ne dit rien de l'histoire d'un niveau. La heatmap résout exactement ce problème. Elle enregistre le carnet en continu et le peint : le prix sur l'axe vertical, le temps sur l'axe horizontal, et à chaque niveau une bande dont la couleur encode la taille en attente. Un coup d'œil remplace une heure passée à fixer une échelle de prix.
Une condition rend toute la lecture possible : la qualité de la donnée. En Level 2 agrégé, tu vois un total par niveau, 300 lots, sans savoir qui les compose. En donnée MBO, le carnet diffusé ordre par ordre, tu vois chaque ordre apparaître, se déplacer, s'annuler ou se recharger. Les icebergs et les retraits n'existent tout simplement pas dans la donnée agrégée, et c'est précisément ce que ce guide t'apprend à lire. Les niveaux de donnée sont détaillés dans le guide order flow.
Lire l'image : axes, couleurs, échelle
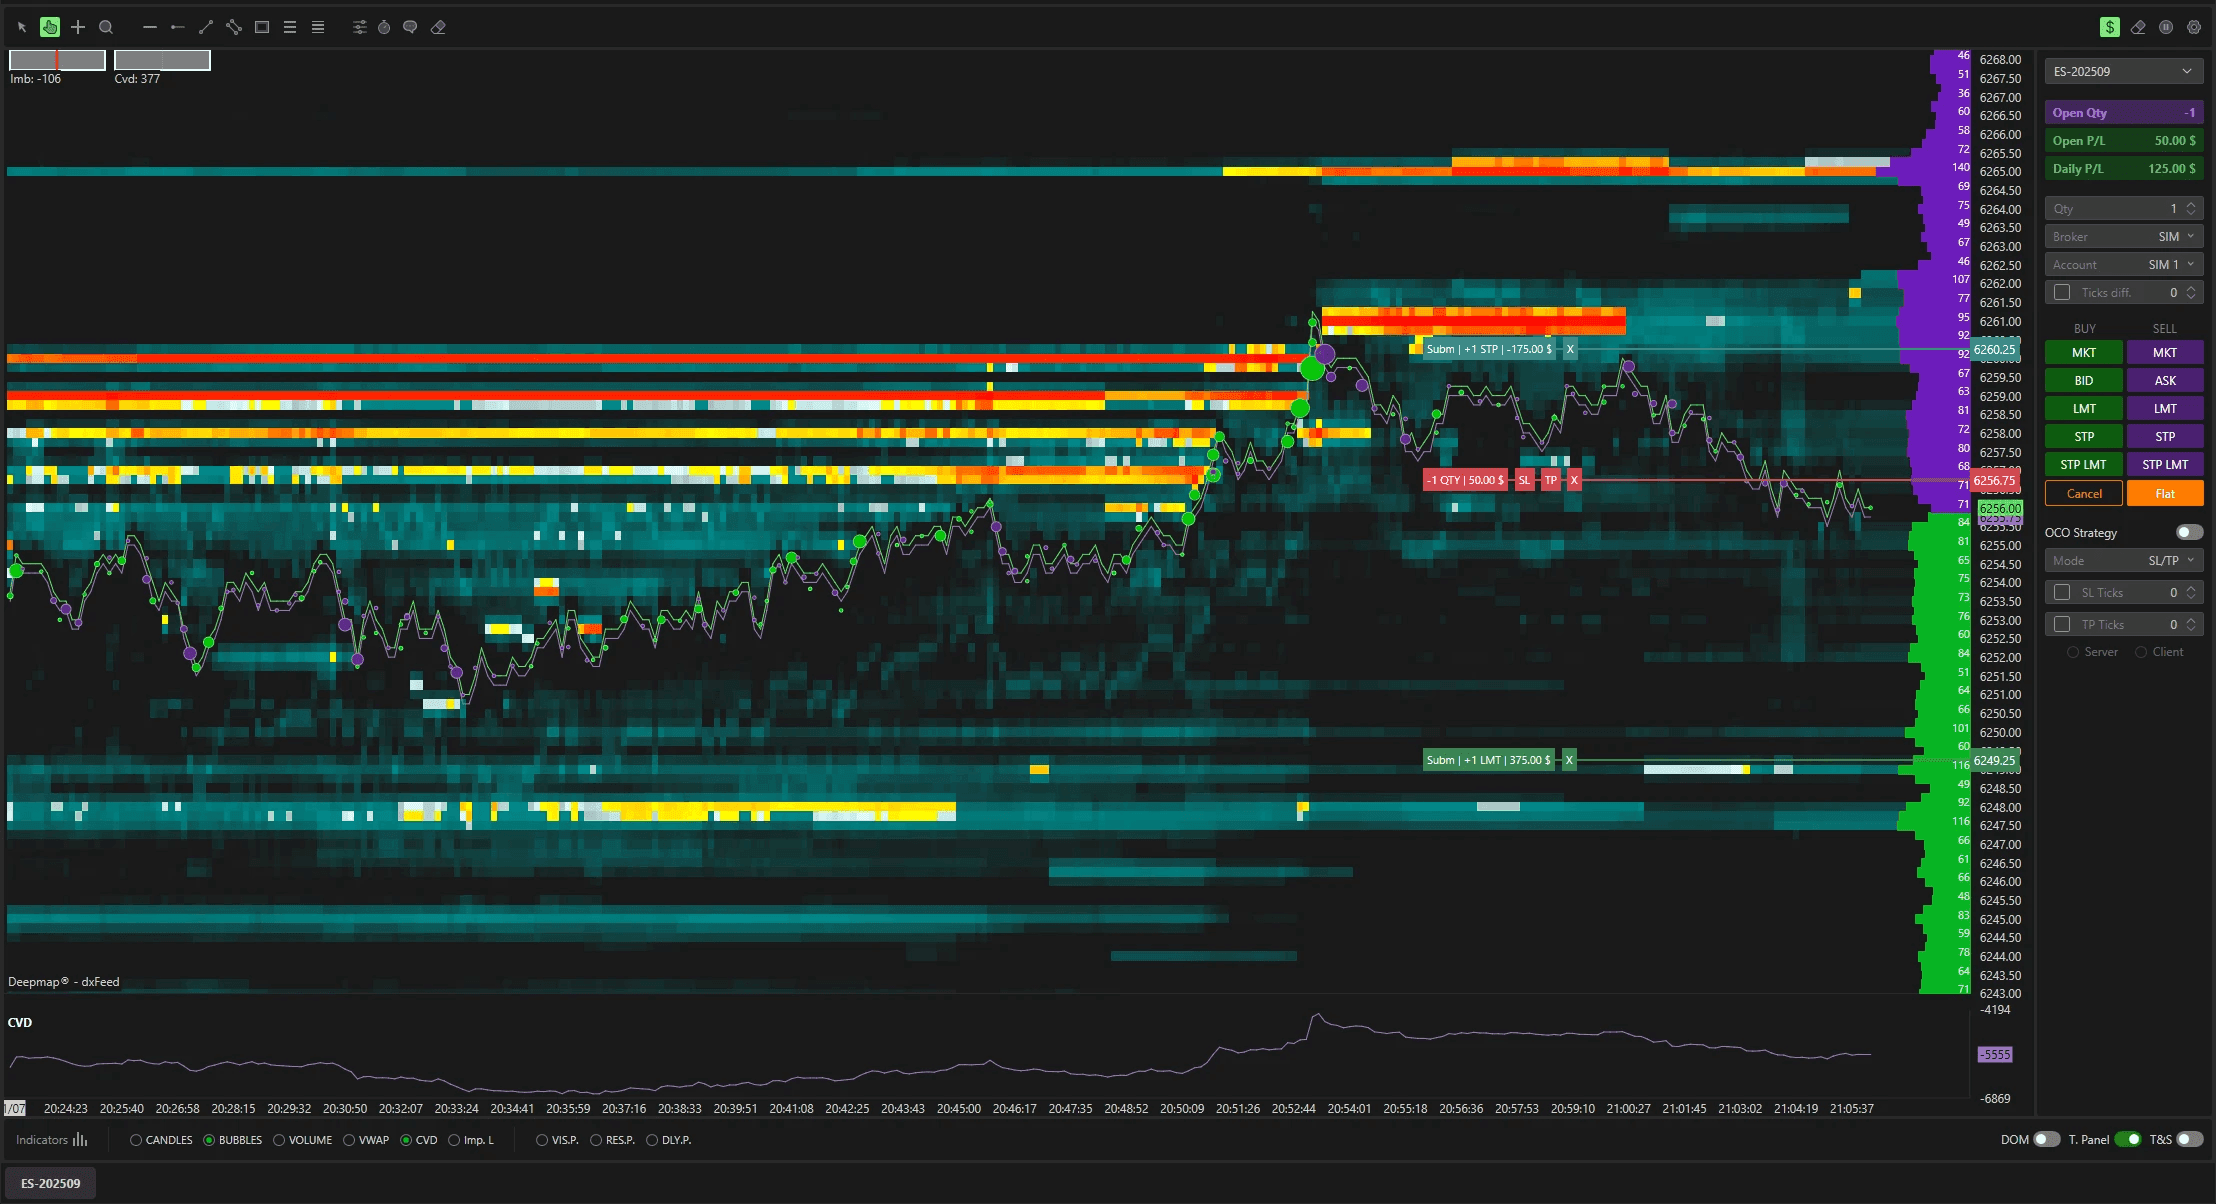
Dans la palette par défaut de DeepDom, l'échelle va du sombre au vif : bleu profond pour la liquidité ordinaire, blanc puis jaune quand la taille grossit, orange et rouge pour les concentrations inhabituelles. L'échelle se recalibre automatiquement sur le plus gros ordre affiché : ton œil est toujours attiré par ce qui compte le plus maintenant. Sur le bord droit, le carnet vivant montre l'état présent : les tailles au bid d'un côté, à l'ask de l'autre, si bien que l'historique peint et l'instant se lisent ensemble.
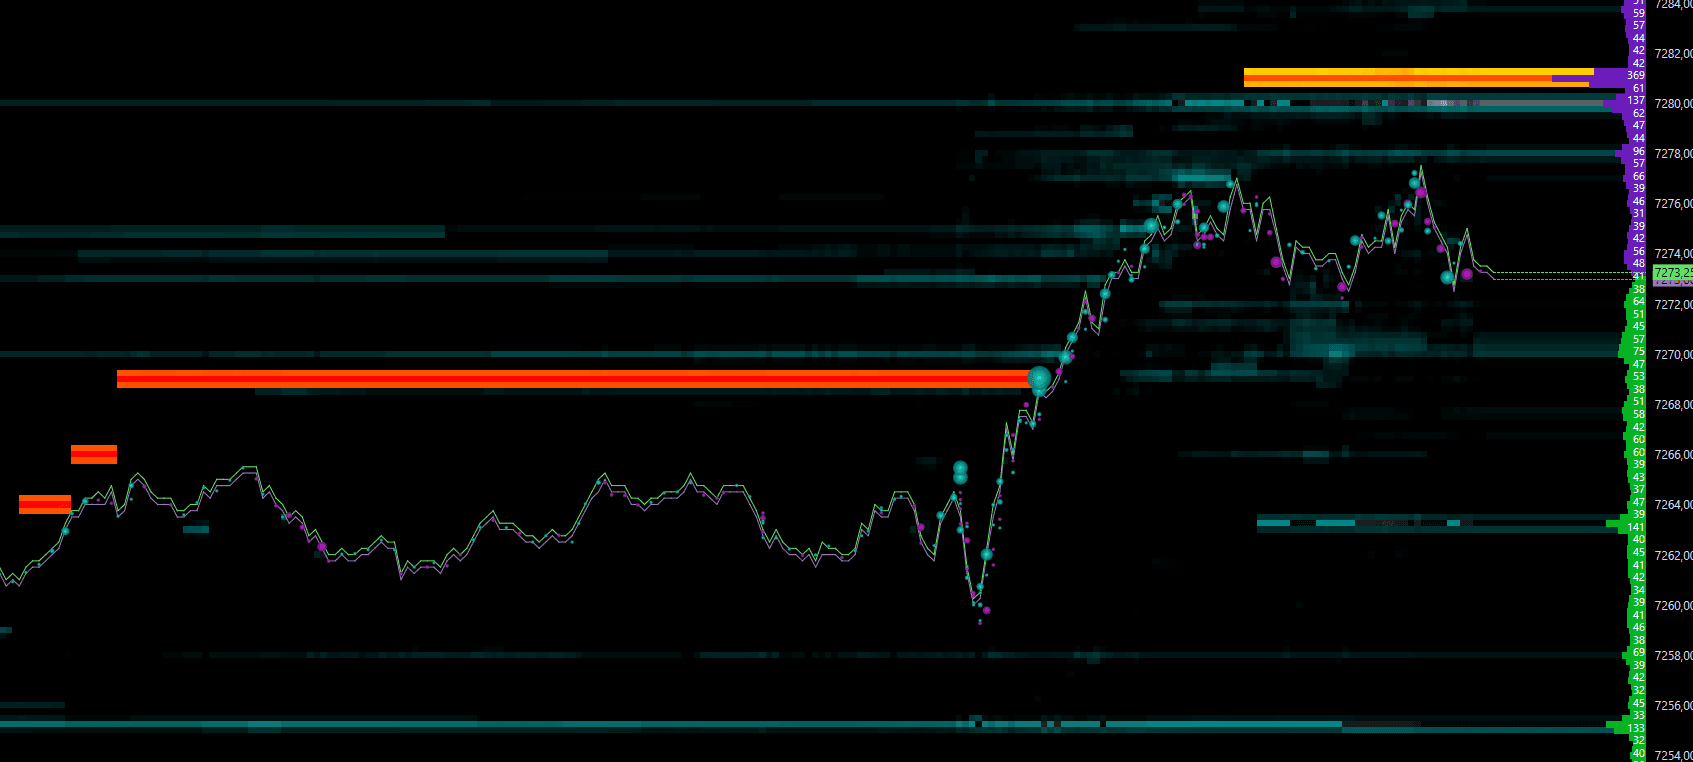
Trois zones structurent chaque lecture. Les bandes denses freinent le prix : le marché doit les consommer pour passer. Les zones vides, les sombres, sont des couloirs : rien à manger, donc le prix les traverse vite, exactement ce que montre la capture ci-dessus une fois le mur rouge cédé. Et les murs, les bandes épaisses et vives, sont les points de décision : tout ce que couvre la suite de ce guide s'y joue.
Les murs : taille, âge, comportement
Un mur est une concentration d'ordres en attente assez grosse pour freiner le prix. Trois attributs décident de sa valeur. Sa taille : plus la bande est épaisse et vive, plus c'est lourd. Son âge : un niveau qui tient depuis une heure engage son propriétaire bien plus qu'un niveau posé il y a une minute. Et surtout son comportement au contact, parce qu'afficher de la taille ne coûte rien et que seule l'exécution est réelle. Un mur qui encaisse l'agression et tient, c'est de l'absorption. Un mur qui s'évapore à l'approche du prix n'était qu'un appât.
C'est pourquoi la lecture se fait dans le temps, jamais en photo. Une capture montre un mur ; seule la carte en direct montre s'il se recharge après chaque coup, s'il recule tick après tick, ou s'il s'amincit sous une consommation réelle. Les trois histoires finissent différemment, et une seule mérite ton stop derrière elle.
Liquidité fraîche ou persistante
C'est la distinction qui sépare un débutant d'un lecteur d'order flow. La liquidité fraîche vient d'apparaître. Elle signale une intention nouvelle, mais elle peut se retirer à tout moment, et une apparition soudaine pile à l'approche du prix est souvent réactive ou défensive : méfiance. Un ordre persistant est posé depuis longtemps, jamais annulé malgré les mouvements autour de lui : quelqu'un croit vraiment à ce niveau et le défend. La réaction y est bien plus probable et bien plus durable.
Marque le niveau et surveille-le : plus c'est ancien, plus le joueur est engagé.
Prudence : il peut être retiré avant même le contact. Observe son comportement d'abord.
Des patients et des nouveaux au même prix : le combo premium, réaction attendue forte.
Les 5 comportements à reconnaître
Les gros acteurs ne peuvent pas acheter des milliers de contrats d'un coup sans faire bouger le marché contre eux. Alors ils cachent, absorbent, et parfois trompent. Tout ce que tu liras un jour sur une heatmap se ramène à cinq comportements. Pour chacun : ce que tu vois, et le bon réflexe.
Ce que tu vois : Un mur encaisse une vague d'ordres agressifs sans céder : le volume explose, la bande reste, le prix n'avance plus.
Le bon réflexe : Celui qui absorbe est en position de force. Attends l'épuisement des agresseurs, puis joue le retour dans le sens du mur, stop derrière lui.
Ce que tu vois : Le carnet affiche 20 lots, des centaines s'exécutent au même prix et le niveau tient : la tranche visible se recharge après chaque exécution.
Le bon réflexe : Un iceberg défend un prix avec de l'argent réel. Tant qu'il se recharge, ne trade jamais contre lui : mets-toi de son côté du marché.
Ce que tu vois : Une bande énorme apparaît, impressionne tout le monde, puis s'annule juste avant le contact : elle n'a jamais eu l'intention d'être exécutée.
Le bon réflexe : Un retrait à l'approche du prix invalide le niveau : ne le traite plus comme un support ou une résistance. Répété, c'est du spoofing, l'inverse d'une absorption.
Ce que tu vois : Une poussée rapide traverse une zone vide de la heatmap, au-delà d'un plus-bas ou d'un plus-haut évident, déclenche les stops puis réintègre aussitôt.
Le bon réflexe : Le balayage fournit la liquidité du gros acteur qui entre à contre-sens. N'anticipe pas le sweep : attends la réintégration, elle précède souvent le vrai mouvement.
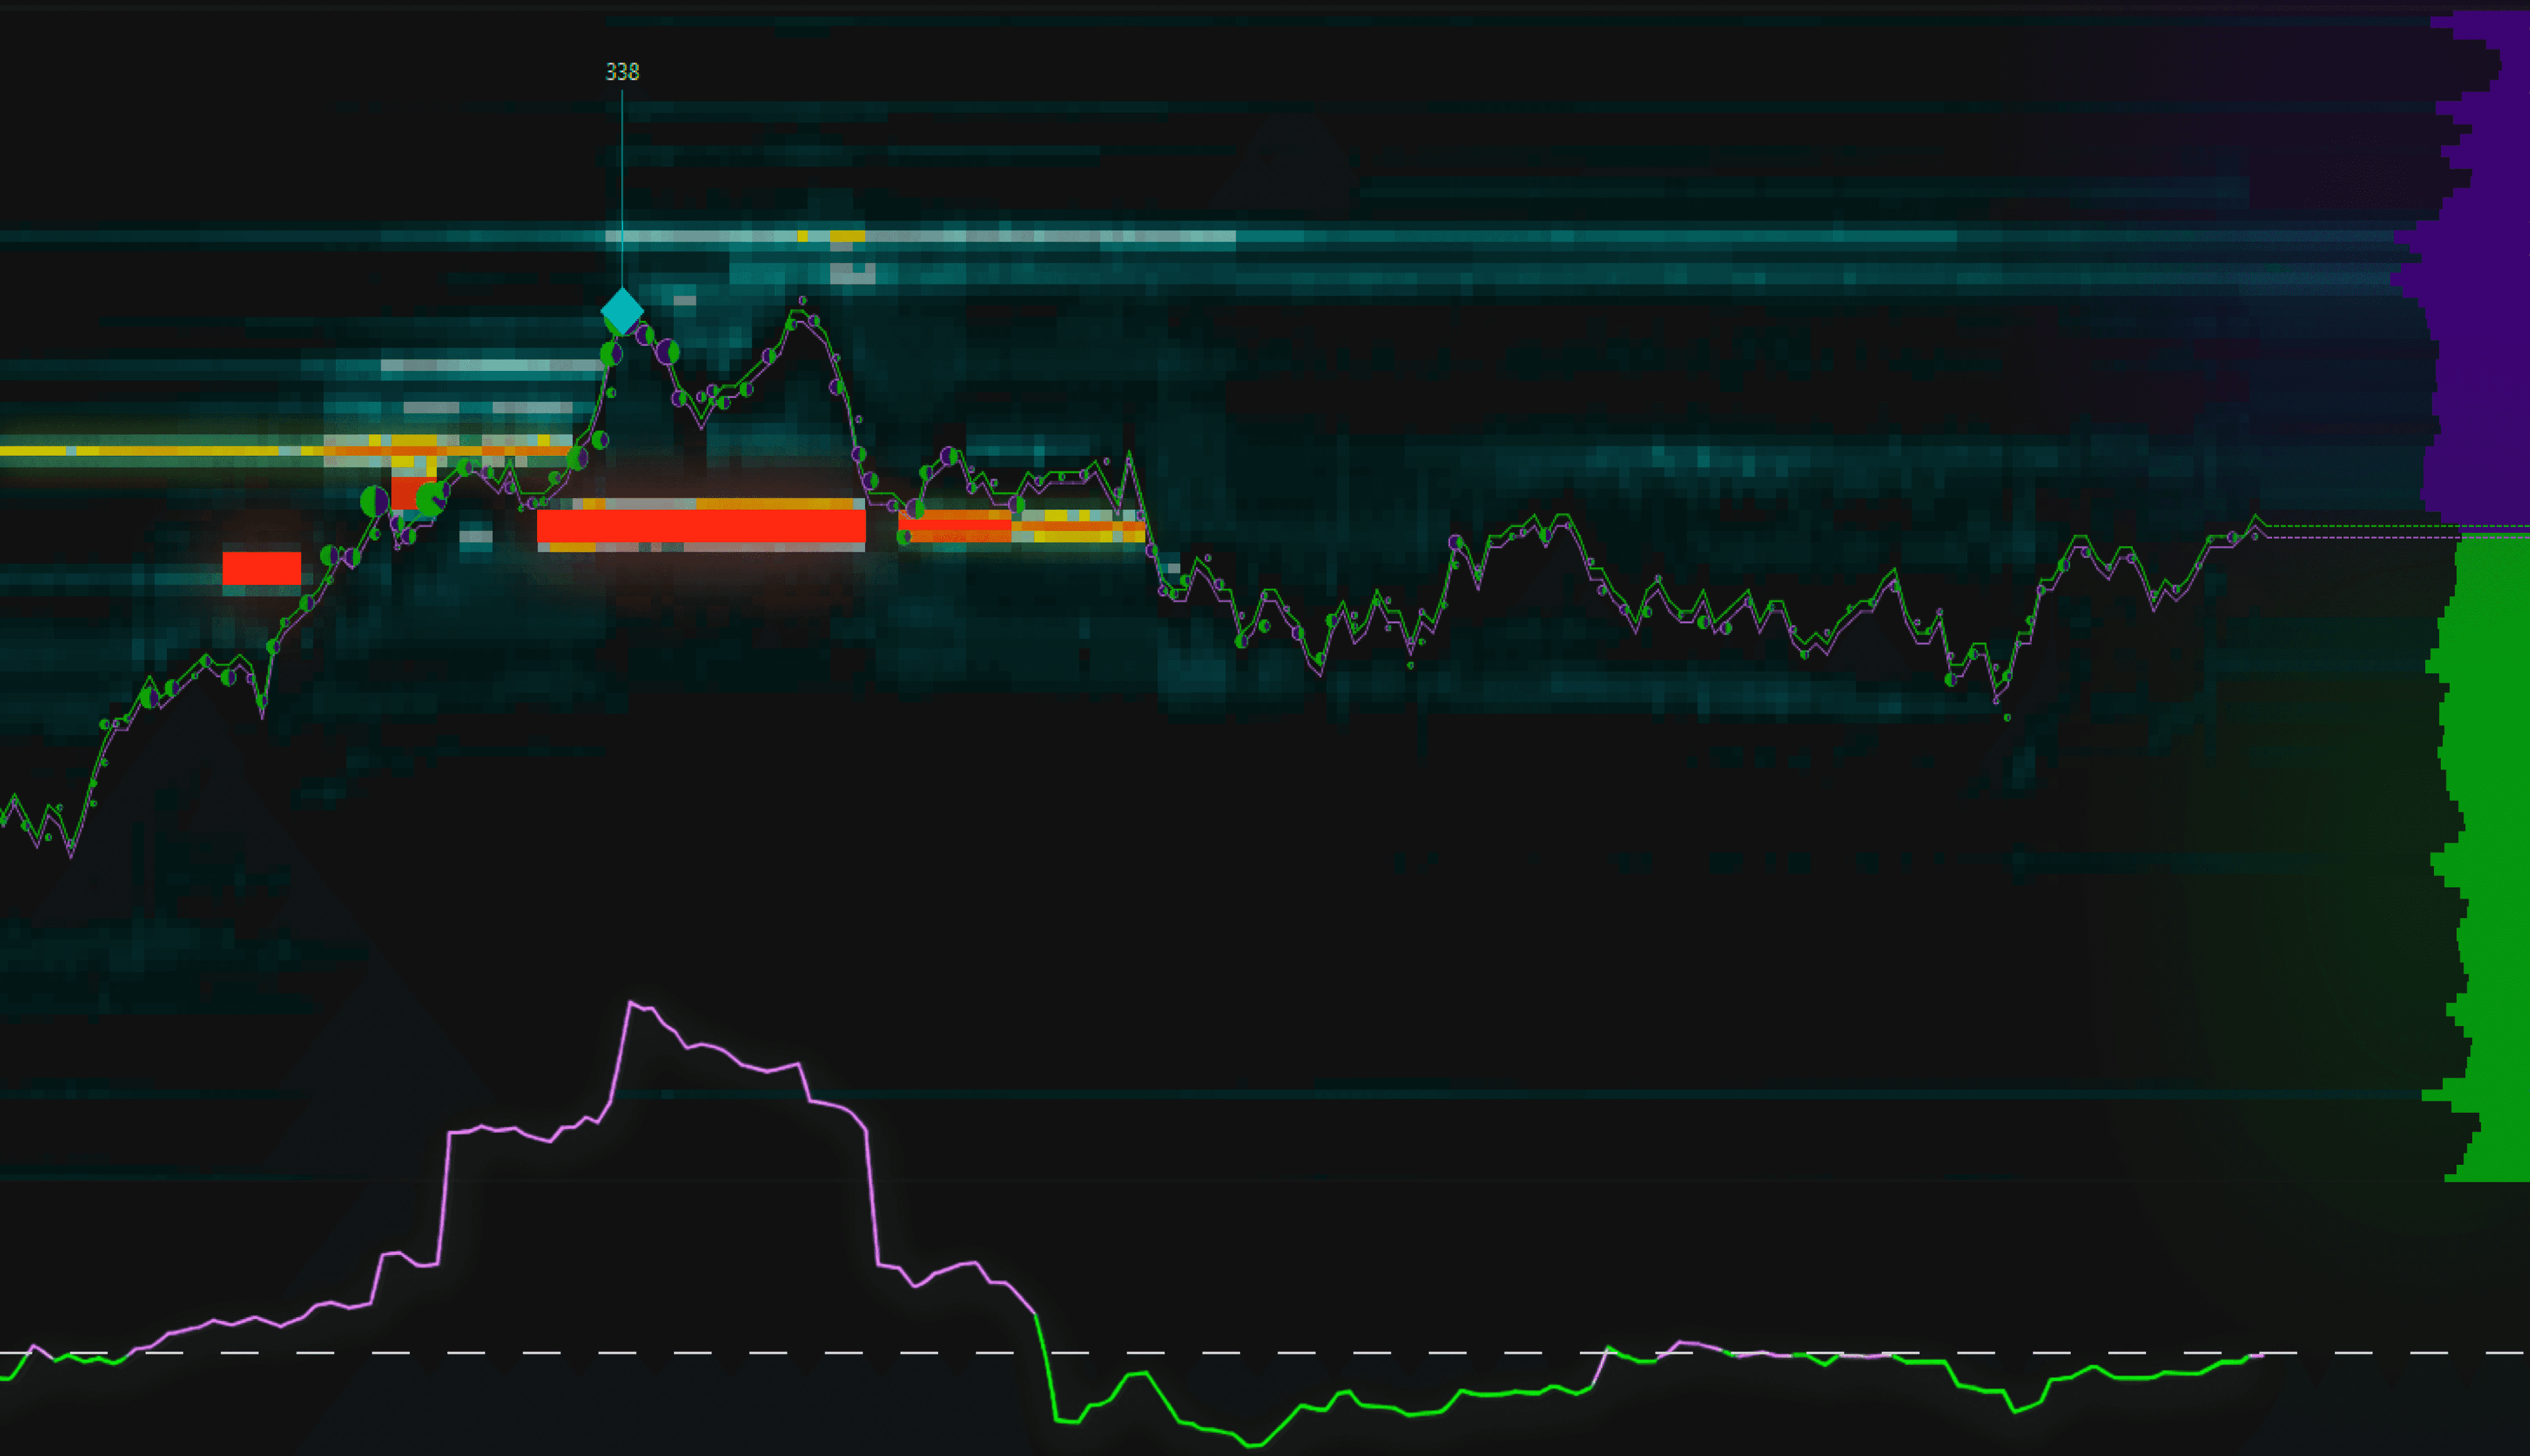
Ce que tu vois : Le mur s'amincit tick après tick, du rouge vers l'orange puis le jaune, pendant que l'agression garde sa taille et que le CVD pousse dans le sens de la cassure.
Le bon réflexe : Un mur consommé progressivement est une vraie cassure, un mur qui disparaît d'un coup est un pull. Au-delà, la zone vide sert d'accélérateur : vise le mur suivant.
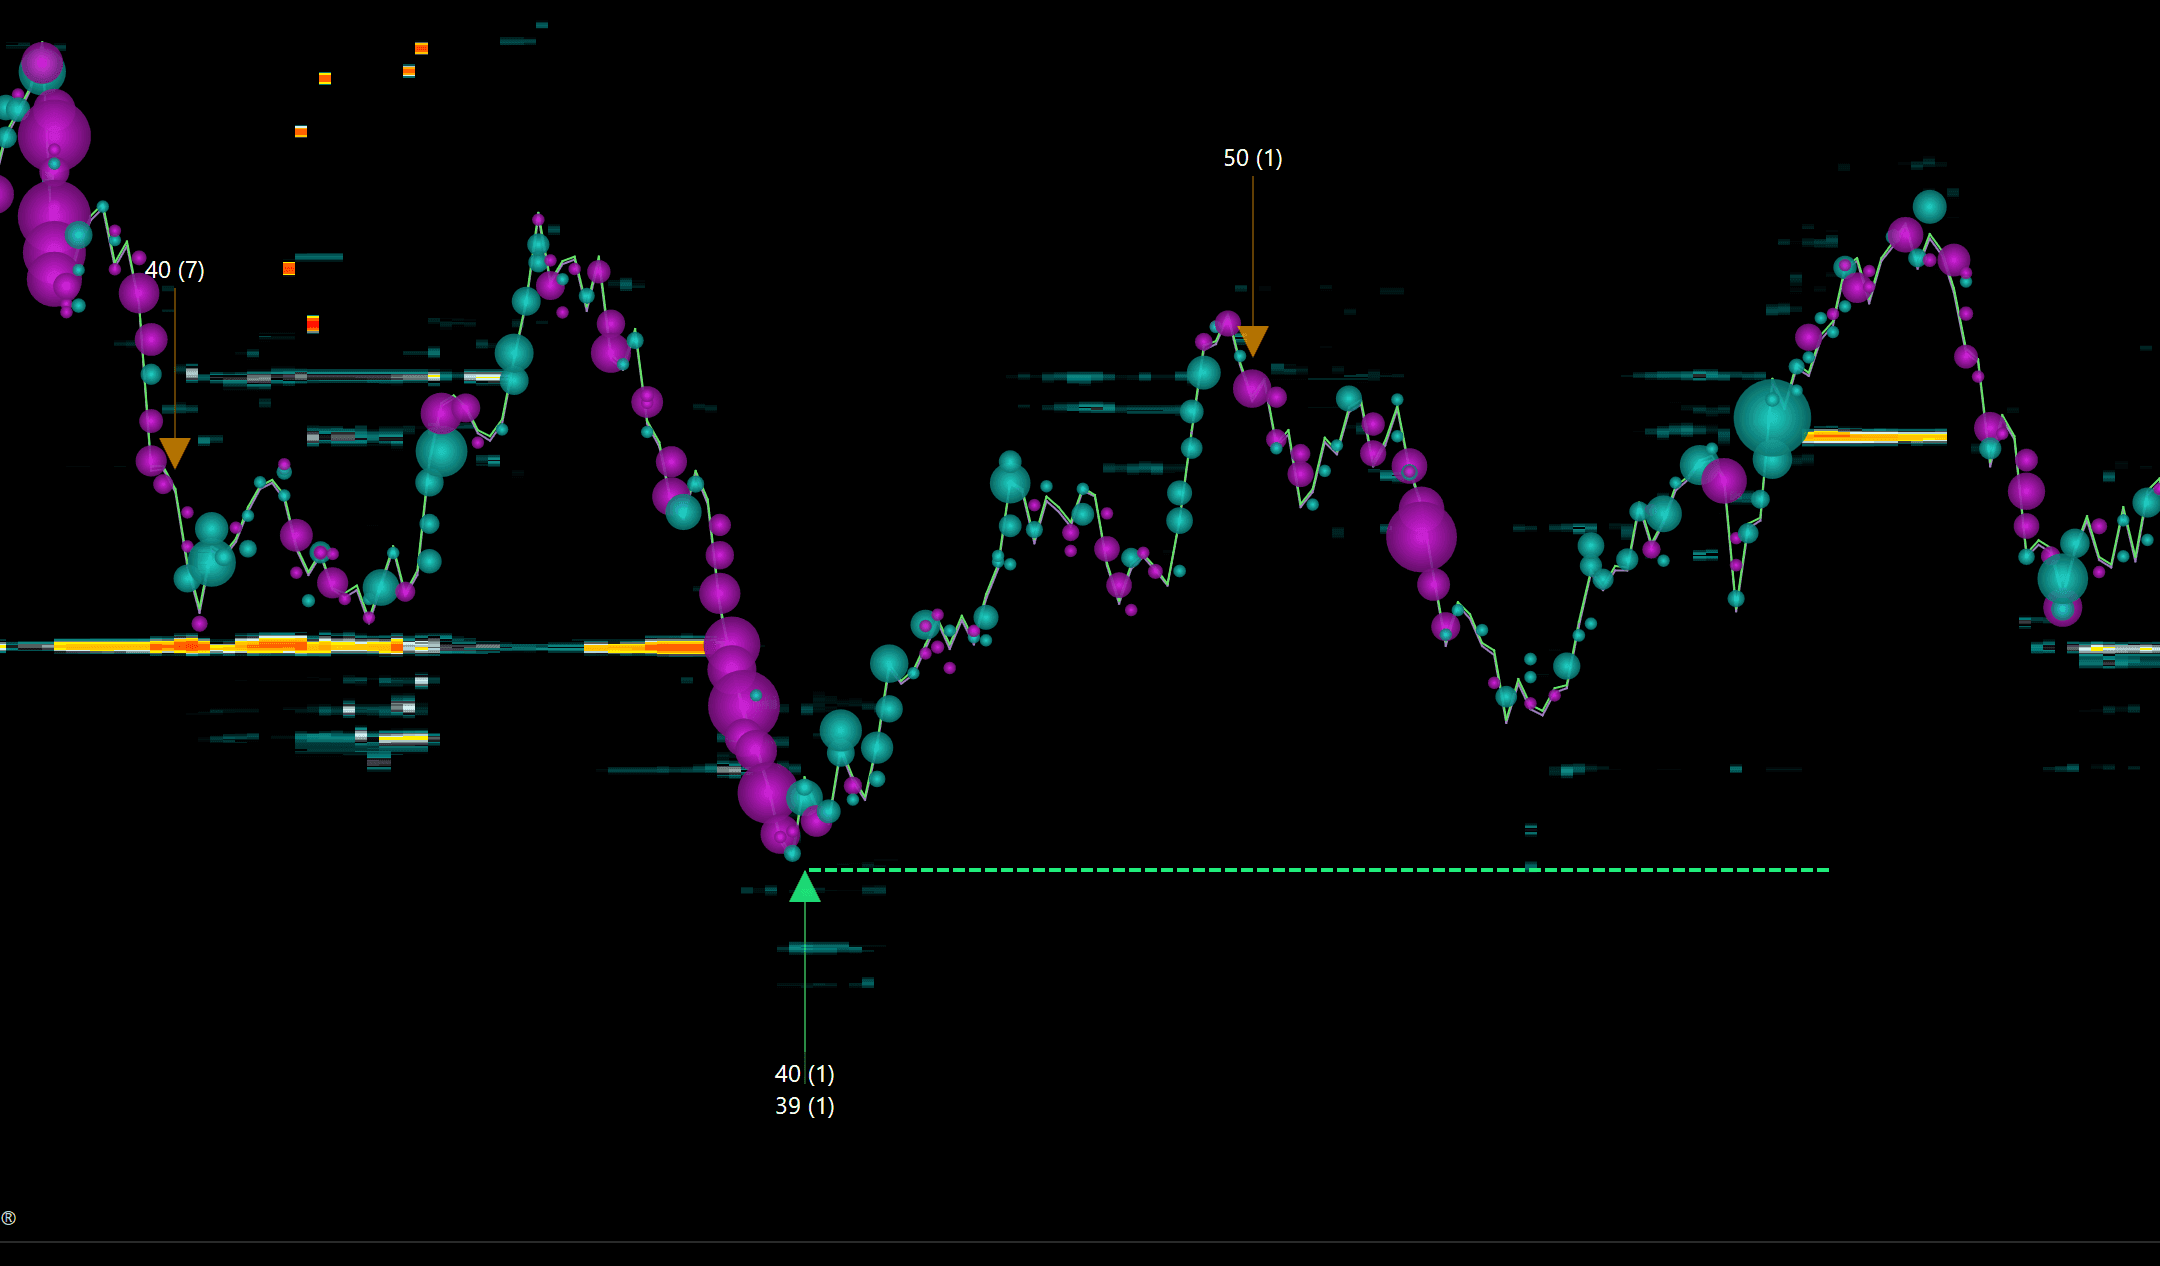
L'intérêt de l'outillage MBO, c'est que ces comportements cessent d'être une affaire d'interprétation. Ci-dessus, l'Iceberg Detector tamponne chaque rechargement sur le graphique avec la taille détectée et prolonge le niveau défendu. DeepDom fait pareil pour les chasses aux stops, et son détecteur Deep Wall, rare par conception, se déclenche quand un mur passif rejette franchement l'agression sur l'ES, ce qui trahit souvent un iceberg caché.
Qu'est-ce que le spoofing en trading ?
Le spoofing consiste à poser de gros ordres sans intention de les exécuter, pour simuler une pression, puis à les annuler quand le prix approche. La pratique est interdite sur les marchés réglementés. Sur une heatmap MBO, un mur qui disparaît systématiquement à l'approche du prix trahit ce comportement : l'inverse d'une absorption réelle.
Qu'est-ce qu'une chasse aux stops (stop run) ?
Une chasse aux stops est une poussée rapide vers une zone où s'accumulent des stops, sous un plus bas évident, au-dessus d'un plus haut, pour déclencher leur exécution et prendre la liquidité. Le prix revient souvent aussitôt dans le range. Sur la heatmap, la zone visée se repère à la liquidité qui borde ces niveaux.
Croiser avec l'agression : bulles, delta, CVD
La heatmap ne montre que la moitié du marché : les ordres qui attendent. L'autre moitié, ce sont les ordres qui frappent. DeepDom affiche chaque exécution au marché comme une bulle, au prix et à l'instant exacts, dimensionnée par la quantité : de petites bulles éparses sont du bruit, des grappes de grosses signifient qu'un acteur sérieux exécute. Le footprint, le delta et le delta cumulé (CVD) agrègent la même agression sous d'autres formes.
Les deux lectures n'ont de sens qu'ensemble. Un mur sans agression en face est une hypothèse. Une agression sans mur devant elle est un couloir. Et leurs combinaisons sont les vrais signaux : un volume massif dans une bande qui refuse de bouger, c'est l'absorption ; des bulles qui rétrécissent pendant que le prix avance, c'est l'épuisement ; un nouveau plus-haut du prix sans nouveau plus-haut du CVD dit que la hausse est vide. Ajoute le profil de volume et le VWAP pour le contexte, tracés directement sur le graphique DeepDom.
L'entonnoir de décision
Aucune couche ne se trade seule. Un signal vaut le nombre de lectures indépendantes qui s'alignent dessus. L'entonnoir va du contexte large au déclencheur précis, et si une étape manque, on ne descend pas à la suivante :
- 1Contexte
Un mur persistant sur la heatmap définit la zone. Pas de zone, pas de trade.
- 2Validation
La liquidité est réelle : elle tient, se recharge ou absorbe. Un retrait tue l'idée sur place.
- 3Déclencheur
L'agression tourne : épuisement du camp attaquant, ou grappe d'exécutions dans ton sens.
- 4Confirmation
Delta et CVD confirment, idéalement avec une divergence en ta faveur sur le niveau.
- 5Entrée
Sur la zone, stop derrière la structure qui porte la thèse, objectif sur de la liquidité réelle.
Trois setups de référence
Trois configurations récurrentes, de la plus simple à la plus exigeante. Entrée, stop et cible sont des principes à adapter à l'instrument et à la volatilité, pas des recettes. Les cours gratuits déroulent chacune sur des séances commentées.
Un mur d'achat tient depuis longtemps sous le prix. Le prix y revient, les vendeurs le frappent, la bande se recharge et les exécutions vendeuses rétrécissent.
Au contact du mur, dès l'épuisement vendeur.
Quelques ticks derrière le mur : s'il cède, la thèse est morte.
La prochaine bande de liquidité au-dessus, le POC ou le VWAP.
⚠ Invalide si le mur se retire à l'approche : un pull n'est pas un support.
Une impulsion agressive frappe un gros mur qui encaisse tout : volume énorme, prix plat. Quand l'agression s'épuise, le prix part dans le sens de l'absorbeur.
Au premier rejet, une fois l'épuisement des agresseurs visible.
De l'autre côté du mur absorbeur : au-delà, l'absorption a échoué.
2 à 3 fois le risque, ou la zone d'où venait l'impulsion.
⚠ Exige la confluence : absorption visible, divergence CVD, niveau de profil ou VWAP.
Le prix balaye un niveau évident dans une zone vide de la heatmap, déclenche les stops, ne trouve aucune liquidité en face et se retourne violemment.
Au retour du prix dans le range, après le sweep et la réabsorption.
Sous l'extrême de la mèche du balayage.
La liquidité opposée, souvent là où s'accumulent les stops adverses.
⚠ On n'anticipe jamais le sweep : entrer trop tôt, c'est être soi-même la liquidité chassée.
Commun aux trois : le stop se cache derrière la liquidité qui porte la thèse, jamais à un chiffre rond, et la cible est une zone de liquidité réelle, jamais un montant arbitraire. La gestion du risque fait le reste : 1 % maximum par idée, un minimum de 2R, et une limite de perte journalière réellement respectée.
Le poste DeepDom
Tout ce qui précède est ce qu'affiche le module DeepDom de DeepCharts : la heatmap MBO rafraîchie toutes les 0,01 seconde, les bulles d'exécution, la détection des icebergs et des chasses aux stops, avec une lecture du carnet qui descend loin dans l'échelle tout en restant légère pour le CPU. Autour de la carte, le poste ajoute le DOM avancé et ses colonnes d'analyse, le time and sales, le profil de volume, le delta et le CVD.
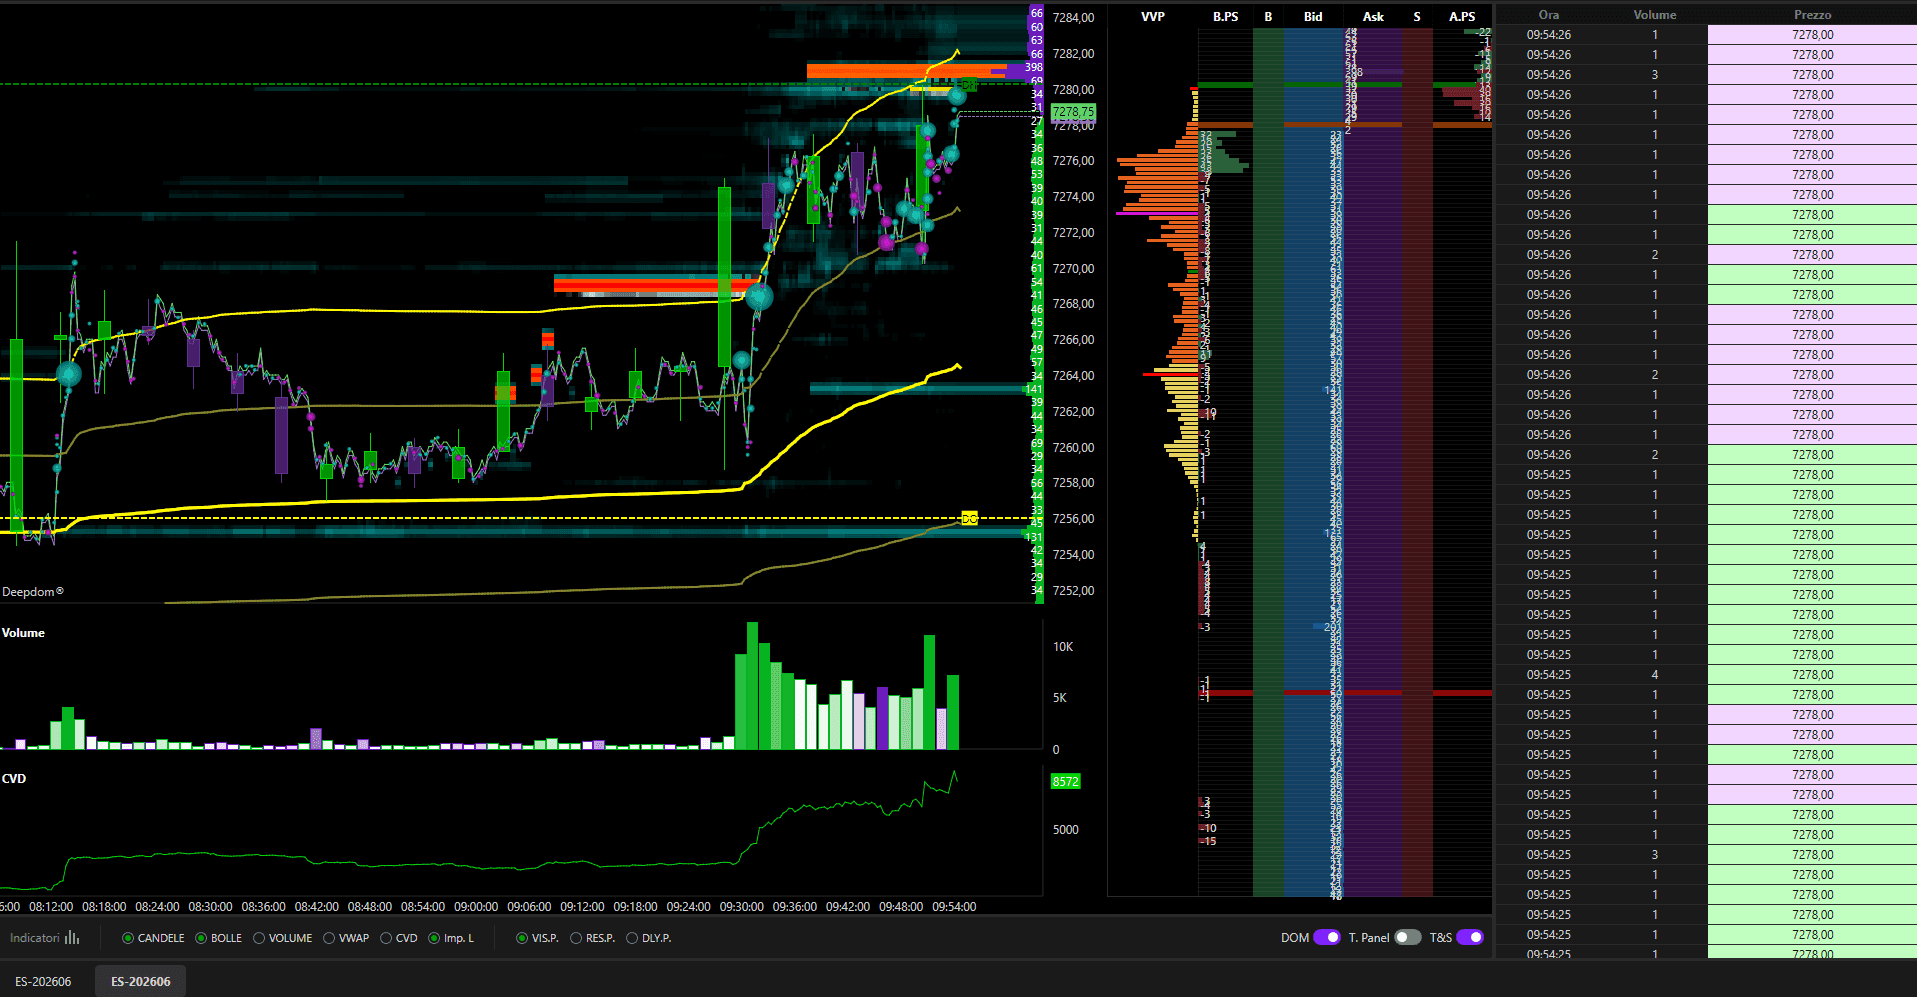
Les colonnes du DOM avancé à connaître en premier :
| Colonne | Ce qu'elle t'apprend |
|---|---|
| Bid / Ask | Les ordres limit en attente de chaque côté, niveau par niveau : la demande sous le prix, l'offre au-dessus. |
| VP | Le profil de volume de la séance, collé à l'échelle : les prix où le marché a réellement traité. |
| B.PS / A.PS | Pull et Stack : ce qui vient d'être ajouté ou retiré à chaque niveau. La colonne qui démasque un mur qui fuit avant le contact. |
| BT / AT | Le volume exécuté au marché à la vente et à l'achat : l'agression réelle, à comparer à la taille affichée au carnet. |
| Offers | Le nombre d'ordres qui composent chaque niveau : un ordre de 300 lots n'a pas le même sens que 50 ordres de 6. |
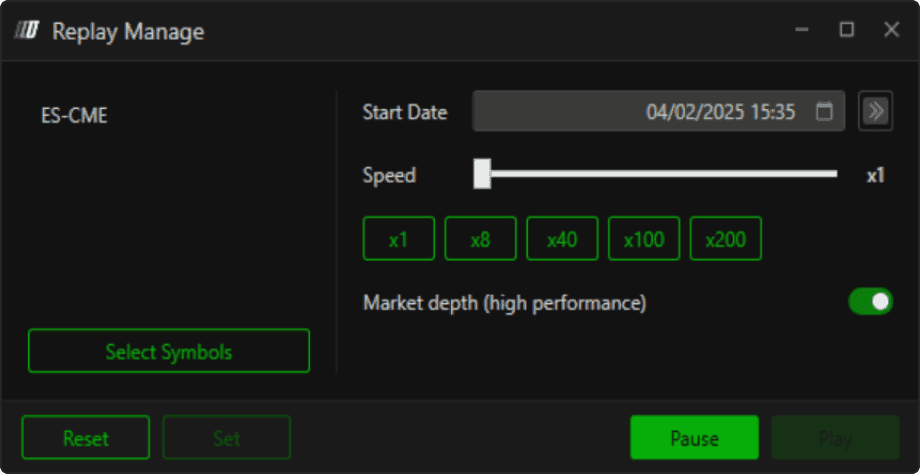
L'exécution se fait dans la même fenêtre : les ordres se posent et se déplacent directement sur la heatmap, avec un bracket OCO qui attache le stop et l'objectif à l'entrée, en compte réel ou SIM. Et le moteur de replay rejoue n'importe quelle séance passée au tick, profondeur de carnet comprise, de x1 à x200 : le moyen le plus rapide de s'entraîner à la lecture sans rien risquer.
Côté budget, compte trois postes : la licence de la plateforme, de 39 à 94 $/mois, le flux de base, dxFeed dès 19 $/mois, et la profondeur MBO facturée par la place, 39 $/mois sur le CME et +65 $/mois pour l'Eurex, rare sur le FDAX et l'une des raisons pour lesquelles on travaille sur cette plateforme. Tarifs indicatifs, détaillés sur la page DeepCharts.
Paramétrer DeepDom, réglage par réglage
Chaque tutoriel reprend tous les onglets de la fenêtre de réglages, avec la valeur par défaut de chaque champ et ce qu'il change à l'écran.
Les pièges qui coûtent
La taille affichée ne coûte rien à celui qui la pose. Seul le comportement compte : un mur qui tient et se recharge est réel, un mur qui fuit est un leurre.
Un mur apparu il y a dix secondes n'a pas la valeur d'un mur qui tient depuis une heure. C'est la confusion qui fait tomber dans tous les spoofs.
Le stop pile sous le plus-bas évident, l'entrée pile sur le niveau que tout le monde voit : si le setup est évident, demande-toi qui veut que tu le voies.
Une grosse bande sans confirmation d'exécution n'est qu'une hypothèse. Sans l'agression en face, tu trades une image, pas un marché.
Le stop se place là où la thèse devient fausse, derrière le mur qui la porte, jamais à une distance arbitraire ni au chiffre rond où dorment tous les stops.
Sur un CPI ou un FOMC, le carnet se vide et les retraits explosent : la heatmap ne veut plus rien dire pendant plusieurs minutes. Reste à plat et regarde.
Trade-la en compte financé
Plusieurs propfirms order flow intègrent DeepCharts : tu trades la heatmap avec leur capital, tu passes l'évaluation, tu respectes le drawdown, tu gardes une part des gains. Compare les règles et les plateformes dans le comparateur. Une nuance à connaître : la version fournie par une propfirm n'ouvre pas tous les indicateurs, donc pour la lecture complète il te faudra ta propre licence.
Questions fréquentes
Qu'est-ce qu'une heatmap en trading ?+
Une heatmap de trading est une carte en direct de la liquidité en attente : les ordres limit d'achat et de vente colorés selon leur taille, empilés dans le temps. Elle montre où se placent les gros ordres avant qu'ils n'agissent, pour anticiper les réactions du prix.
Comment lire une heatmap ?+
Les bandes vives sont de gros ordres en attente (murs de liquidité). Observe leur comportement : un mur qui absorbe l'agression fait plafond ; un mur qui s'évapore à l'approche du prix, c'est souvent du spoofing ; les zones vides laissent le prix accélérer jusqu'au mur suivant.
Heatmap ou footprint : quelle différence ?+
La heatmap montre la liquidité en attente (passive) dans le carnet, dans le temps. Le footprint montre le volume exécuté (agressif), achat contre vente, par prix. L'une anticipe où le prix peut réagir, l'autre confirme ce qui s'y passe.
Quelle donnée faut-il pour une heatmap fiable ?+
La donnée MBO, le carnet diffusé ordre par ordre. Sur du Level 2 agrégé, impossible de voir un iceberg se recharger ou un ordre se retirer : précisément ce que la lecture cherche. Cette profondeur est facturée par la place : environ 39 $/mois sur le CME, environ 65 $/mois pour l'Eurex.
Quel logiciel affiche une heatmap de liquidité ?+
Peu d'outils lisent le carnet ordre par ordre : Bookmap, Sierra Chart avec le bon module, Quantower et DeepCharts, dont le module DeepDom se rafraîchit toutes les 0,01 seconde. Plusieurs propfirms intègrent aussi DeepCharts à leurs évaluations.
Liquidité fraîche ou persistante : quelle différence ?+
Un ordre frais vient d'apparaître et peut se retirer à tout moment ; un ordre persistant tient depuis longtemps malgré les mouvements, donc quelqu'un défend vraiment ce niveau. La lecture pèse l'âge d'un mur autant que sa taille.
Combien coûte un setup heatmap complet ?+
Trois postes : la licence de la plateforme (de 45 à 94 $/mois chez DeepCharts, relevé le 6 octobre 2026), le flux de données (dxFeed dès 19 $/mois) et la profondeur MBO (39 $/mois pour le CME, +65 $/mois pour l'Eurex). Environ 200 $/mois tout compris, pour un outil professionnel.
Peut-on s'entraîner gratuitement à lire la heatmap ?+
Oui. Notre démo interactive gratuite simule murs, icebergs, spoofing et chasses aux stops. Et le replay au tick de DeepDom rejoue de vraies séances passées, profondeur de carnet comprise, sans rien risquer.
Tu veux progresser en order flow ?
On échange en direct sur le flux, la liquidité et nos trades, chaque jour, sur le Discord OrderFlowFutures. Rejoins-nous, c'est gratuit.
Rejoindre le Discord gratuitement6 en ligne·81 membres·Gratuit · accès instantané