Published
What is Deep Zones (Deep Walls)?
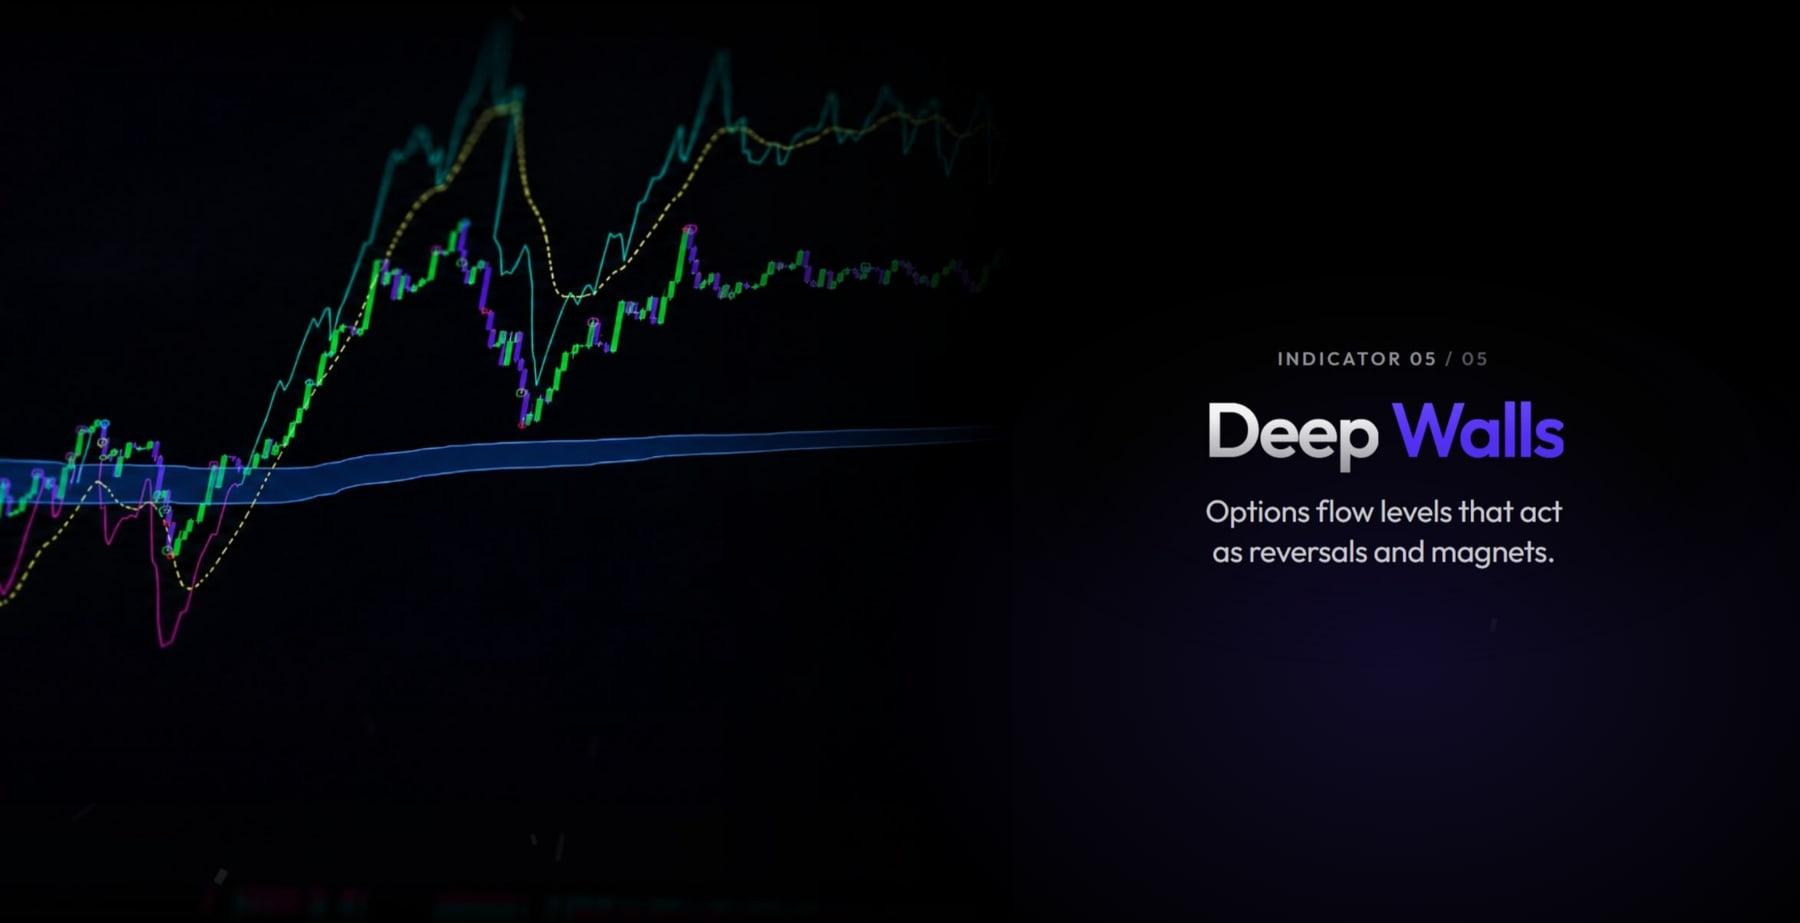
Deep Zones is one of six new DeepCharts Pro indicators, announced in November 2026. The anniversary announcement describes it as automatic identification of reversal zones. In the same slot, the Pro indicators presentation lists Deep Walls: levels drawn from options flow that act as reversal zones or magnets for the market.
Our link opens DeepCharts with code OFF already filled in at the Payment step. Arriving without it? Enter OFF in the promo code field yourself.
What DeepCharts has shown
A word on names first: the "Introducing PRO Indicators" presentation says Deep Walls, the pricing grid says Deep Zones, and nothing says yet whether it's the same tool renamed. Nor is Deep Walls the same as Deep Wall, the passive wall detector on the ES that already exists. On the Deep Walls slide, curves and a wide blue band drawn from options flow follow price. On the capture the grid attaches to Deep Zones, a "Deep Zone" panel gives a direction (long in the example), two targets and two entries, each with its distance in points and a historical percentage. It's the bridge between the Pro gamma suite and reading the flow: the level comes from the options, the reaction is read on the footprint.
Using it day to day
Day to day, treat the zone as a place to watch, not an order to place. Before the open, note the zones near price and their likely role: reversal if price reaches it at the end of a move, magnet if price is far away and the market lacks direction. During the session, wait for the flow's reaction on contact. If the panel shows percentages, use them to compare entries with each other: a near entry fills often with less margin, a far entry gives a better price but rarely fills.
Example from the grid capture, on ES: long zone, first target reached 60% of the time for about 26 points, near entry 28 points below price at 28%, far entry 33 points below at 14%. Waiting for the far entry means accepting to miss most opportunities for a better price. If price drops to the near entry and buying absorption shows on the footprint, you have context and trigger in the same place.
⚠ The trap to avoid
The central trap is reading the percentages as the probability of the trade you're about to take. They're historical frequencies, with hit rules the documentation hasn't specified yet, that account for neither your stop, nor your execution, nor the day's regime. The second trap is confusing magnet and reversal: a level that pulls price in doesn't say whether it will push it back once touched.
Combine it with
The level comes from the options, the reaction is read on the footprint: that's the pairing DeepCharts puts forward. Deep Frame Engine gives the session bias the zone sits in, and Deep Trades Reversal shows whether big trades got trapped on contact. And to keep the names straight, Deep Wall remains the tool for passive walls in the book.
FAQ
Are Deep Zones and Deep Walls the same indicator?+
Nothing confirms it for now. DeepCharts' pricing grid shows Deep Zones, the Pro indicators presentation lists Deep Walls in the same slot. Both names are given here until the official documentation is out.
What's the difference between Deep Walls and Deep Wall?+
Deep Wall is an existing DeepCharts tool that detects passive walls in the ES book. Deep Walls, presented in November 2026, draws its levels from options flow. They're not the same tool.
Are Deep Zones percentages win probabilities?+
No. They're past frequencies, measured on a sample under the study's rules. They're for comparing levels with each other, not for predicting your trade.
Which DeepCharts plan includes it?+
The Pro plan, the only one that includes the six new studies (Deep Flow, Deep Radar, Deep V Tracker 2.0, Deep Trades Reversal, Deep Frame Engine and Deep Zones), according to the DeepChart grid checked on November 9, 2026.
Latest decoded trading sessions
A real trading day read live on the heatmap and the footprint: macro events, the levels that held, and every read with its DeepCharts screenshot.
- ESThursday, November 12, 2026Possible ouster of Jensen Huang drags Nvidia lower and weighs on the ES
- ESWednesday, November 11, 2026Tech takes back the lead behind Nvidia and CoreWeave, bond market closed
- NQWednesday, November 11, 2026Semiconductors lift the Nasdaq 100 after CoreWeave's results
Want to get better at order flow?
We discuss flow, liquidity and our trades live, every day, on the OrderFlowFutures Discord. Join us, it's free.
Join the Discord for free5 online·118 members·Free · instant access