Updated · first published
What is Deep Profile Values?
The volume profile answers one question: at which prices did the market actually trade? But its histogram eats part of the chart, and intraday you really only use a handful of its values. Deep Profile Values sorts that out: it plots the levels and drops the drawing.
What DeepCharts does better
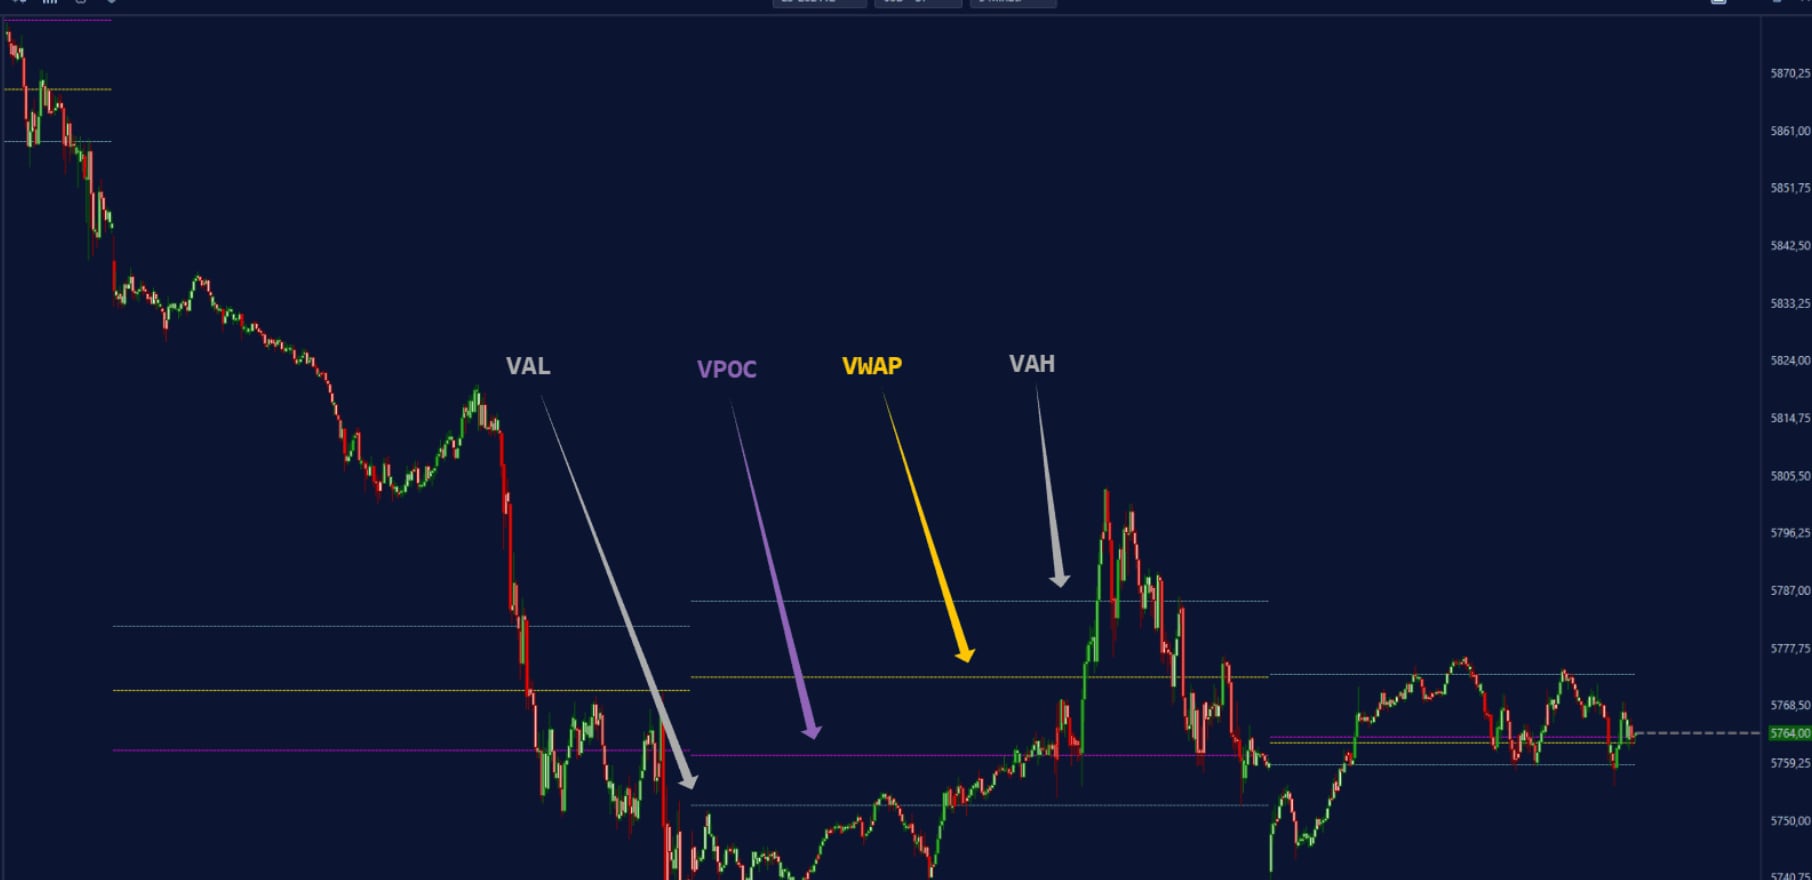
It allows the main values of the Volume By Price indicator to be plotted on the chart without the histogram: the Point of Control (POC), the price level with the highest volume; the Value Area, the price range within which a given percentage of total volume traded; VWAP, a benchmark for assessing whether an execution price is good relative to the market; standard deviations; and peaks and valleys, the areas of highest and lowest traded volume.
Using it day to day
Four period modes: Composite for all data, Multiples for separate periods, Visible for the current zoom, Personalized for chosen dates. The data input is configurable too, volume, orders, aggregate trades or number of trades, and each gives a different read of the same market. Extensions (none, till interaction, till end of window) decide how long lines persist, and a customized timetable lets you filter by session or split ETH and RTH.
Typical case: you want yesterday's US session POC and value area without cluttering a chart already carrying a footprint. You set the period to Personalized, filter the timetable to RTH, and get three clean lines that follow you through the next session: the prices the market will want to revisit.
⚠ The trap to avoid
The trap is changing the data input without thinking. A POC computed on number of trades does not land at the same price as a POC computed on volume: the first counts decisions, the second counts lots. Both are valid, but mixing them from one session to the next makes your history incomparable. Pick one and keep it.
Combine it with
These levels are the skeleton; the footprint and the heatmap are the flesh. Yesterday's POC is just a price until you see how flow behaves when it gets tested. The most useful combination stays the simplest: level drawn in advance, decision taken in the flow.
FAQ
How is this different from a classic volume profile?+
The computed content is the same: these are the Volume By Price indicator's values. The difference is display: Deep Profile Values plots the levels (POC, value area, VWAP, standard deviations, peaks and valleys) without the distribution histogram.
Which data types can be used as input?+
Four: volume, orders, aggregate trades and number of trades. Each gives a different perspective on the same activity: volume weighs size, number of trades weighs how often decisions were made.
Can ETH and RTH sessions be separated?+
Yes. The customized timetable lets you filter by session or split the analysis into distinct periods, ETH and RTH for example, which changes the resulting POC completely.
What is the difference with the classic Volume Profile indicator?+
Deep Profile Values only shows the profile's key values (POC, Value Area, VWAP, peaks and valleys) without drawing the full histogram of volume by price, unlike Volume Profile which plots the entire distribution. The choice comes down to reading precise levels versus visualizing a distribution.
Can several profiles show at once?+
Yes, Number of profile in the VWAP and summary panel sets how many profiles display simultaneously, which makes it possible to compare several sessions side by side.
Is the Custom Hours time zone my own machine's?+
No, Session start and Session end are always expressed in US time regardless of the machine's own time zone, worth keeping in mind when entering these two values.
Tutorial & settingsDeep Profile Values: the complete settings, panel by panel
+A volume profile without a histogram to draw: only the key levels (POC, Value Area, VWAP) show up. Every settings panel explained.
Deep Profile Values shows the main values of a volume by price profile without drawing the full distribution. Unlike a classic profile that plots a histogram across the whole chart height, it only shows the levels that matter: the point of control, the Value Area, VWAP and its bands. This tutorial goes through every configuration panel in logical order, from the analyzed period to the summary display options.
- The Deep Profile Values indicator added to the chart from the indicator list
Step by step
- 01
Choose the analyzed period
In the General tab, Vbp period sets what the profile groups: Composite adds everything into one single area, Multiple shows several distinct periods side by side, Visible limits itself to the area currently shown on screen, Custom opens a range set by hand through Start Date/Time in the Custom Period tab. Length type (minutes, days, weeks, months, or volume) and Length value then set the size of each period; the default capture shows Multiple / Days / 1, one day blocks.
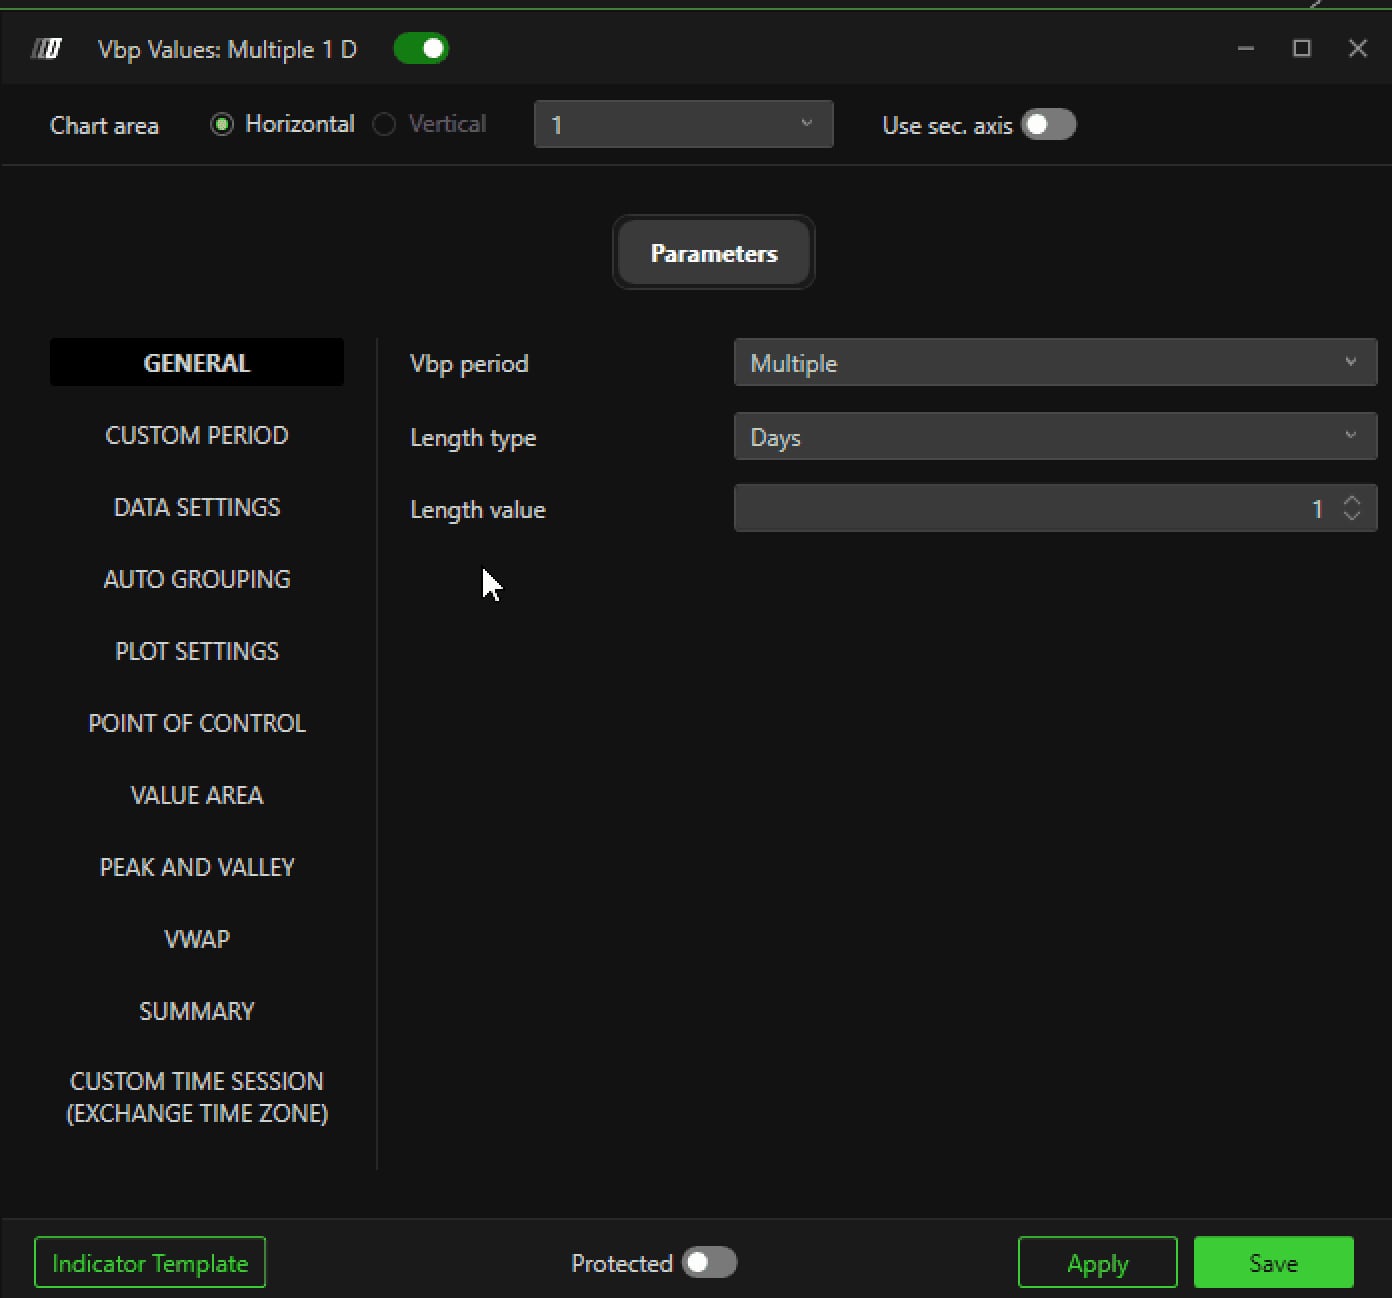
The General tab with VBP Period, Length type and Length value.© DeepCharts - 02
Set the data and the grouping
Input data chooses what feeds the calculation: Volume, Order, Aggregate Trades or Number of Trades, each giving a different read of the same period. Min filter and Max filter exclude respectively volumes that are too low and abnormally high spikes. The Auto Grouping panel then sets how price ticks group into profile levels: in Automatic mode, Grouping factor controls how aggressive the grouping is; in Manual mode, Manual ticks sets that number by hand.
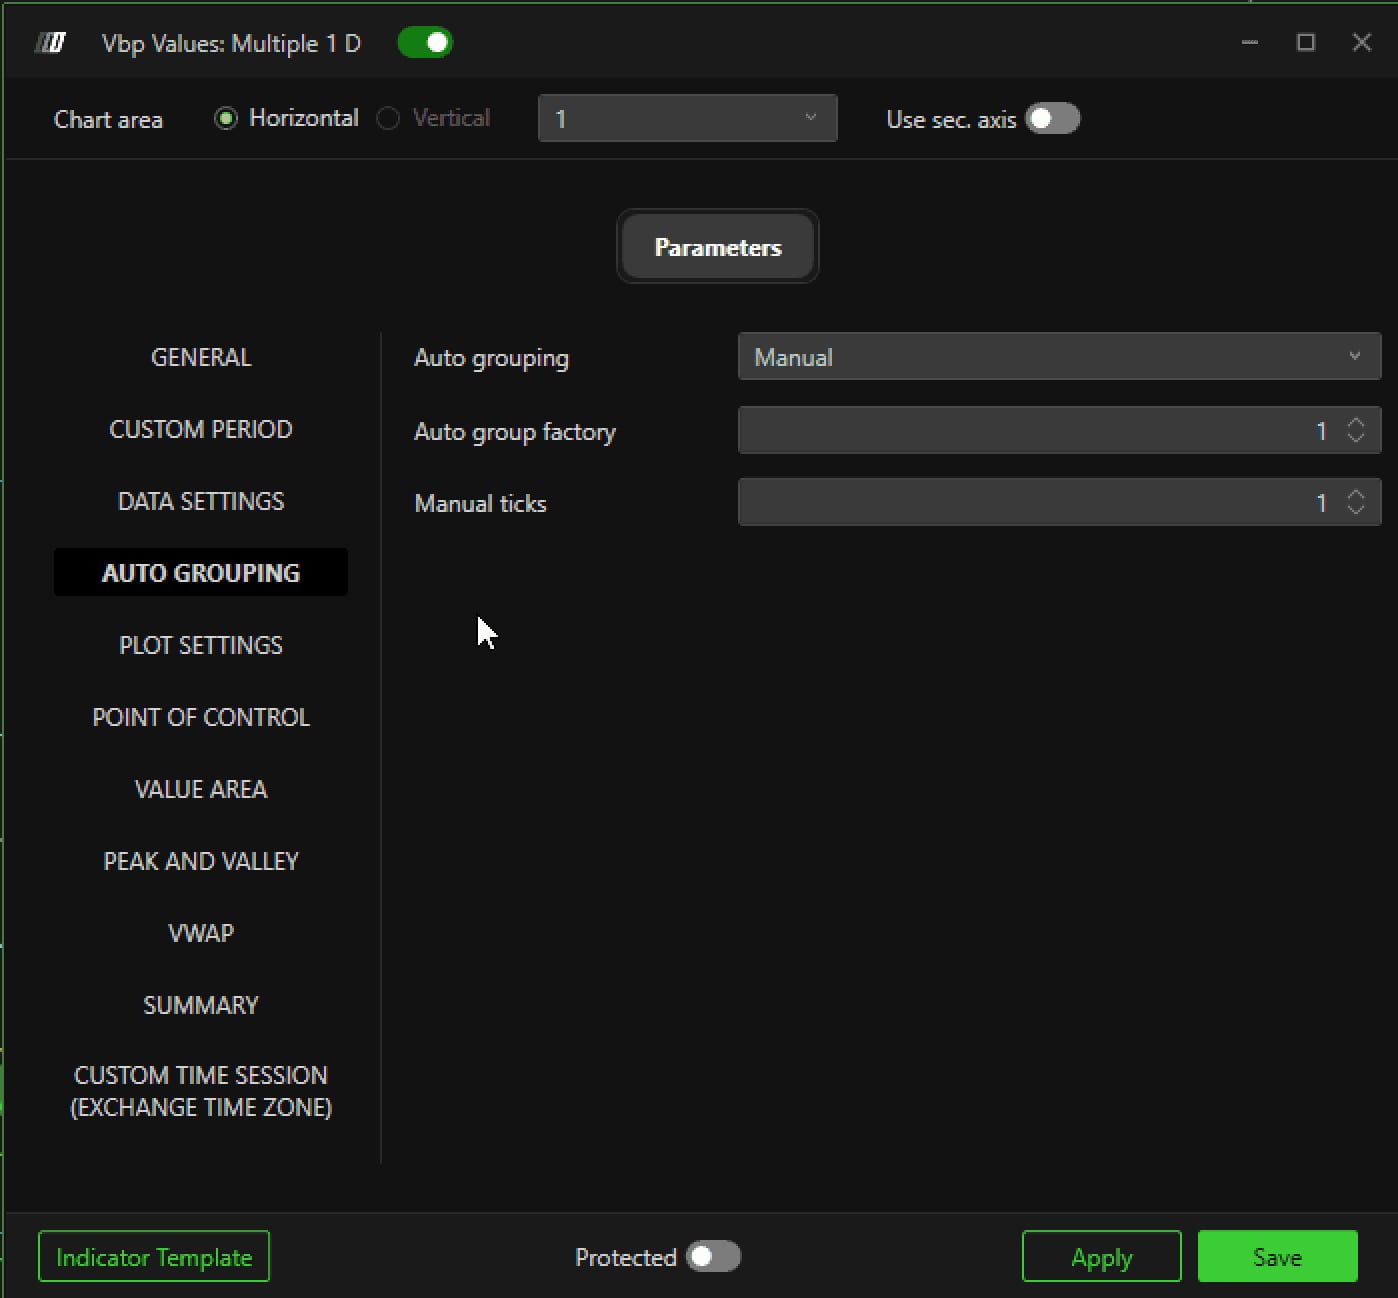
The Data Settings and Auto Grouping tabs.© DeepCharts - 03
Turn on the point of control (POC)
The POC panel shows the price level that concentrated the most volume over the period. Show line offers three modes: Show for a static line, Develop for a continuous dynamic recalculation, Extended offset for a highlighted zone. Extend line stretches the plot beyond the period: Until interaction keeps the line visible until price has touched it back, which makes a still virgin level stand out at a glance.
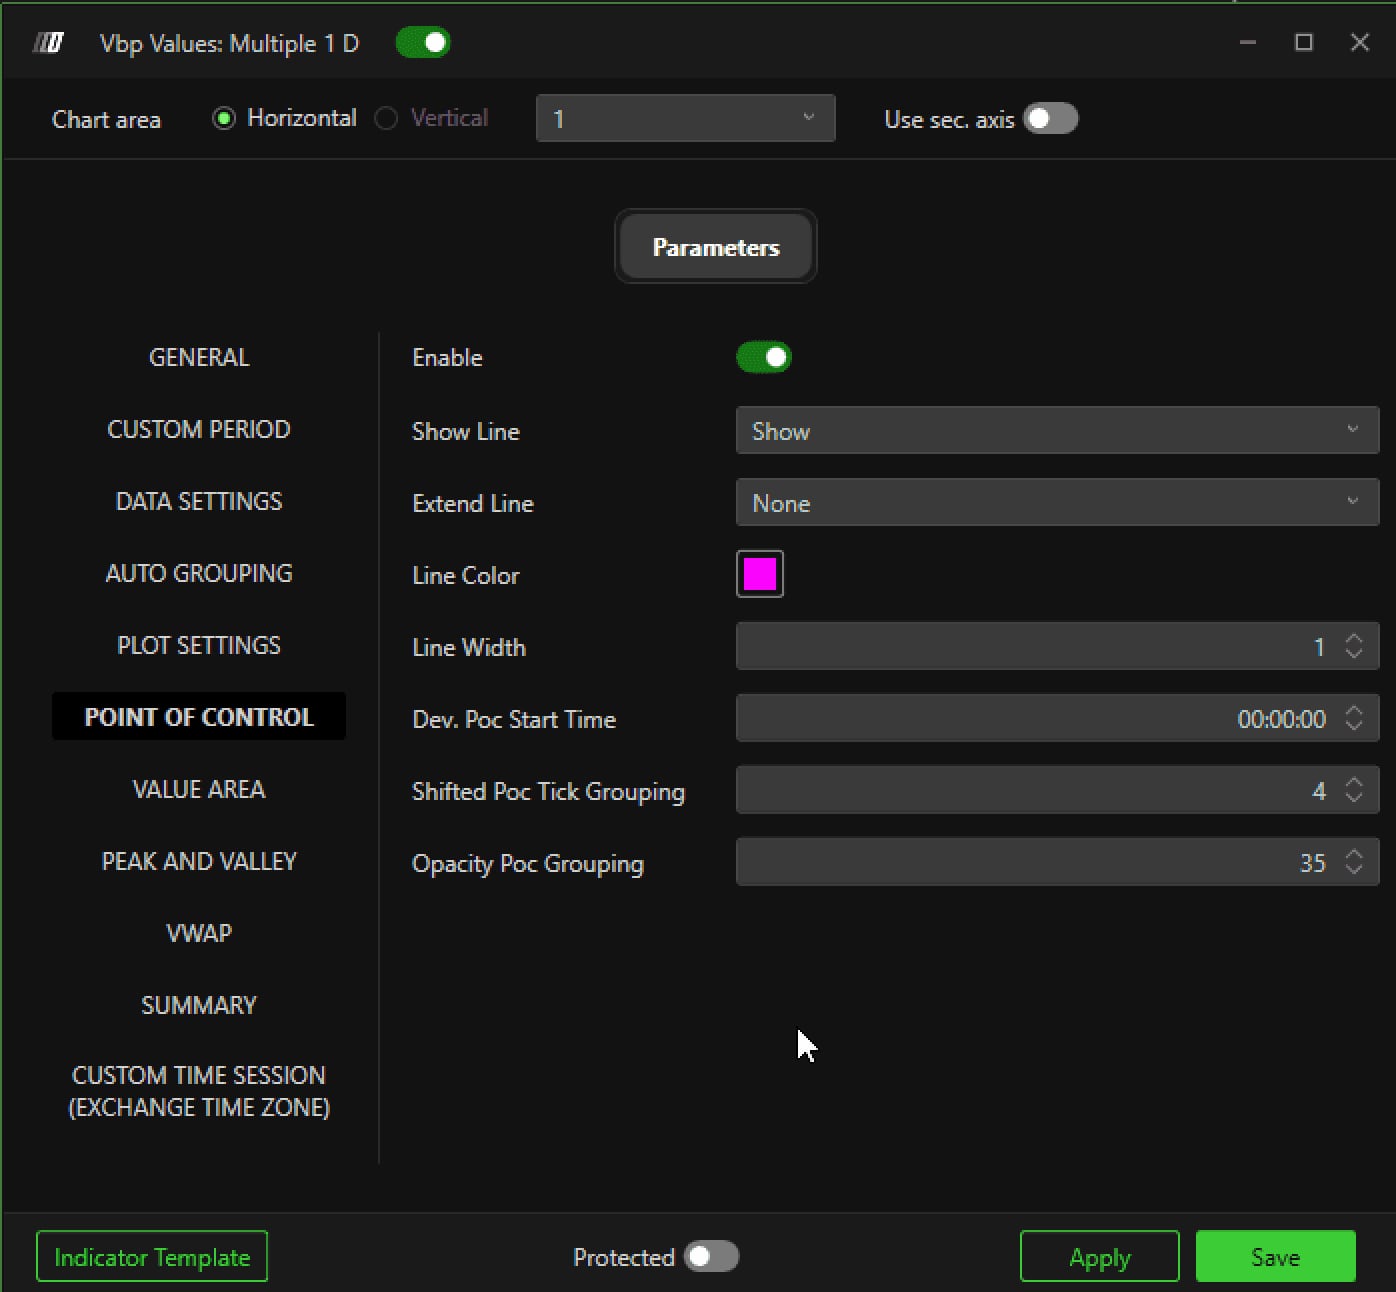
The POC panel with Show line and the extension options.© DeepCharts - 04
Turn on Value Area and VWAP
Value Area shows the price range holding a given percentage of the total volume, seventy percent by default through % Value Area, with the same Develop and Extend line options as the POC. The VWAP panel plots the volume weighted average price: Dynamic VWAP updates it in real time as volume adds up, and Enable bands adds standard deviation envelopes around the line, tuned through Bands settings.
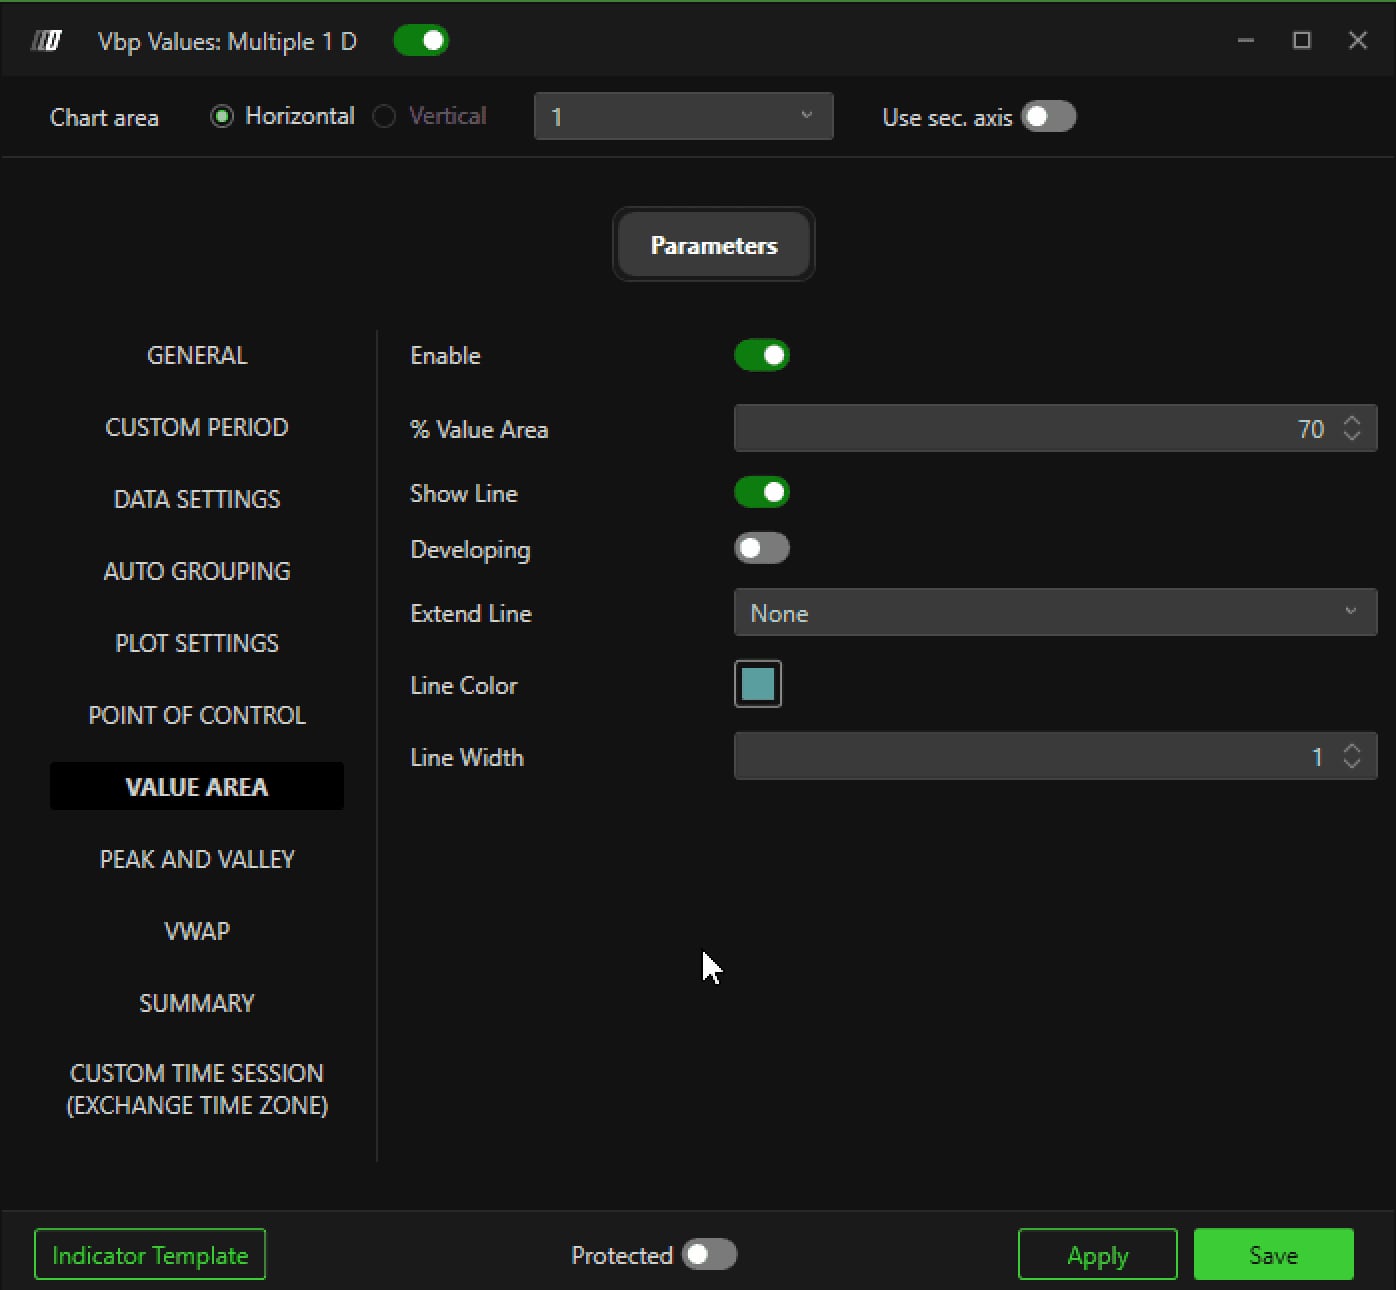
The Value Area and VWAP panels with their display options.© DeepCharts - 05
Configure the summary and the session hours
Enable summary adds a block of text statistics next to the profile: Volume summary and Trades summary choose what shows up, Ask color and Bid color visually tell the two sides apart. If the profile needs to stick to one specific session rather than the whole day, Filter mode in the Custom Hours tab switches to Filter or Split, with Session start and Session end entered in US time regardless of the machine's own time zone.
Screenshot to comeThe Summary tab and the Custom Hours panel with its session bounds.
Settings, tab by tab
Multiple by default on the capture; sets the analysis interval the profile groups together.
Days by default on the capture.
Unit set by Length type.
Only relevant when Vbp period is set to Custom.
Volume by default; changes what the profile actually measures.
Excludes respectively volumes that are too low and abnormal spikes.
Manual by default on the capture.
Grouping intensity in Automatic mode.
Number of ticks grouped in Manual mode.
How many profiles show at once, useful for comparing sessions.
Show for a static line; Develop for a continuous dynamic recalculation, Extended offset for a highlighted zone.
Until interaction flags levels that are still virgin.
Percentage of the total volume bounding the zone.
Updates the line in real time as new volume comes in.
Adds standard deviation envelopes around VWAP.
Chooses what shows up in the statistics block.
Visually tells the two sides apart.
Always entered in US time (Exchange Time Zone) regardless of the machine's own time zone.
⚠ Traps to avoid
- Confusing Deep Profile Values with the classic Volume Profile indicator. Deep Profile Values only shows the key values, without drawing the full histogram of volume by price the way Volume Profile does. The choice depends on the need: reading precise levels, or visualizing the whole distribution.
- Setting Value Area and POC to Develop mode without knowing it recalculates continuously. A line that keeps moving while you are trying to read a fixed level is often a sign that Show line should have stayed on its static mode.
- Entering Session start and Session end in the machine's own time zone rather than the expected one. Both fields in the Custom Hours tab are always expressed in US time.
Want to get better at order flow?
We discuss flow, liquidity and our trades live, every day, on the OrderFlowFutures Discord. Join us, it's free.
Join the Discord for free7 online·76 members·Free · instant access