Volume profile: the POC does not pull price, and the value area can point at a rejected price
Published · updated · 17 min read
By Tom · Trader & founder of OrderFlowFutures
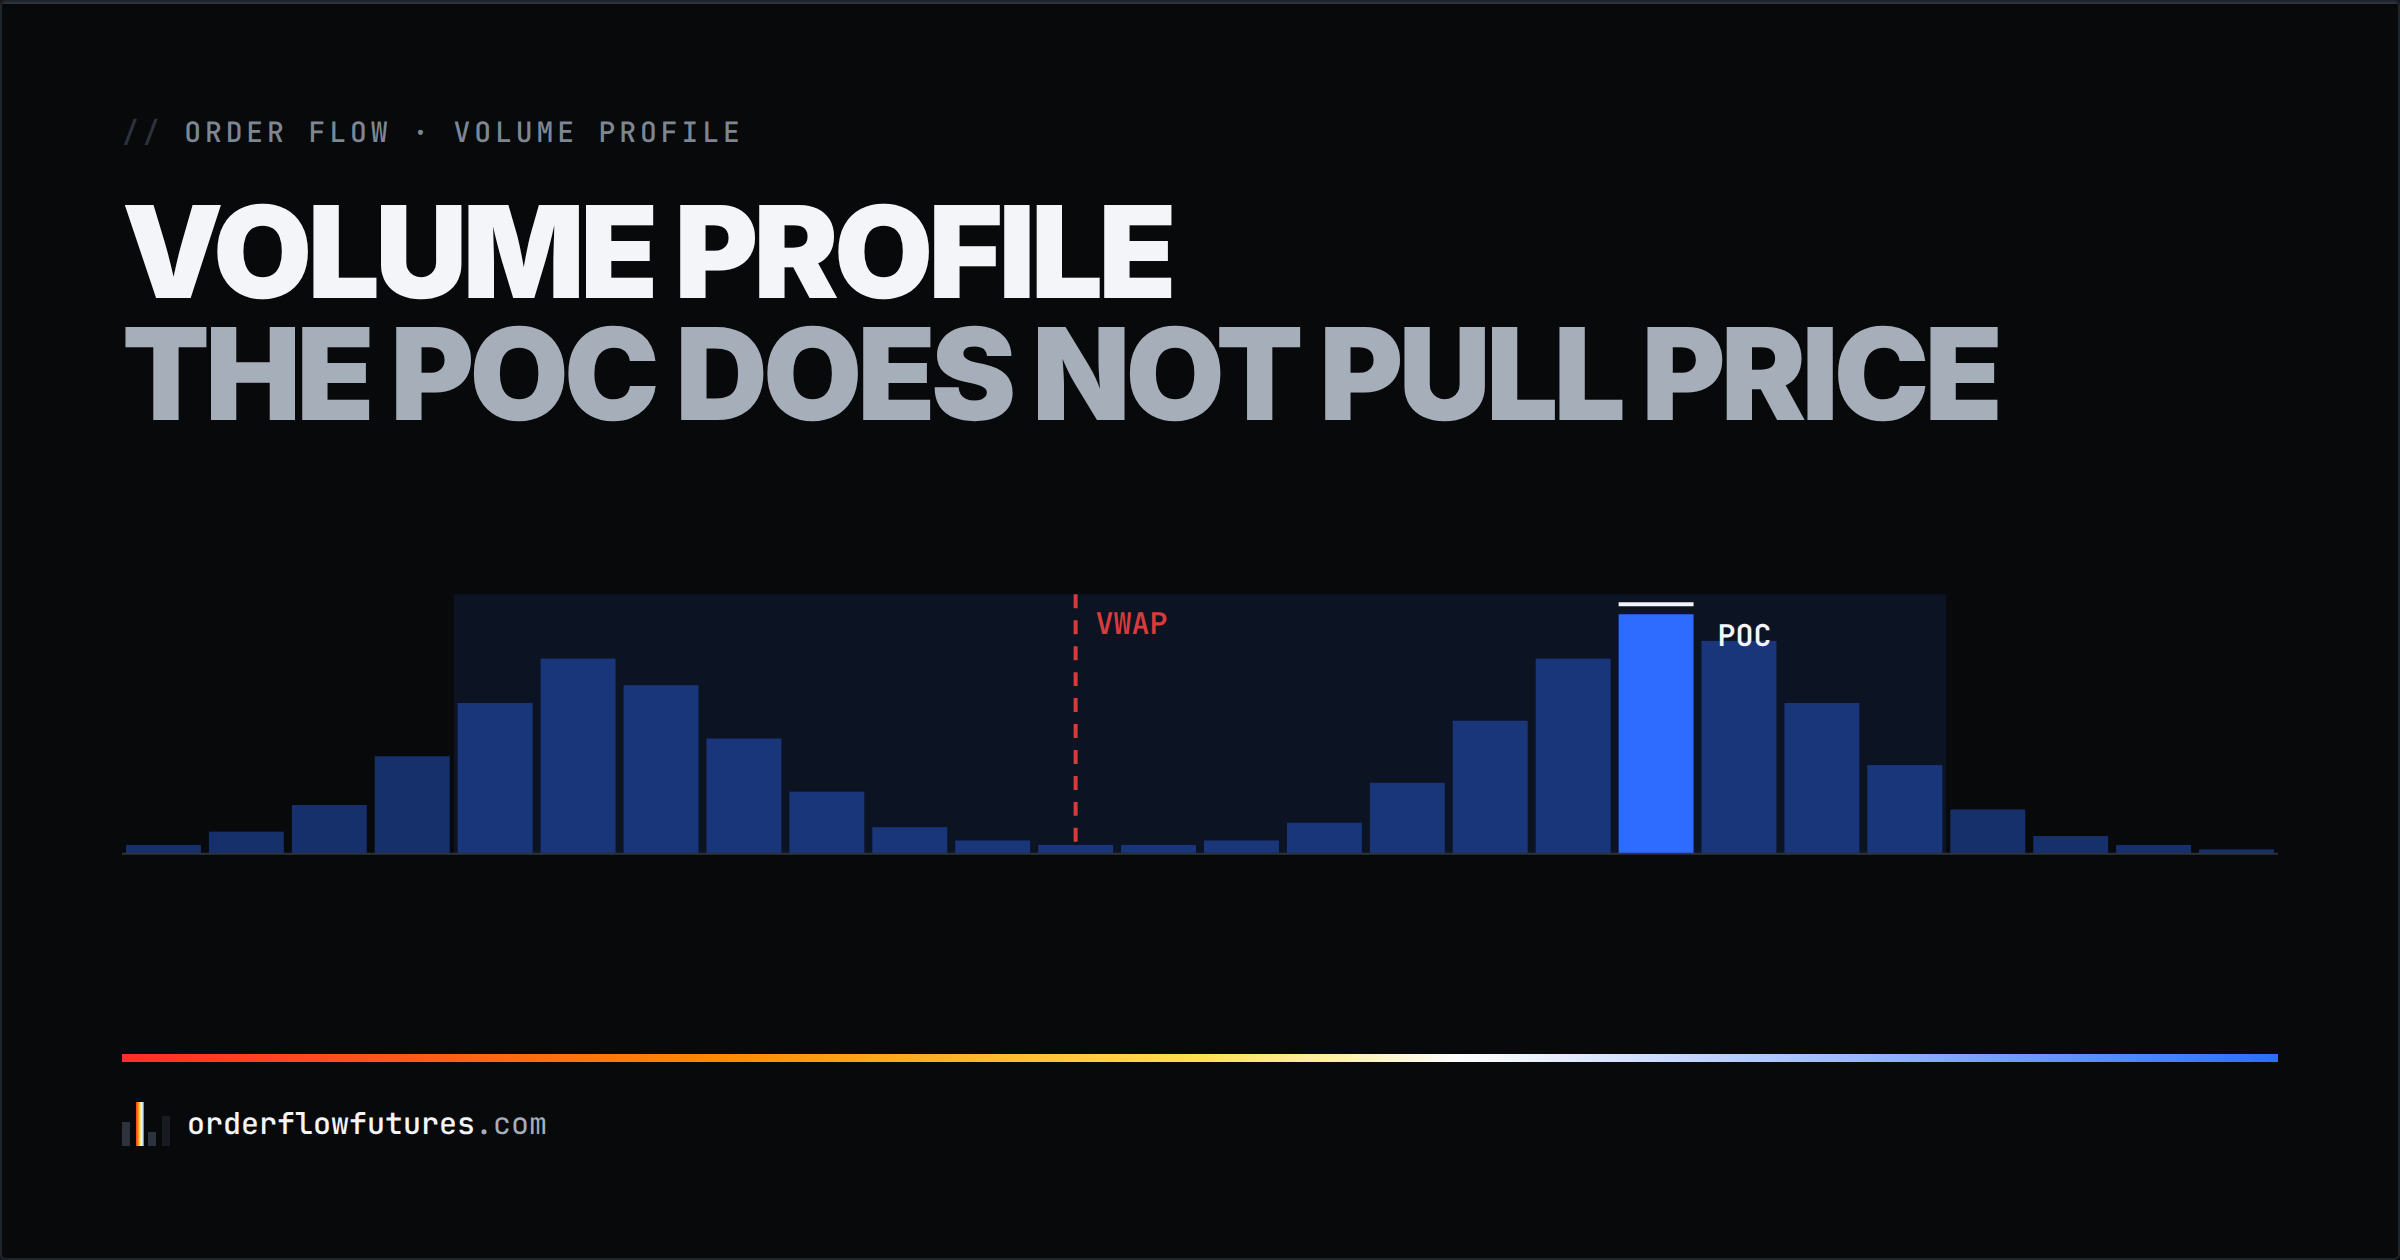
The POC, the value area and the famous 70% come from Market Profile, a 1980s tool that counted time rather than contracts. Carried over to a volume distribution, that framework becomes a reading convention you can edit in the settings. Why the POC records the past instead of pulling price, the case where the value area and VWAP both point at a price the market refused, and the four step routine that puts flow back at the centre.
Tuesday, on the NQ. Price opens forty points above yesterday's POC, drifts all morning, and at 15:10 comes back and settles on it to the tick. On the forums the verdict arrives in four words: the POC is a magnet. Next day, same setup, same distance to the POC, and price spends the whole session walking away from it without ever touching it again. Nobody posts about the second day, and that is the whole problem with the volume profile: the tool is excellent, the story told about it is not.
The POC, the value area and the famous 70% do not come from the volume profile. They come from Market Profile, a 1980s tool that counted time rather than contracts, and whose value area was defined as one standard deviation around the peak, by analogy with a bell curve. Carried over to a volume distribution, that framework stays useful but it changes status: it stops being a measurement and becomes a reading convention, one you can edit in the settings. And it produces a genuinely treacherous case, the double distribution session, where the value area straddles a band of prices the market refused and where VWAP lands right in it. A profile never tells you where price is going. It tells you where price has already been accepted, and that is the direction you have to read it in.
---
1. The framework was built on time, not on volume
The POC and the value area have an author and a date of birth. J. Peter Steidlmayer, a trader at the Chicago Board of Trade, developed Market Profile through the 1980s and the exchange released it publicly from 1985. The official CBOT manual is titled CBOT Market Profile: A Time Distribution Analysis that Explains Market Behavior (Chicago Board of Trade, 1984). The subtitle settles the argument on its own: a time distribution analysis.
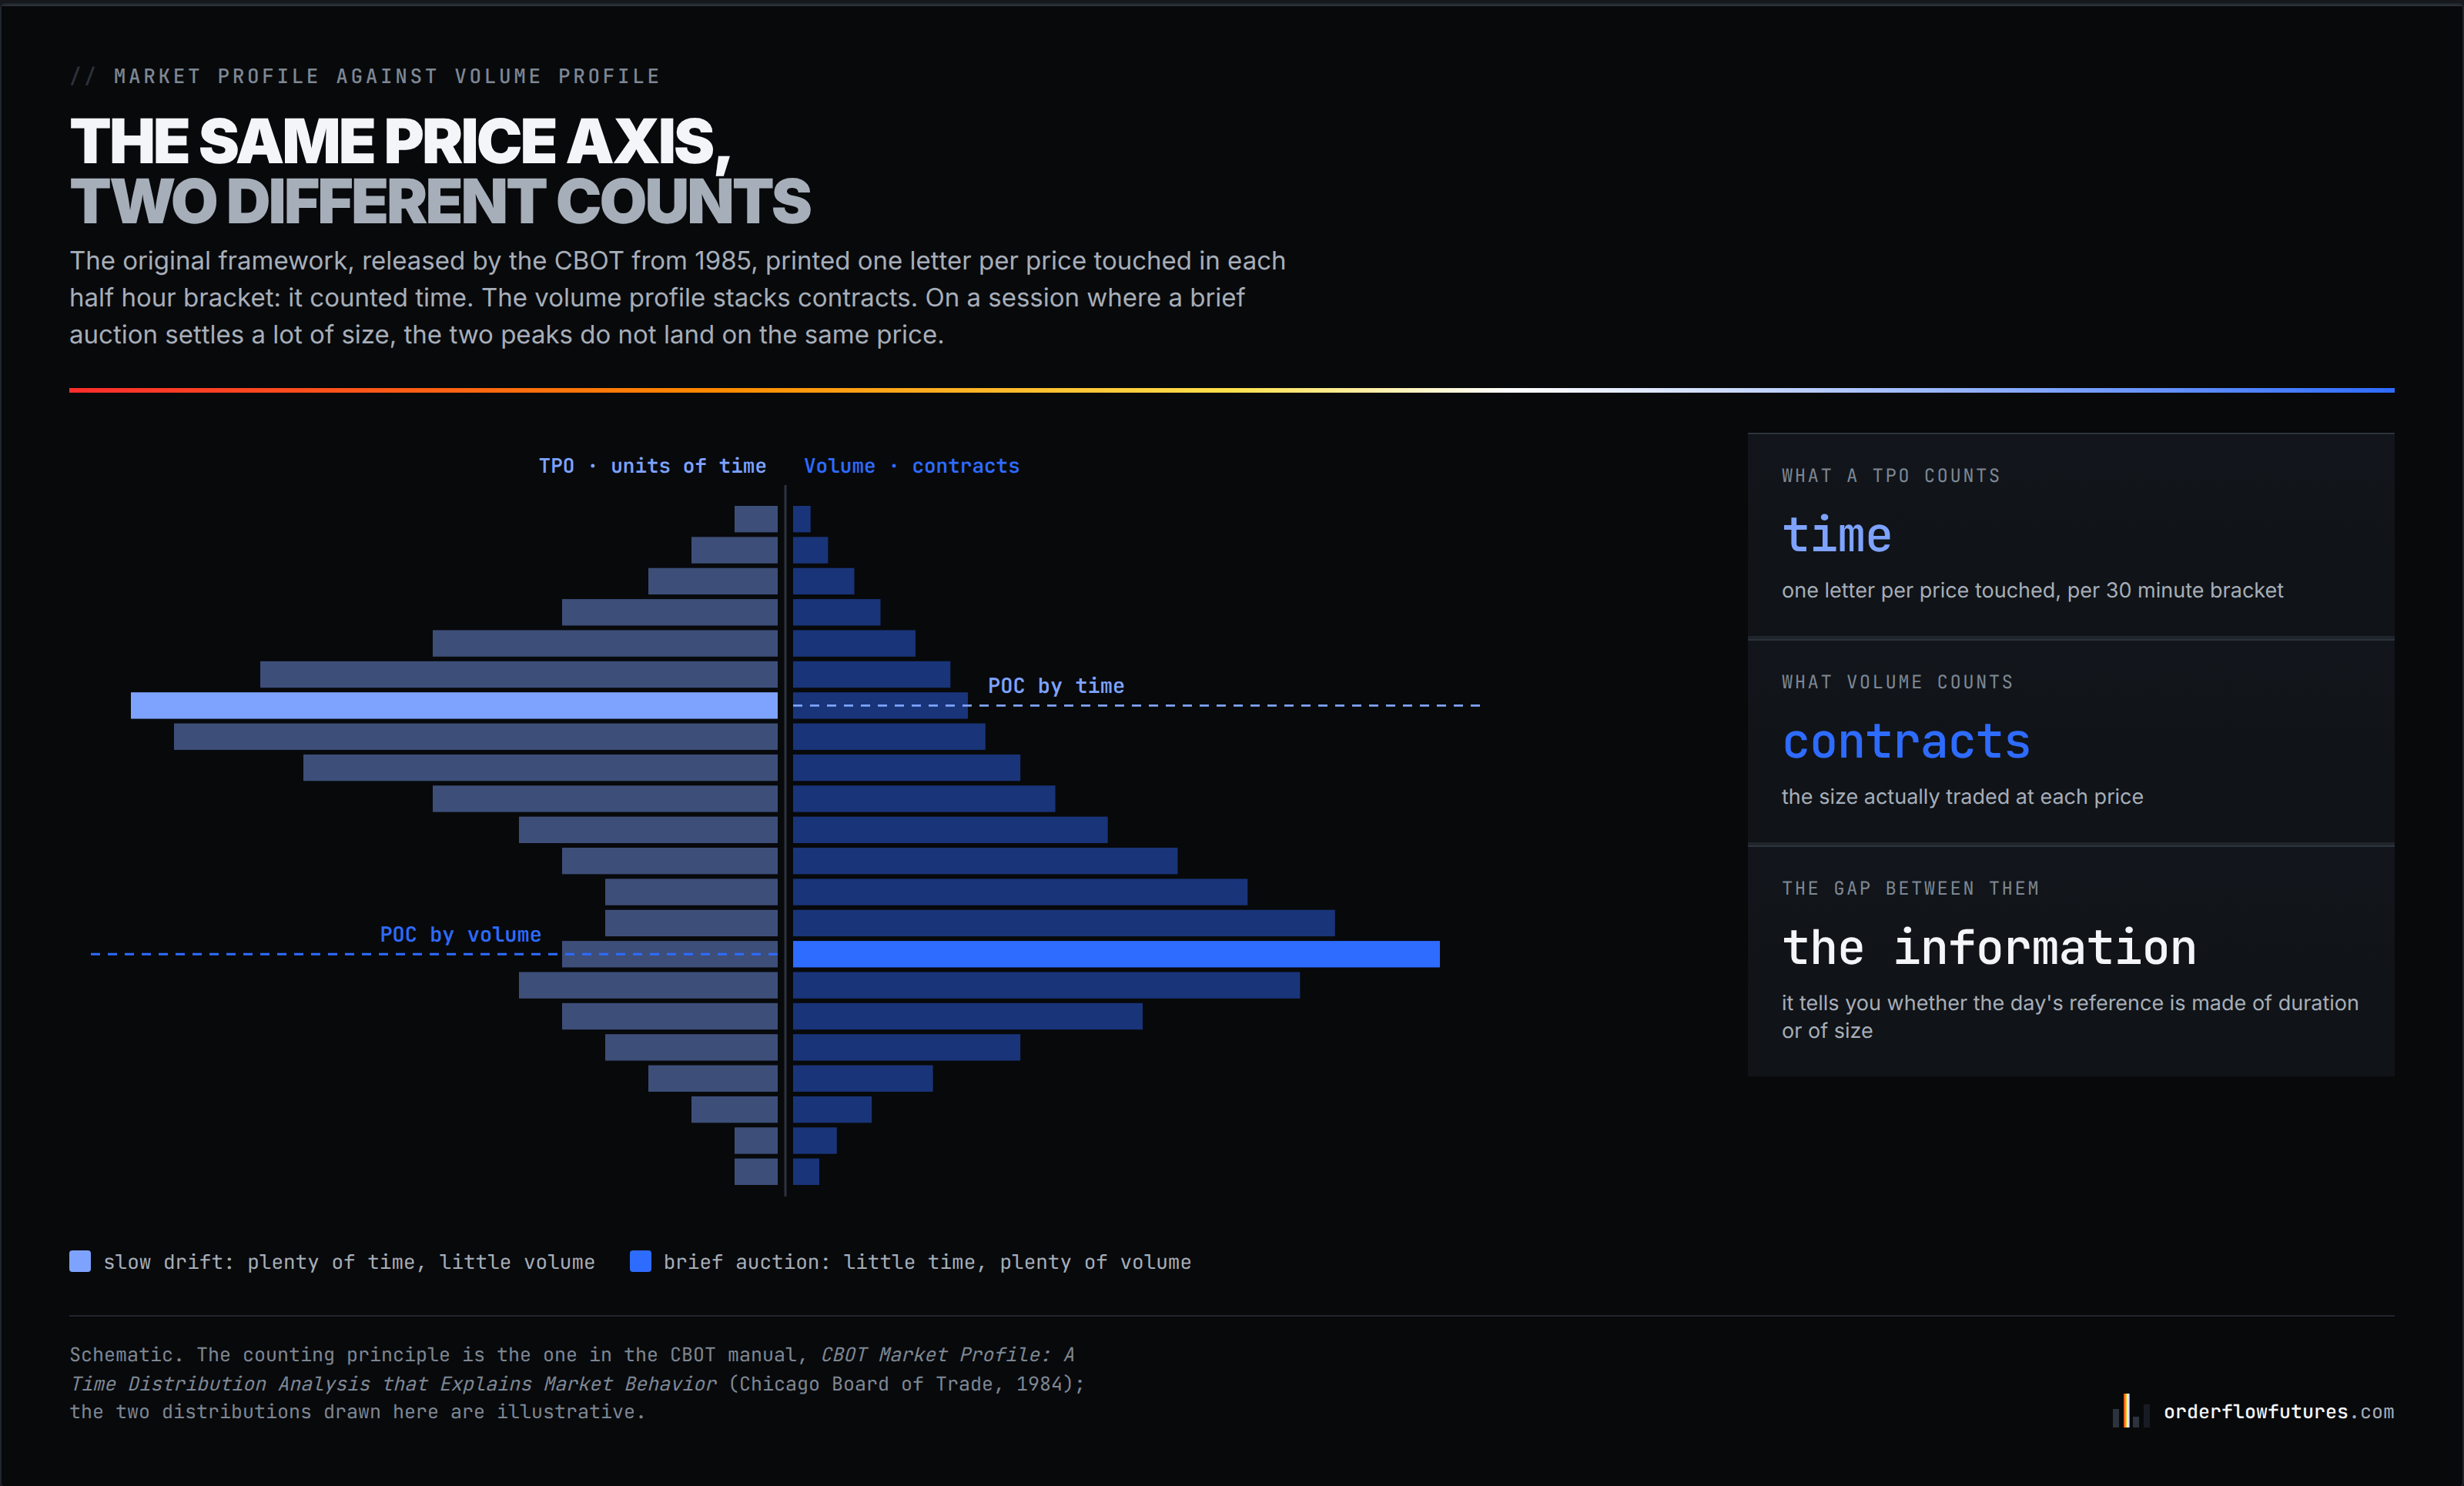
In practice, Market Profile split the session into half hour brackets and printed a letter at every price traded during the bracket. A price touched in five brackets collected five letters. Those letters are TPOs, time price opportunities, and the profile stacked units of time. The peak of that profile, the POC, marked the price where the market had spent the most time. Not the price where the most contracts changed hands.
The volume profile came later, once the data allowed it: same price axis, same horizontal histogram, but contracts stacked instead of letters. That is a clear improvement, because volume measures commitment where time only measures duration. What was never rebuilt, though, is the set of reading rules. Everything circulating today about the POC, the edges of value, acceptance and rejection was formulated and calibrated on a count of letters.
And the two counts do not say the same thing. A price the market drifts through slowly for an hour collects plenty of time and little volume. A price where a violent auction settles in four minutes collects little time and an enormous amount of volume. On a quiet session the TPO POC and the volume POC land in the same place; as soon as size concentrates, they separate, and the gap between them is the interesting part: it tells you whether the session's reference price was built by duration or by size. That is the first reason to look at a volume profile rather than copy rules written for a time profile.
---
2. The 70% is a setting, not a property of the market
The second piece of inheritance deserves a straight look. In the original framework, the value area covers the central 70% of activity around the POC, and that figure was not measured on markets: it was borrowed from the normal distribution, where one standard deviation either side of the mean holds roughly 68% of observations. The reference literature, starting with Mind Over Markets by Dalton, Jones and Dalton (Probus, 1991), passes the definition along in those terms. The value area is therefore, at source, a standard deviation approximation laid over a distribution assumed to be bell shaped.
Two things follow, and neither is a reason to throw the tool away.
First, an intraday distribution is almost never Gaussian. On a trending session it is skewed, or frankly twin peaked, and the standard deviation analogy no longer holds. Calling an interval built on that analogy the "value area" becomes loose language the moment the shape departs from the bell.
Second, and this one you can check in three clicks inside DeepCharts. In the Deep Profile Values panel, the value area is switched on through a setting called % Value Area, set to seventy by default, documented as such by the vendor. In other words you can decide that today's value covers 60% of the volume, or 80%, and your VAH and VAL move accordingly. A level that shifts when you change a parameter is not a market fact. It is a reading convention.
Where most people go wrong is in drawing the opposite conclusion from the right one. The conclusion is not "the value area is useless", it is "the value area draws its power from being shared". Thousands of participants watch a VAH and a VAL computed at 70%, because that has been the default in every piece of software for forty years. Those edges therefore concentrate real orders and produce real reactions. They work like a meeting point, not like a law of physics. Keep the default setting, precisely for that reason, and stop lending it statistical authority it does not have.
---
3. The POC records the past, it does not pull price
Here is the core of the misunderstanding, and it is logical before it is technical.
Volume accumulates at the prices where the market stays. The POC is, by construction, the price where it stayed the most. Saying afterwards that price "comes back to the POC" therefore amounts, in good part, to repeating that price spends time where it spends time. The causality retail commentary assigns to the level (the POC pulls price) is the reverse of the one that produced the level (price, by staying, produced the POC). A profile is a trace, like a footprint in snow, and a footprint does not attract the next step.
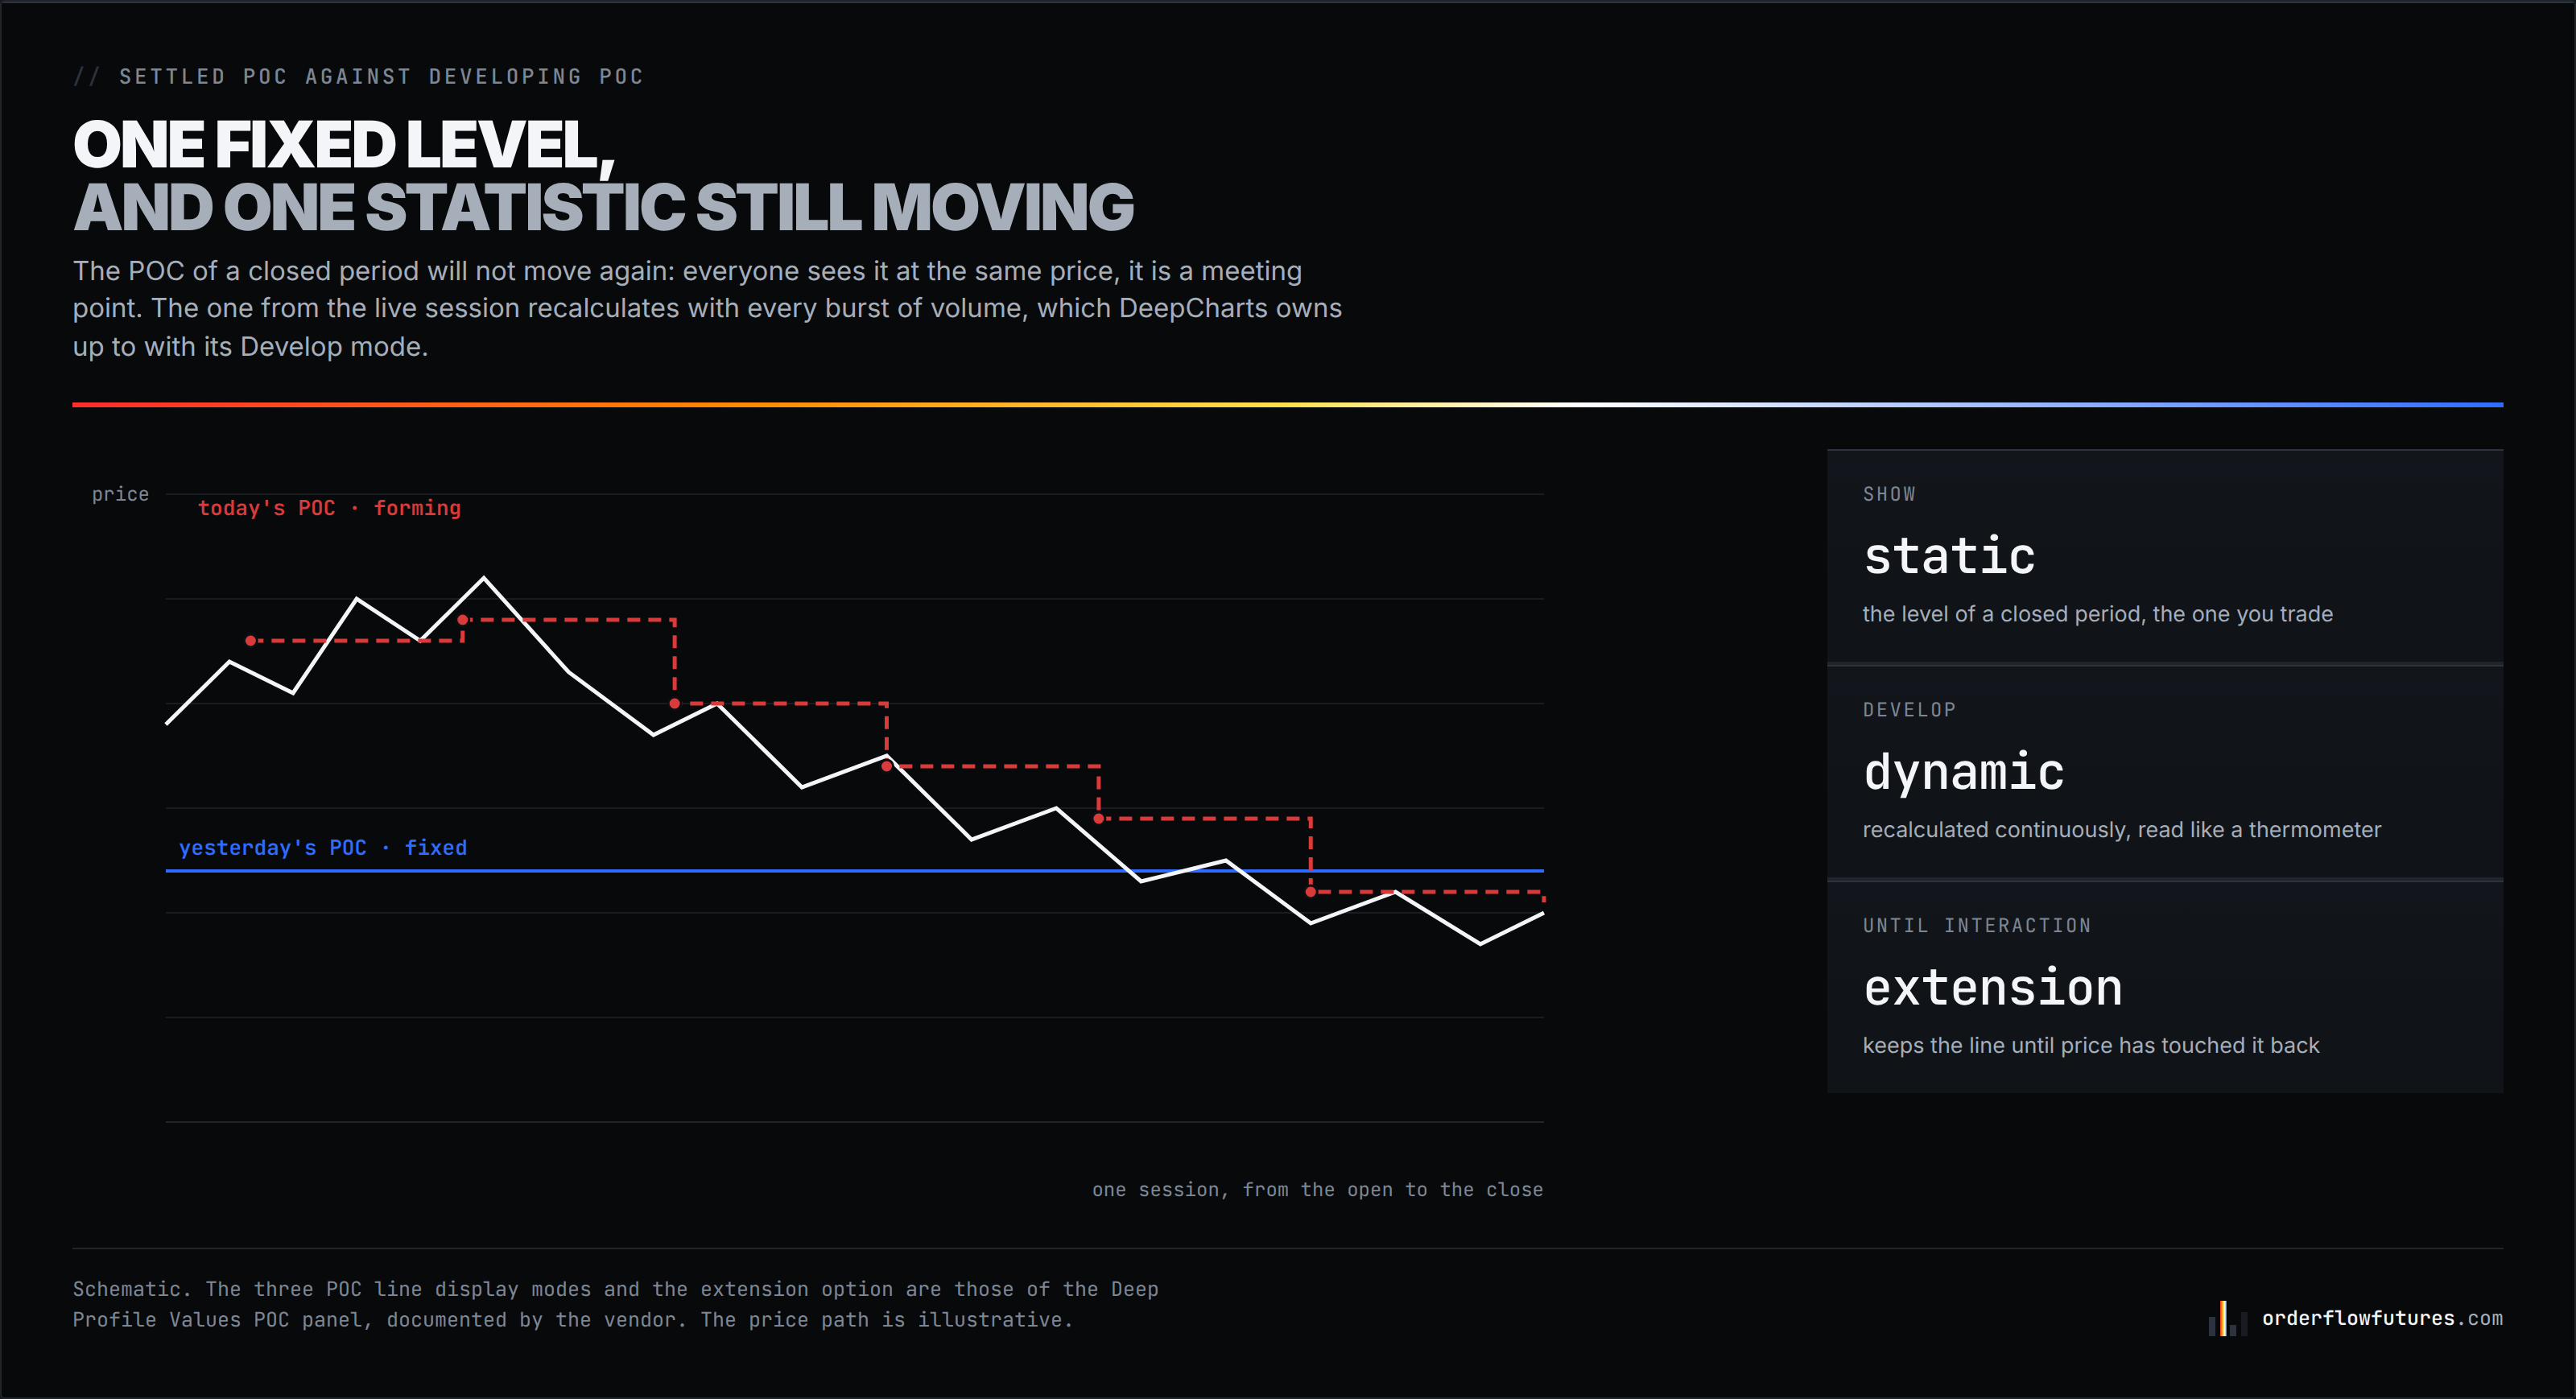
That inversion is not a philosopher's quibble. It has a direct consequence, and the tool itself gives it away. Still in Deep Profile Values, the POC panel offers three ways to show the line: Show for a static line, Develop for continuous dynamic recalculation, and Extended offset for a highlighted zone. The Develop mode exists because the current session's POC moves as the hours pass: every new burst of volume can change which price has traded most. The vendor's own tutorial warns about the symptom, a line that will not stop moving while you are trying to read a fixed level. A level that migrates during the move cannot be the cause of that move.
Hence the distinction missing from nearly all the available content on the subject, and the genuinely usable part of this section:
- The POC of a closed period (yesterday, last week) is fixed. It will not move again, everyone sees it at the same price, and that, and only that, is what makes it a solid reference.
- The POC of the live session is a statistic in the making. Reading it as a level means mistaking a moving average for support.
The first trades like a meeting point. The second is watched like a thermometer: it tells you where today's balance is forming, which is context, not an entry signal. It is also the point of the Until interaction extension option, which keeps the line visible until price has touched it back: it exists to make a still virgin level obvious at a glance, in other words a meeting that has not happened yet.
---
4. The treacherous case: when the value area points at a rejected price
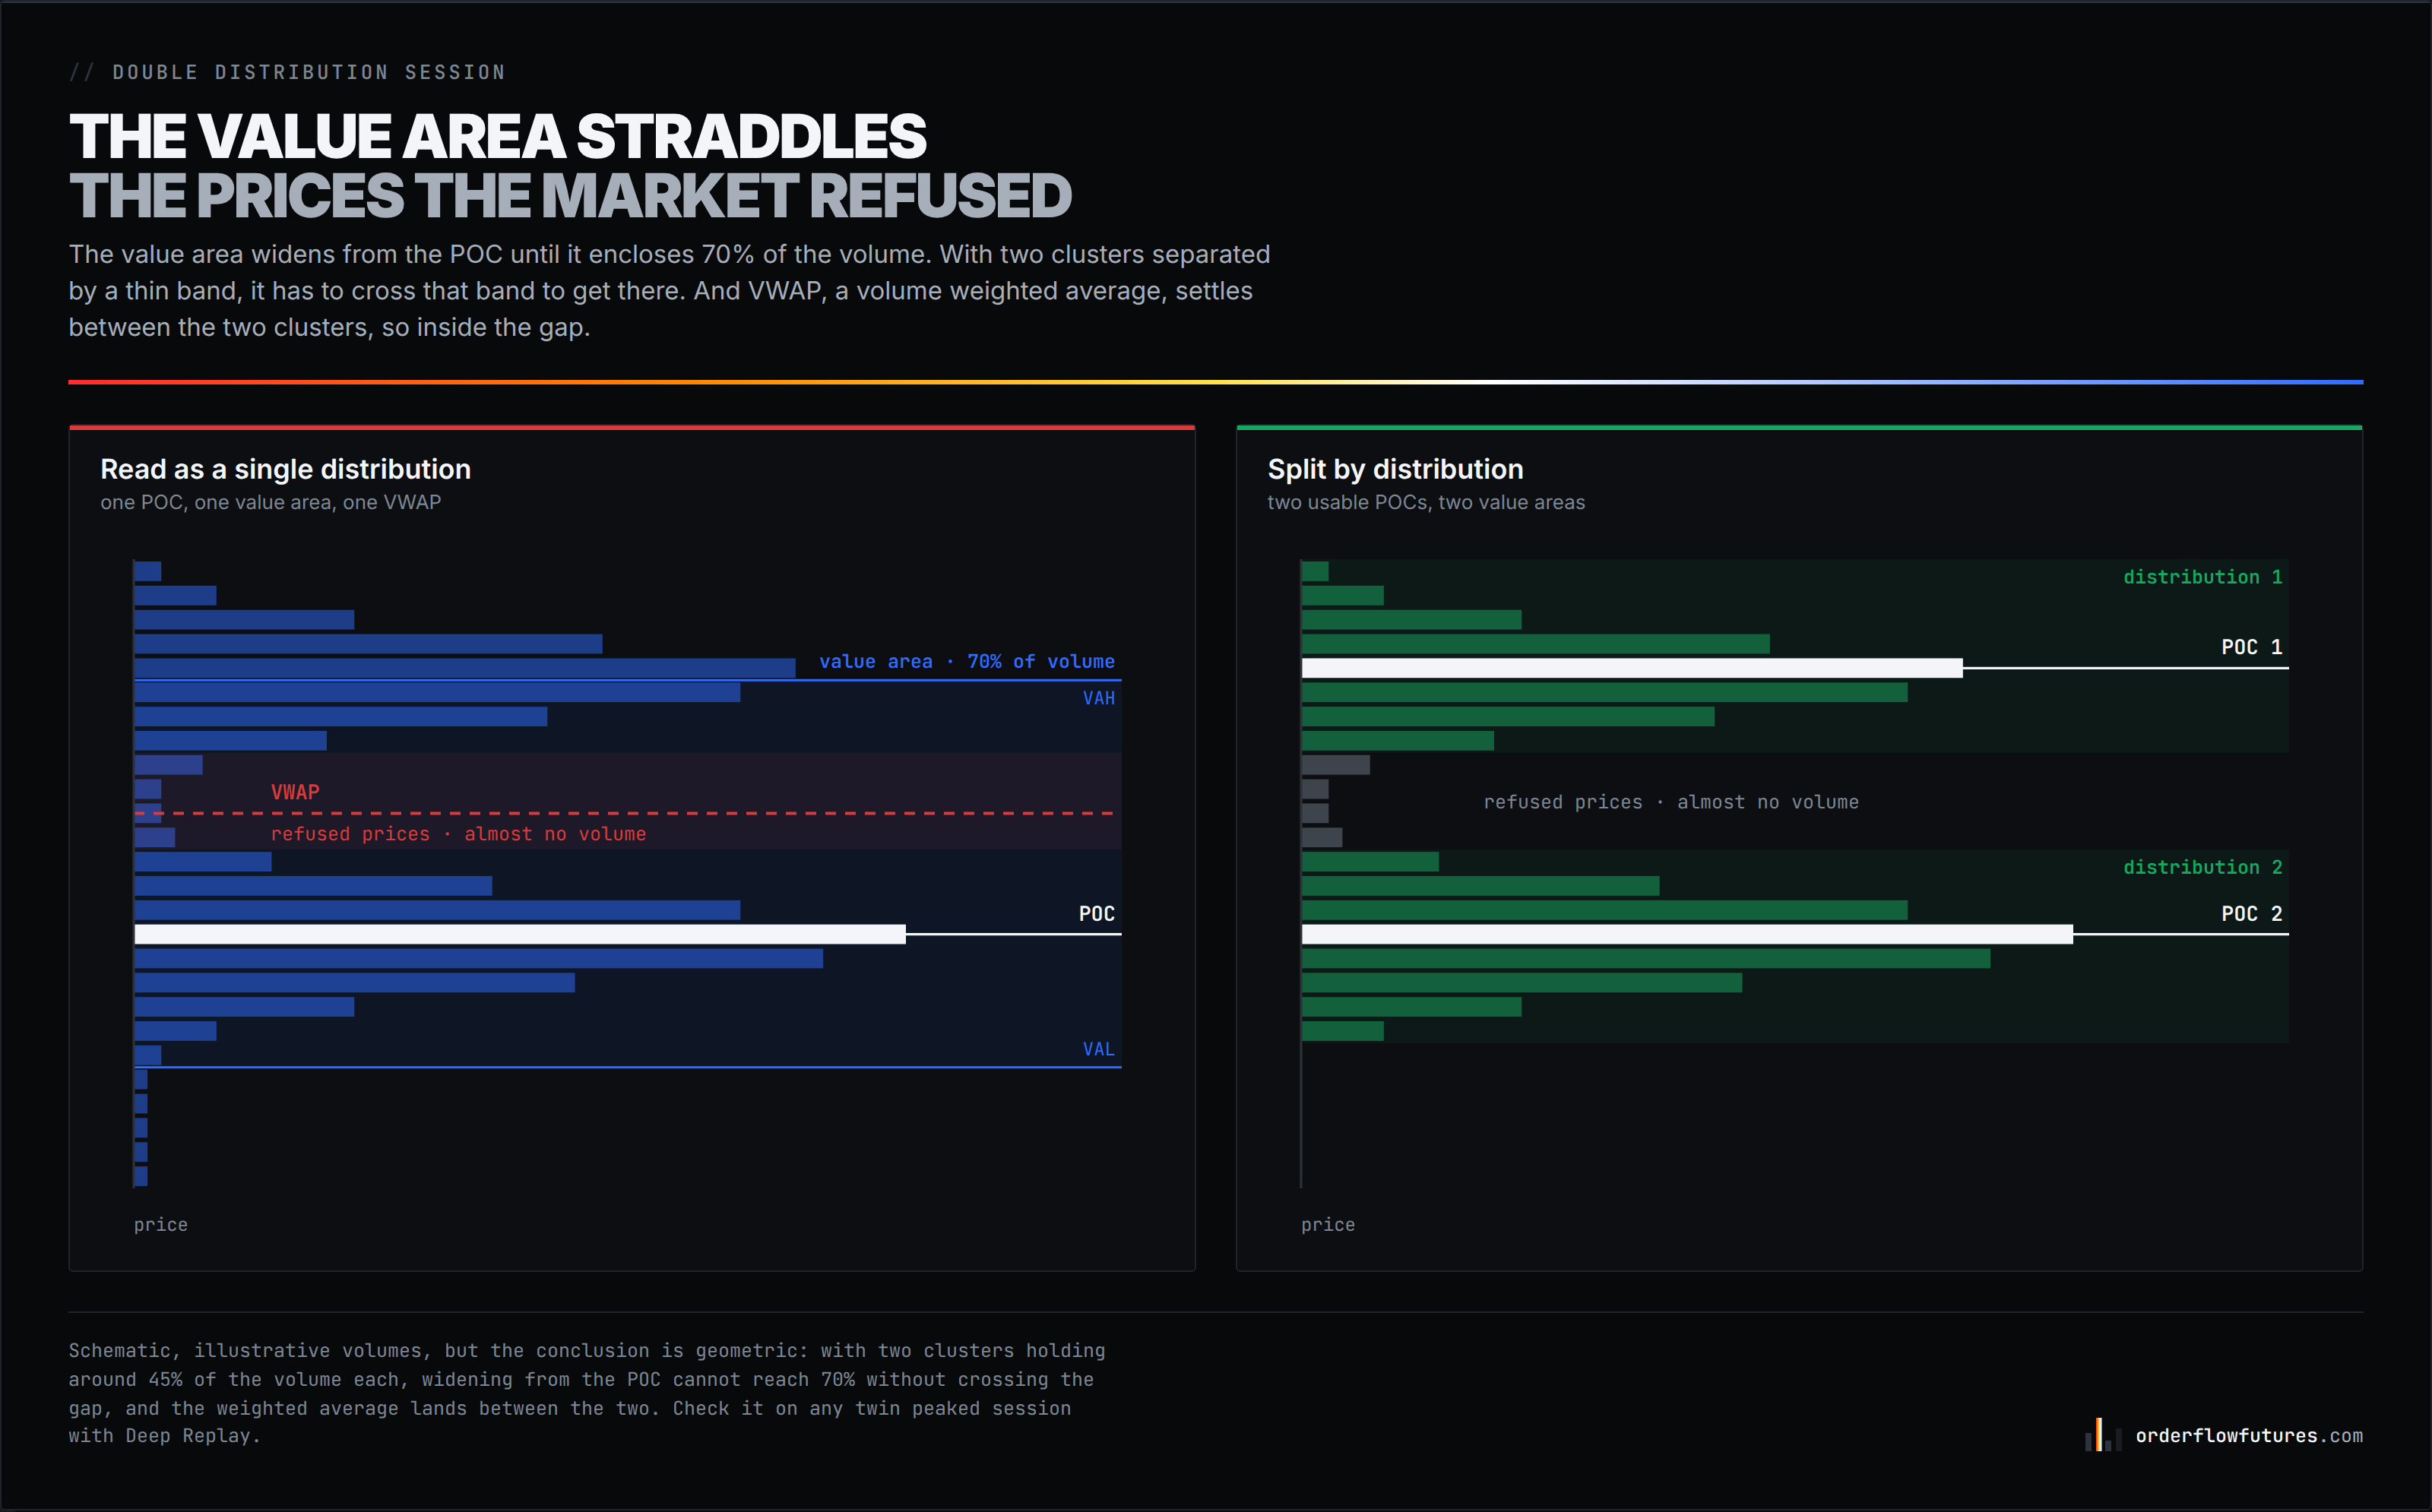
Now for the case that justifies understanding the mechanics on its own, because it turns the naive reading completely around. It has a name in the Market Profile taxonomy, the double distribution session, and it is common: the market balances in one range through the morning, breaks, then balances in a second range higher or lower. The finished profile has two humps separated by a thin band.
Watch what the framework does to that shape, following its definition strictly.
The value area is built by starting at the POC and widening either side until 70% of the volume is enclosed. If the two distributions hold something like 45% of the session's volume each, widening from the POC, which necessarily sits inside one of the two humps, cannot reach 70% without crossing the thin band and biting into the second hump. Geometric conclusion, no statistics required: the day's value area contains a band of prices where almost nothing traded, which is to say prices the market crossed without accepting.
VWAP does worse. Being the volume weighted average price, with two clusters of comparable weight it settles between them, so precisely in the gap. The two most quoted "value" references, the value area and VWAP, therefore both point that day at the least accepted zone of the session. The reflex "price will come back to value" is then naming a price we have evidence nobody wanted.
This is checkable, and I would rather you checked it than believed me: take any session whose profile has two humps, display the value area and VWAP, and look at where they land. Deep Replay runs the session back order by order, so you can even watch the moment price crossed the gap and see that it did so fast and left no volume behind.
Good practice fits in one line: read the shape before you read the levels. One hump, and the original framework works as designed, because the distribution finally looks like what it assumes. Two humps, and you have to stop treating the session as a single distribution and split it in two, each with its own POC and its own value area. That is exactly what Deep Profile Swing does by anchoring the profile to the move instead of the clock: a move does not begin at midnight, it begins when it begins, and a profile cut by calendar day imposes on the market a rhythm that is not its own.
---
5. The valleys carry more information than the peaks
The corollary deserves its own section, because it reverses the usual hierarchy. Everyone looks at the peaks, the volume nodes, and almost nobody at the valleys. In information terms, though, the asymmetry runs the other way.
A thick volume node tells you a fight took place at that price, between buyers and sellers who found each other in numbers. That is information about the past, and dense information: plenty of participants accepted those prices.
A valley, a low volume node, tells you the opposite and it is sharper: at that price, the market found almost nobody. It went through. That is not a level in the sense of a zone of orders, it is the trace of an absence of orders. And it is useful in two ways. A valley crossed quickly during a clean move tells the same story as the "little effort, big result" case described in the article on effort and result: price travelled a long way for almost nothing, so the move is fragile and validated nobody. And on a revisit, a valley is where price can move fast again, since there is no mechanical reason for resting orders to have appeared there since.
Careful not to claim more than the data allows, though. A valley is a fact about the past book. Nothing guarantees the present book is still empty there, and that is precisely the question a profile cannot answer by nature: it is historical. The liquidity heatmap is what answers it, in real time. The combination is the right one: the profile points at the thin band, the heatmap says whether it is still thin. Deep Profile Values plots peaks and valleys without drawing the full histogram, which makes that read practical on an already busy chart.
---
6. The reading rule: shape first, flow second
Everything above comes down to a four step routine, in this order, and the order matters.
One. Shape. Before reading a single level, check whether the profile has one hump or two. Five seconds. One hump, the classic framework applies. Two humps, split the session into two profiles and treat the overall value area and VWAP with suspicion, because they point at the gap.
Two. Closed or live. Sort your levels into two piles. POC, VAH and VAL from closed periods are shared meeting points and can be treated as references. Those of the live session are statistics in formation: you read them for context and you do not trade them as lines.
Three. The test. The profile says where, it never says whether. When price comes to test one of your levels, the decision belongs to the flow at that precise moment: the footprint shows who is aggressing, delta shows which way the balance leans, and absorption says whether resting size takes the hit or folds. A profile level with no flow confirmation at the moment of the test is nothing more than a line on a screen.
Four. Invalidation. If the flow shows nothing at the level, there is no trade. No downgraded trade, no entry "because the level matters". That step is what separates two months of results, and it is the only one that asks for discipline rather than settings.
The routine also explains why a volume profile is read above the flow and never on its own, which is the thread running through the order flow guide: it supplies the map, not the decision.
---
7. What DeepCharts does with it, tool by tool
The DeepCharts profile family looks redundant at first glance and turns logical once you know which question each tool handles.
Volume Profile and Deep Profile draw the distribution. What sets Deep Profile apart is offering four reads on the same price axis: total volume, ask against bid, delta, or delta and volume side by side. That is the move from a participation question (how much traded here) to a conviction question (by whom, and which way). A POC with flat delta and a POC with firmly negative delta do not describe the same session, and a volume histogram alone cannot tell them apart.
Deep Profile Values keeps the levels and drops the histogram: POC with its three display modes, value area with its % Value Area at seventy by default, VWAP with standard deviation bands, peaks and valleys, session filtering. It is the clean reading tool, the one that lets you run the routine without cluttering the chart.
Deep Profile Swing is the direct answer to the problem in section 4: it plots a profile per swing, with four swing detection methods, a swing VWAP and supply and demand zones. On a double distribution session it hands you the two POCs that a daily read crushes into one.
For confirmation at the moment of the test, the flow tools take over: the footprint for aggression price by price, Deep Delta for the swing in the balance, and Deep-M Effort to see whether committed volume produces displacement or exhausts itself in place. Finally Deep Replay lets you test the whole routine on past sessions before trying it live, which is by far the cheapest way to learn it.
Two things to know before you click. The platform runs on Windows: on a Mac it goes through Parallels Desktop, the setup the community uses. And the real cost is made of the licence, the data feed and MBO depth, which are not billed by the same party; up to date figures are checked and listed on the pricing page.
Activate DeepCharts →: promo code OFF comes already filled in: an extra 10% off every plan, monthly or yearly, on top of whatever discount DeepCharts is running. Not using the link? Enter OFF at the Payment step. Details and per-plan math: DeepCharts promo code.
---
8. Back to the two Tuesdays
Take the two sessions from the introduction again, with the framework in hand.
On the first day, the previous session's profile had a single hump, well centred, so the POC of that closed period was a real meeting point, seen at the same price by everybody. Price opened far above it, nobody validated the morning's high prices (little volume accumulating, a live POC sliding steadily lower), and the trip back to yesterday's POC was the path of least resistance towards the zone where counterparty actually existed. On arrival at the level the footprint showed absorption and delta flipped. The trade was not "the POC attracts", it was "there is no counterparty here, there is some down there, and when price gets there I check whether it shows up".
On the second day, the previous profile had two humps. The displayed POC sat in the upper one, the value area straddled the gap, and yesterday's VWAP fell inside it. Price never "returned to value" because the reference was naming a zone the market had already refused the day before. Split into two profiles, that same session gave two usable POCs, one of which did act as a reaction zone in the afternoon. Same tool, same settings, opposite read, and the only thing that changed was step one of the routine: having looked at the shape.
That is what this article is meant to buy you. A volume profile predicts nothing, and that is what makes it good: it gives you a map of what the market has accepted, and leaves you the job of checking, in the flow, what it is accepting now.
---
Frequently asked questions
Does the POC attract price?
No, and the causality actually runs the other way. The POC is the price where the market traded most, so where it stayed most: the level is produced by time spent, it does not produce it. The POC of a closed period stays a useful reference because many participants watch it at the same price, which makes it a meeting point rather than a magnet. The POC of the live session, by contrast, is still moving.
Why is the value area 70% of the volume?
Because the original framework, the CBOT's Market Profile, borrowed the figure from the normal distribution, where one standard deviation around the mean holds about 68% of observations. It was not a measurement taken on futures markets, and the percentage is in fact a setting in DeepCharts (% Value Area, seventy by default). Keep the default, not because it is true, but because it is shared by every other screen.
Volume profile or Market Profile: what is the difference?
Market Profile counts time: it prints a letter, a TPO, at every price touched during a half hour bracket. The volume profile counts contracts in the same place. The two look alike on a quiet session and separate as soon as a violent auction settles a lot of volume in very little time. The gap between them tells you whether the reference price was built by duration or by size.
Can the value area point at a price the market rejected?
Yes, on a double distribution session. The value area widens from the POC until it covers 70% of the volume; with two volume clusters separated by a thin band, it has to cross that band to get there. So it encloses prices that barely traded, and VWAP, being a weighted average, lands between the two clusters, which is inside the gap. Hence the rule: read the shape of the profile before its levels.
What is a low volume node for?
A valley marks a price the market crossed without finding counterparty: it is the trace of an absence of orders, not of a zone of orders. On a revisit, price can move through it fast again, since there is no reason for resting orders to have appeared. Confirm it against the present book with a liquidity heatmap, since the profile only ever describes the past book.
Latest decoded trading sessions
A real trading day read live on the heatmap and the footprint: macro events, the levels that held, and every read with its DeepCharts screenshot.
- ESWednesday, November 18, 2026S&P 500 (ES) Midday Macro Review, Nov 18, 2026: Nvidia Reassures, Fed Minutes Tonight
- FDAXWednesday, November 18, 2026DAX: Nvidia Isn’t Enough as FDAX Awaits Fed Minutes and Euro Area Inflation
- NQWednesday, November 18, 2026Nasdaq 100: Nvidia Lifts NQ Ahead of Fed Minutes and the Anthropic IPO
Want to get better at order flow?
We discuss flow, liquidity and our trades live, every day, on the OrderFlowFutures Discord. Join us, it's free.
Join the Discord for free13 online·125 members·Free · instant access
Read next
Get the new guides
One email when we publish an OrderFlow or Heatmap guide. No spam, one-click unsubscribe.
By subscribing, you agree to receive our emails. Educational content, not investment advice.