Published
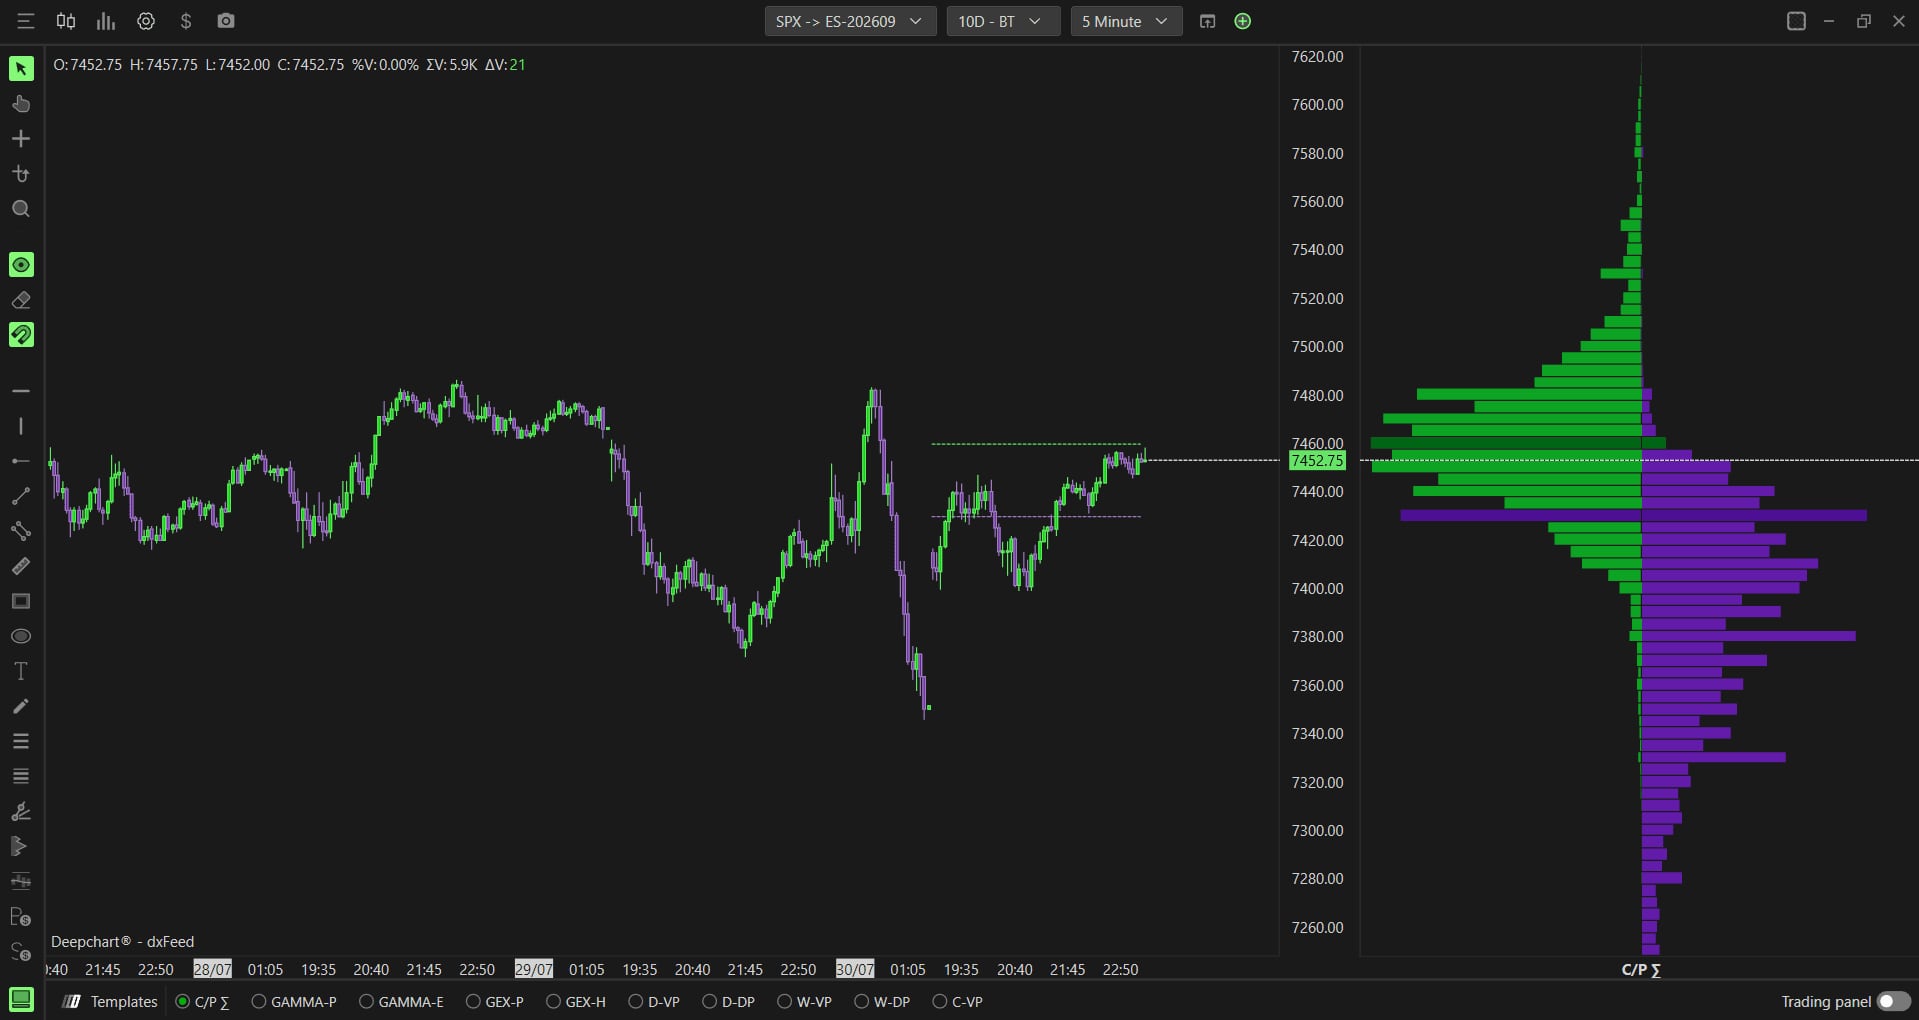
Option Profile shows options activity by strike price on a dedicated chart: a green bar on the left for each strike's call volume, a purple bar on the right for put volume. A heavy concentration at one strike, an option wall, flags a level that can act as resistance on the call side or support on the put side. The indicator is only available on NDX, QQQ, SPY and SPX.
- A subscription that includes the DeepGamma module (option flow)
- An Option Chart opened on NDX, QQQ, SPY or SPX, the only instruments covered
Step by step
- 01
Add the indicator from Option Chart
From the New menu, pick Option Chart, then the instrument: NQ-CME to track NDX or QQQ, ES-CME to track SPX or SPY. Then open Indicator Add, search for Option Profile and add it to the chart with the + button.
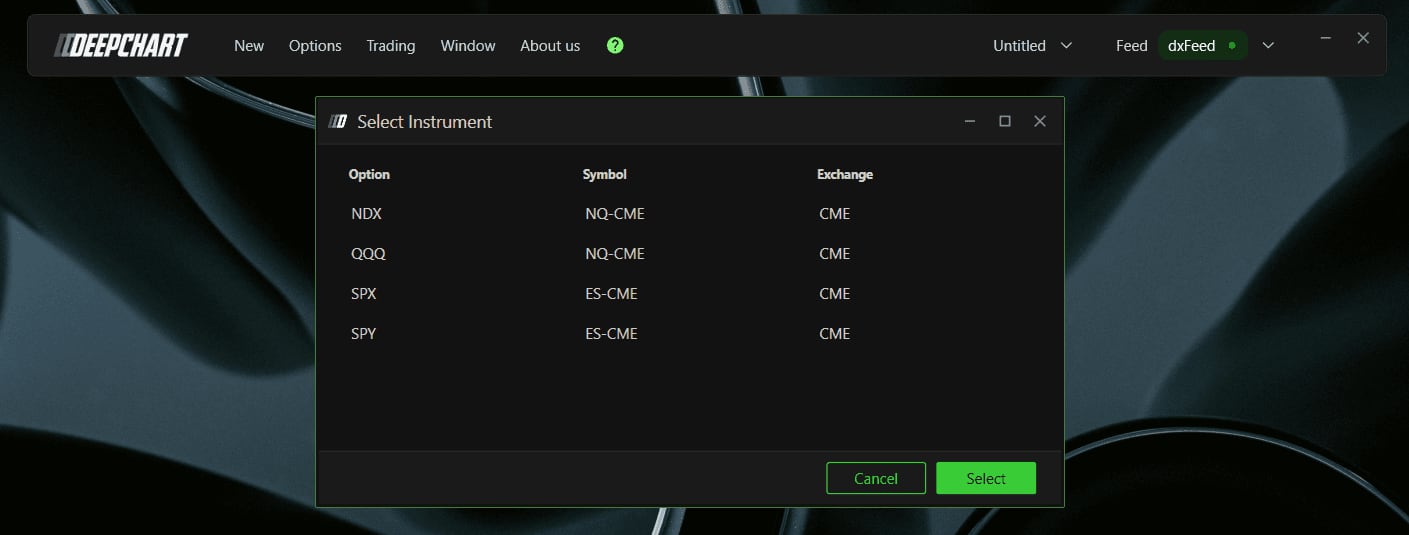
The New menu with Option Chart, and the instrument selection dialog.© DeepCharts - 02
Or load the quick template
A shortcut exists so you do not have to go through Indicator Add every time: the C/P Σ button in the templates bar, at the bottom of the window, instantly loads Option Profile with its previous settings. Right clicking that tab opens Settings directly.

The templates bar with the C/P Σ button and its right click Settings menu.© DeepCharts - 03
Set the General tab
Data source chooses between Volume, the raw activity at each strike, and Gamma volume, that same volume weighted by each option's gamma. Expiration filters by maturity, from a specific DTE (0 DTE on the capture) up to All expirations for every maturity combined. Include Carry or Open Interest, disabled by default, adds prior open interest to the calculation instead of only the day's volume.
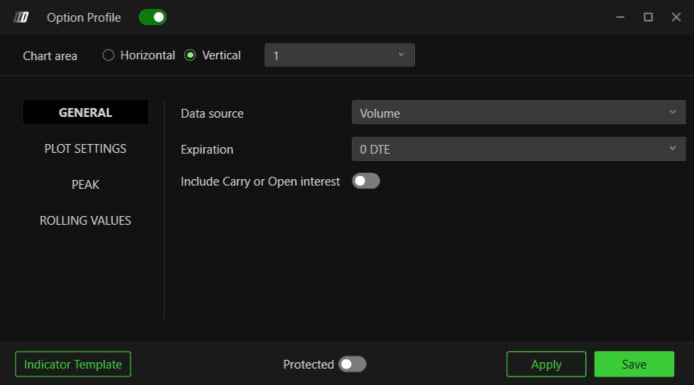
The General tab with Data source, Expiration and Include Carry or Open Interest.© DeepCharts - 04
Set the Plot Settings
The Width/Offset section sets Width type (Automatic by default), then, when width is not automatic, Current Width and Current Offset for the current session, Previous Width and Previous Offset for prior sessions. The Visual Appearance section sets Number of profile, five by default, how many sessions display at once, Vbp opacity, ninety by default, the bars' transparency, and Visual style, Solid by default.
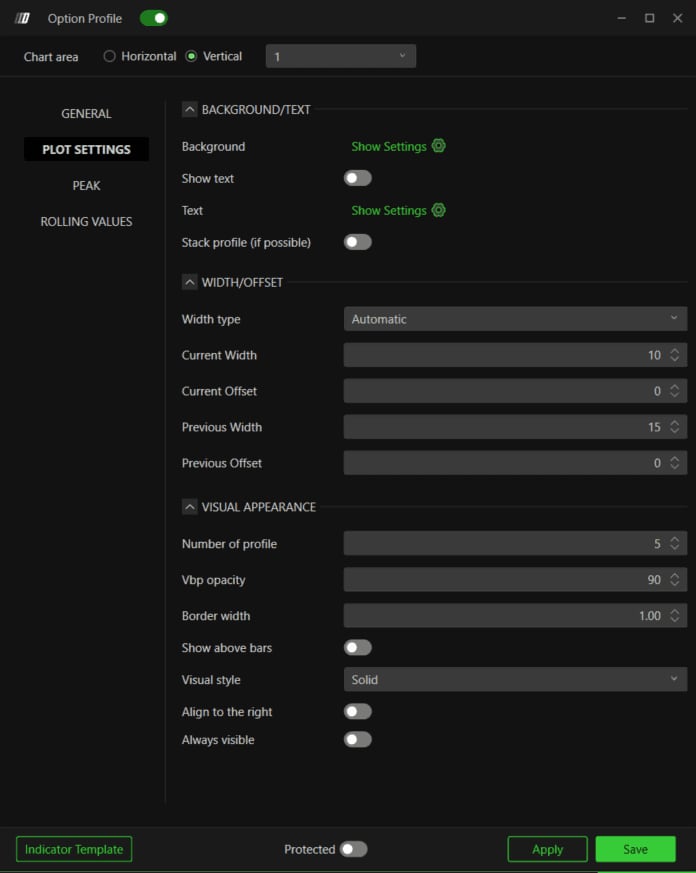
The Width/Offset and Visual Appearance sections of the Plot Settings tab.© DeepCharts - 05
Set the Call and Put peaks
The Peak tab groups two mirrored sections, Positive on the call side and Negative on the put side: Show Line draws a horizontal line at each side's most concentrated strike, green for calls and purple for puts by default, with Line Width and Line Style for its thickness and stroke style. Highlight, enabled by default, additionally colors the bar itself. These dashed lines work as a quick reference without having to read the whole profile again.
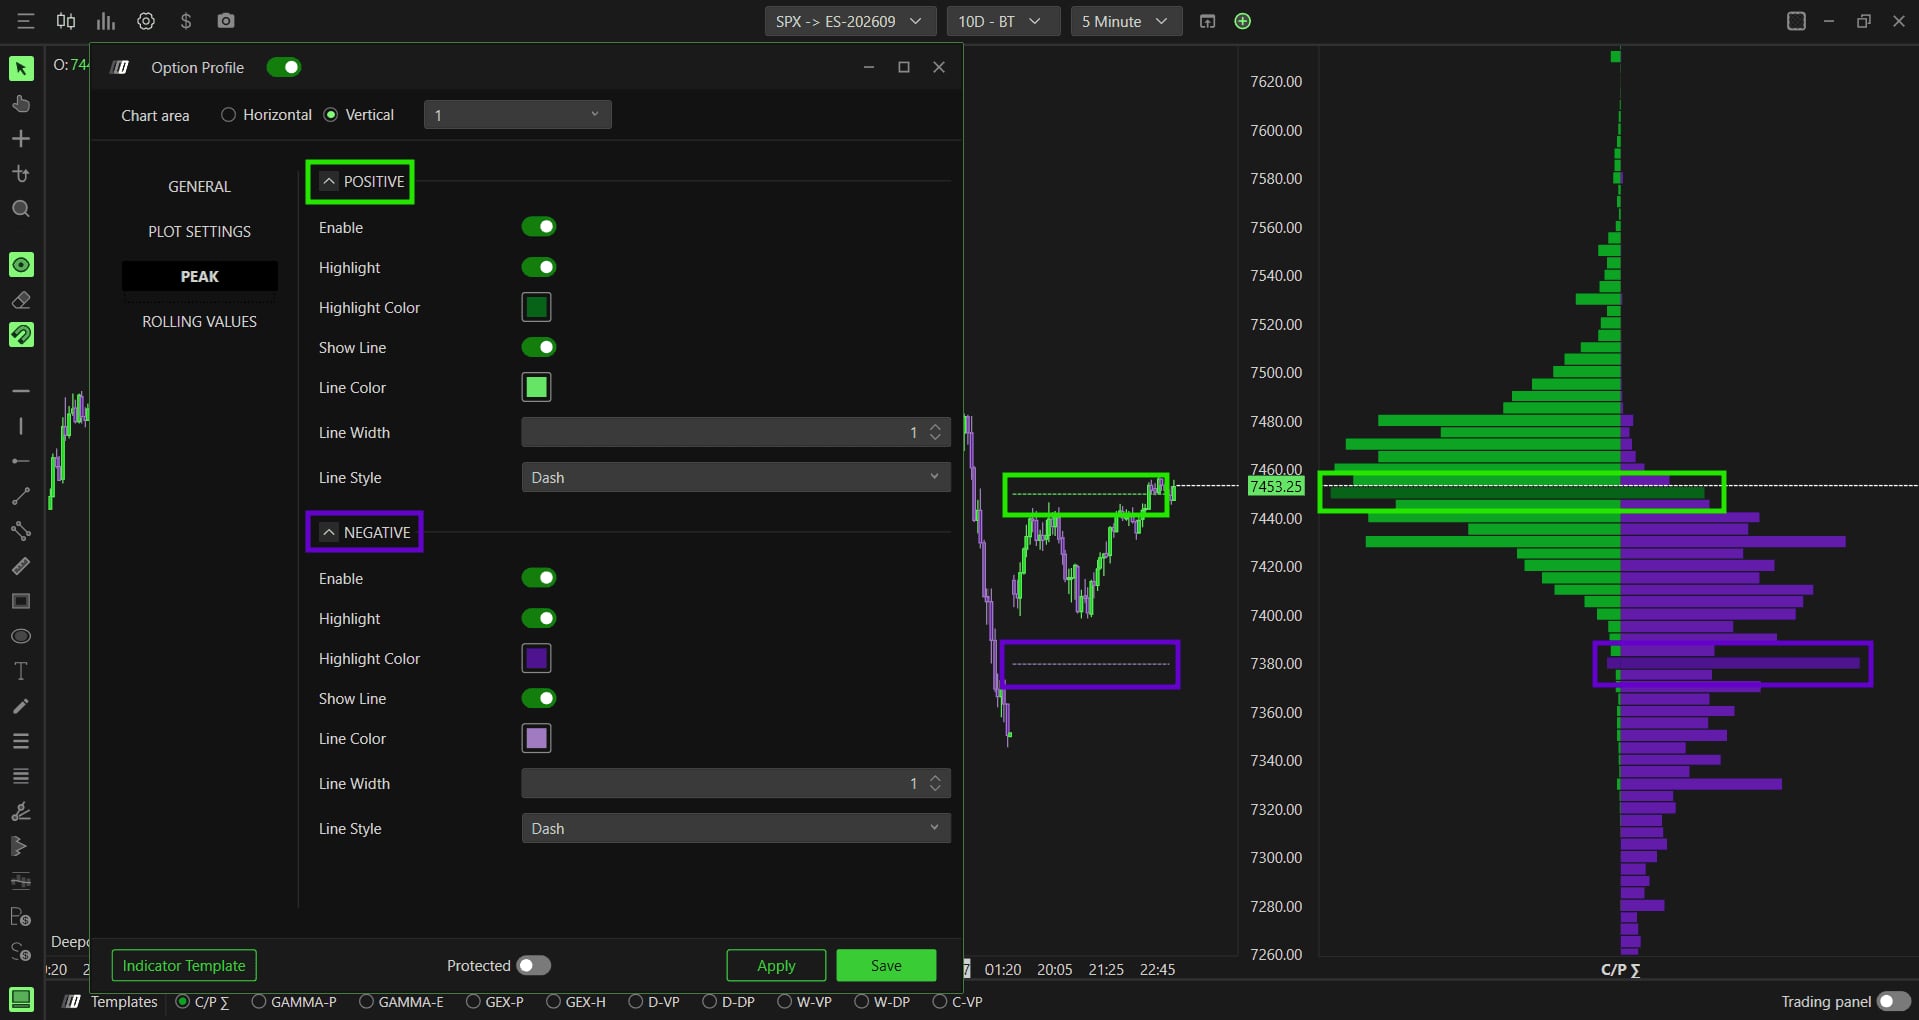
The Positive and Negative sections of the Peak tab, with Show Line and Highlight.© DeepCharts
Settings, tab by tab
Raw volume or weighted by each option's gamma.
Filters the profile by option maturity.
Adds prior open interest to the calculation.
Method used to compute the bar width.
Width and offset of the current session.
Width and offset of the prior sessions shown.
Number of sessions displayed at once.
Bar opacity, from 0 to 100.
Solid or a hollow variant.
Additionally colors the bar itself, on top of the line.
Horizontal line at the most concentrated strike on the call side.
Additionally colors the bar itself, on top of the line.
Horizontal line at the most concentrated strike on the put side.
Same options as Peak Positive.
⚠ Traps to avoid
- Looking for Option Profile on an instrument other than NDX, QQQ, SPY or SPX. The indicator is only available on those four, and that is not a configuration problem to solve in the settings.
- Confusing Data source Volume and Gamma volume. Volume shows raw activity at each strike, Gamma volume weighs it by each option's gamma: two different reads of the same strikes, not two ways of displaying the same thing.
- Relying only on bar height without turning on Show Line. The Peak lines exist precisely to give a quick reference on each side's dominant strike, without having to compare every bar in the profile by eye.
Related tool
FAQ
Which instruments does Option Profile work on?+
Only NDX, QQQ, SPY and SPX for now. On any other instrument the indicator will not display, no matter what settings are tried.
How should I read a big green or purple bar?+
A large green bar marks a call wall, a potential resistance if price rises toward that level. A large purple bar marks a put wall, a potential support if price falls toward that level. Price stuck between the two tends to trade in a balanced range, with an oscillation more likely than a clean break.
Is there a shortcut to load Option Profile without going through Indicator Add every time?+
Yes, the C/P Σ button in the templates bar loads it instantly with the last settings used, and right clicking it opens Settings directly to change them.
Want to get better at order flow?
We discuss flow, liquidity and our trades live, every day, on the OrderFlowFutures Discord. Join us, it's free.
Join the Discord for free5 online·38 members·Free · instant access