Updated · first published
What is Deep Trades?
Not every execution carries the same weight: a 200-lot print doesn't mean the same thing as a handful of retail trades. Spotting large activity, the players who actually move the market, is at the heart of reading order flow.
What DeepCharts does better
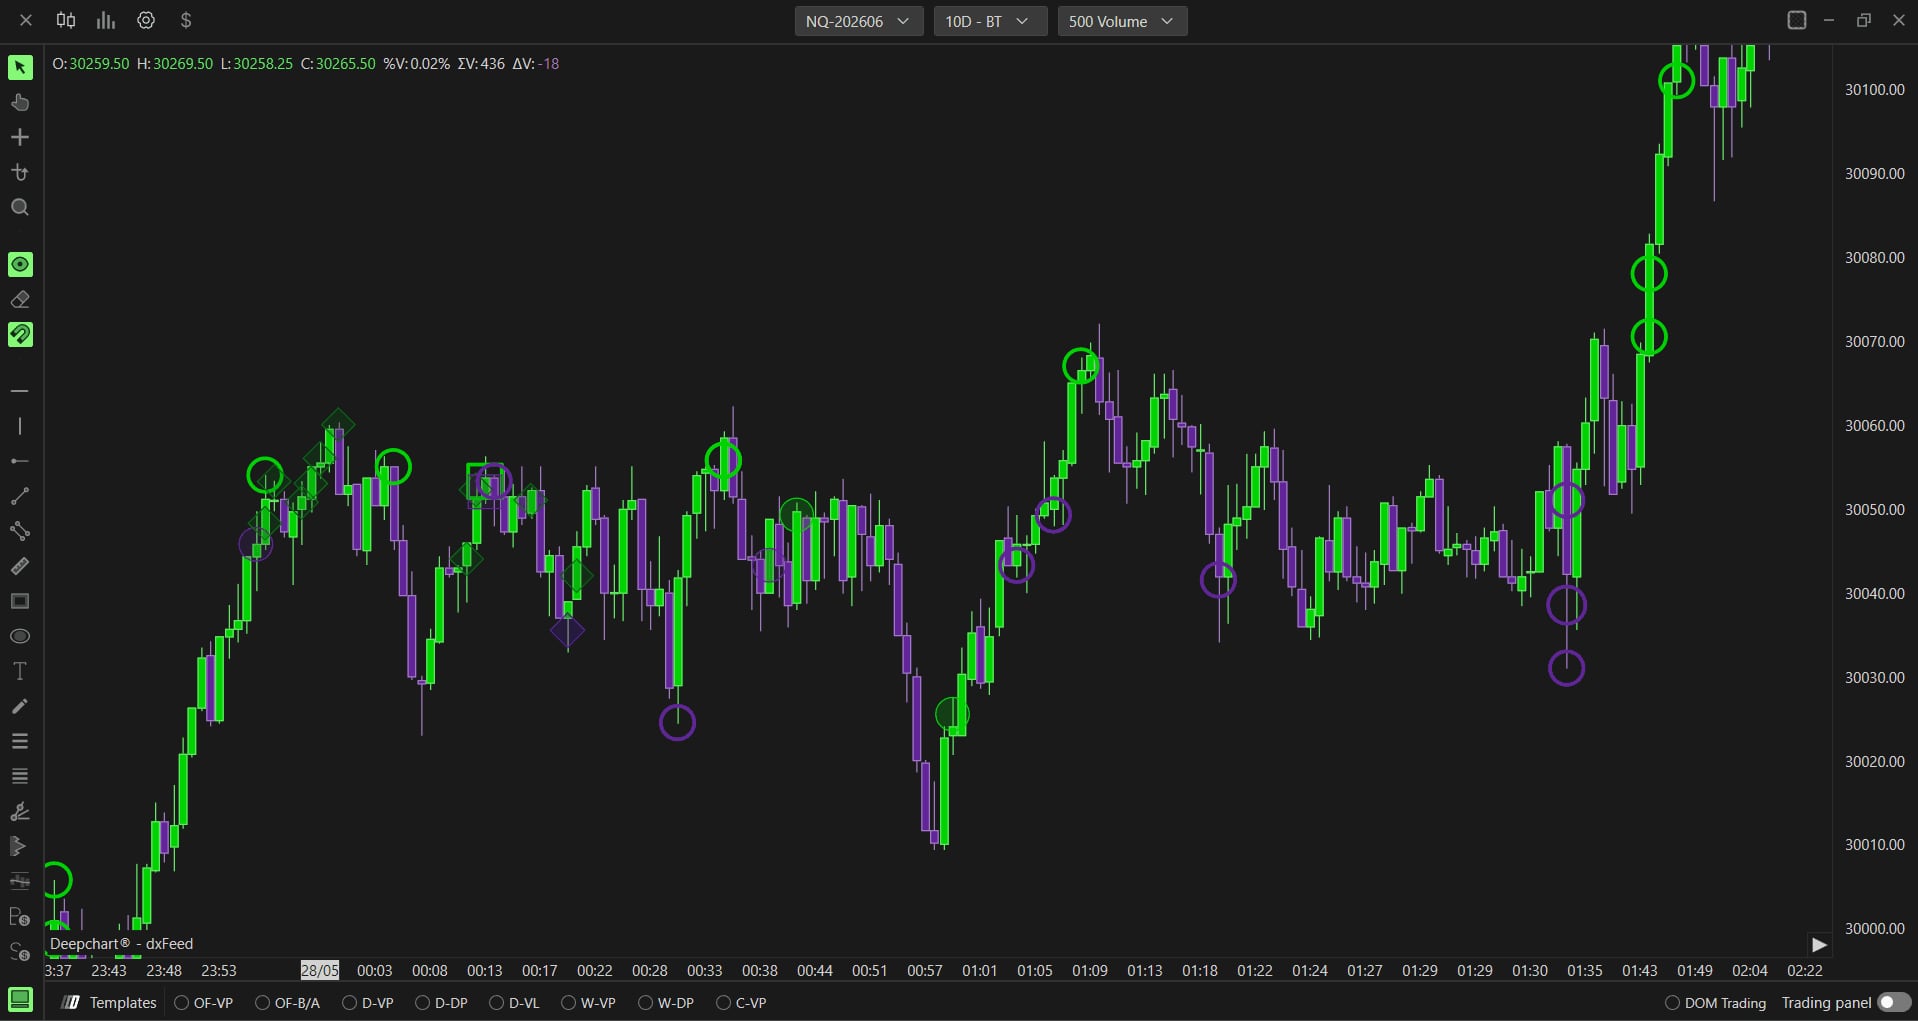
Deep Trades (introduced in v15.6) uses MBO data to isolate large activity and classify it directly on the chart via four symbol types (open circle, filled circle, square, diamond). That fine classification requires tracking each order individually: it's out of reach for the aggregated data many tools display.
Using it day to day
Day to day, let it mark large activity and watch where the symbols cluster. It's most meaningful on liquid institutional futures, NQ, ES, FDAX, Bund, where large activity is frequent and significant.
Example: a knot of large symbols appears at an ES low, against a liquidity wall visible on the heatmap. Price fails to break and bounces: big buyers came to absorb the decline. The Deep Trades cluster materialized an institutional entry live.
⚠ The trap to avoid
The trap: following every big trade as a directional signal. A large execution can be an initiation (price follows) or an absorption (price stalls). It's how price reacts around the trade, not its size alone, that gives the direction.
Combine it with
Combine it with the heatmap (the wall receiving the large activity), the footprint and delta: Deep Trades tells who's hitting hard, the others tell whether the level holds.
FAQ
What is the Deep Trades indicator?+
A DeepCharts indicator (v15.6) based on MBO data that isolates and classifies large market activity on the chart, via four symbol types (open circle, filled circle, square, diamond).
How is it different from the Big Trades view?+
In v15.6, the old 'Deep Trades' was renamed 'Big Trades' (functionality unchanged), and Deep Trades now refers to this new MBO indicator that classifies large activity.
Why does it need MBO data?+
Because classifying large executions cleanly requires tracking each order individually. On aggregated data, the needed resolution is lost.
Does Deep Trades require a specific subscription?+
It requires a Level 2 data feed with MBO enabled. Without that order by order data the indicator stays empty whatever the settings: it is not something to look for in the four tabs.
Why do all my markers have the same size?+
Check the gap between Minimum Size and Maximum Size in the Marker Settings tab. Bounds set too close make every filtered trade look identical on screen.
Is the automatic filtering reliable on a thin instrument?+
Automatic Intensity adjusts to the instrument's recent liquidity: on a quiet market, the same Strong setting lets fewer trades through than on an active one. On a thin instrument, Manual mode with a hand set threshold gives a more stable and predictable result.
Tutorial & settingsDeep Trades: the complete settings, tab by tab
+Display area, filtering, colors, marker size and alerts: every setting explained with its default value and its visual effect.
Deep Trades ranks the market's large activity directly on the chart, from MBO (order by order) data. Before configuring it you need an active MBO feed: without one the indicator stays empty, and that is not a settings problem. This tutorial goes through every configuration tab in the order DeepCharts presents them, with the values that matter and what each one changes on screen.
- A Level 2 data feed with MBO enabled (without MBO the indicator shows nothing)
- The Deep Trades indicator added to the chart from the indicator list
Step by step
- 01
Open the configuration panel
Once Deep Trades is added to the chart, click its settings icon in the list of active indicators. Four tabs appear: Data Settings, Plot Settings, Marker Settings, Alert Settings. Set them in that order because Data Settings decides what shows up, while the other three only decide how it shows up.
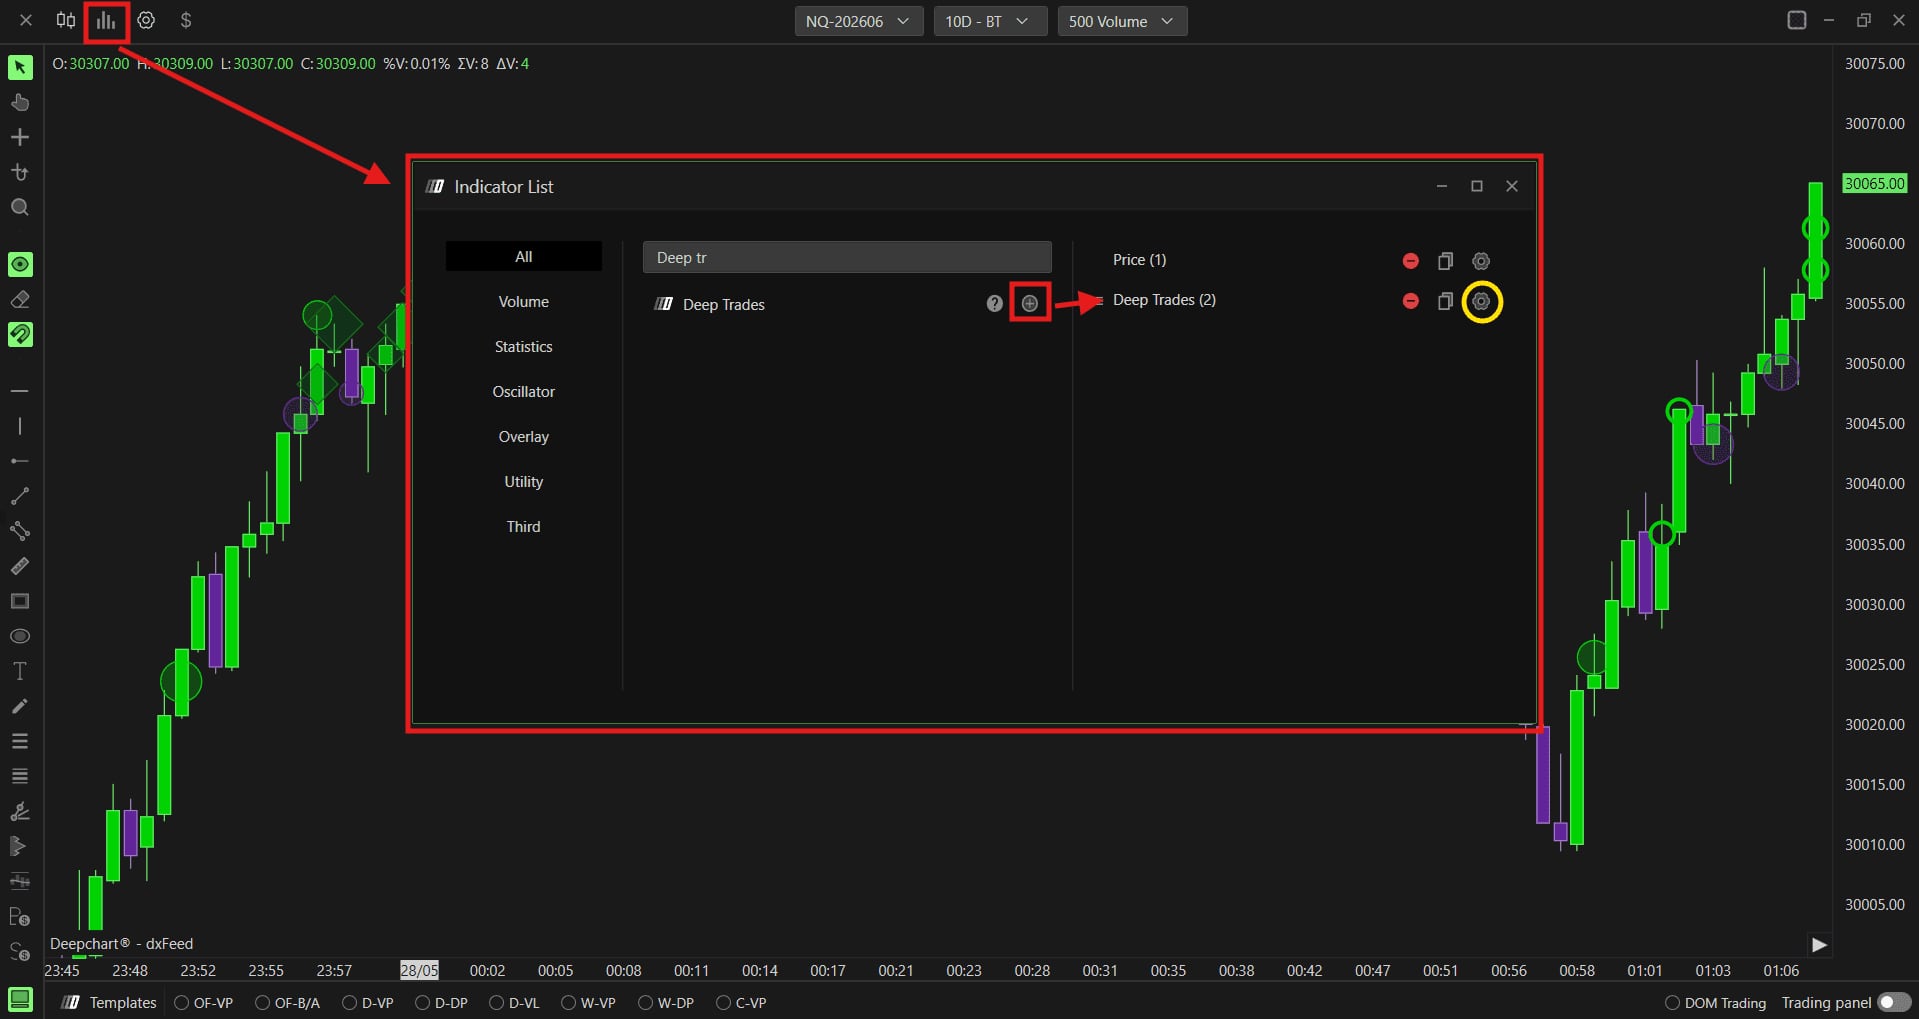
The Deep Trades configuration panel open, with its four tabs visible.© DeepCharts - 02
Set the Data Settings tab
Chart Area chooses whether the indicator reads horizontally or vertically, to match your chart's orientation. Days to Load sets how many days of local history the indicator displays, ten by default, provided those days have already been collected. Filter Mode has two positions: Automatic lets DeepCharts adjust the size threshold to the instrument's recent liquidity, tuned through Automatic Intensity (Low, Medium, Strong); Manual lets you set that threshold yourself through Manual Filter, sixty by default, a field that only appears in Manual mode.
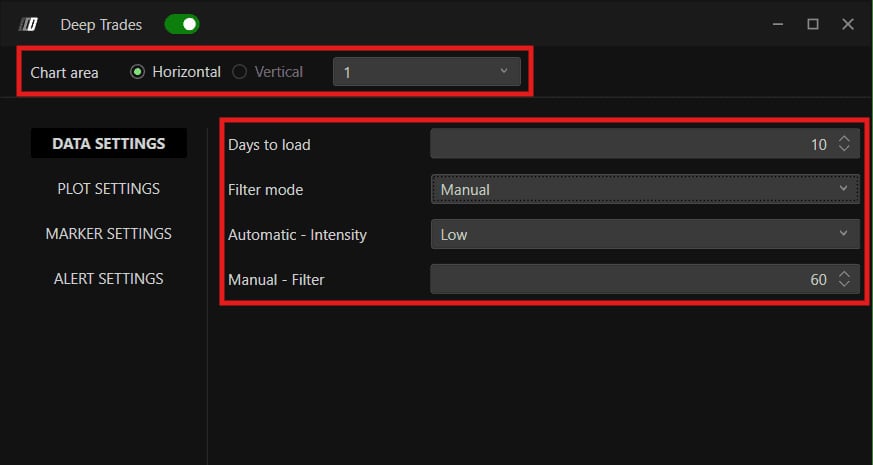
The Data Settings tab, with Chart Area, Days to Load, Filter Mode and Manual Filter visible.© DeepCharts - 03
Set the Plot Settings tab
Standard Dev. sets the statistical sensitivity of the filtering, 2.50 by default. Minimum Opacity and Maximum Opacity bound the markers' opacity: low for trades that barely clear the trigger threshold, high for the largest ones, and that gradient is what makes a cluster stand out at a glance. Four colors are set separately: Ask color and Ask color battle for the buying side, Bid color and Bid color battle for the selling side, the battle variant marking the most contested trades.
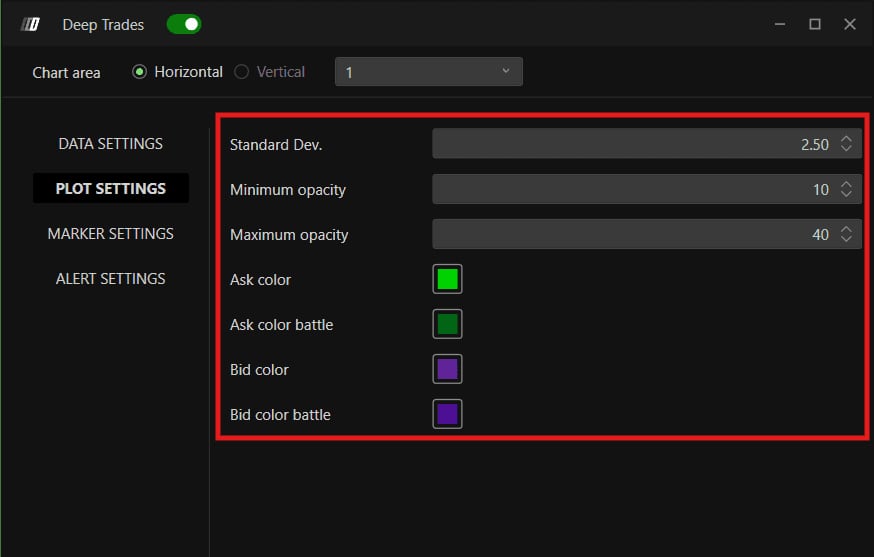
The Plot Settings tab with Standard Dev., the opacity sliders and the four Ask/Bid colors.© DeepCharts - 04
Set the Marker Settings tab
Minimum Size (eight by default) and Maximum Size (twelve by default) bound the on-screen size of the symbols. Bounds set too close flatten the read, every trade looks the same; set them too far apart and only the biggest trades stand out while the rest becomes unreadable. Widen progressively from the defaults, chart open, and judge the result visually.
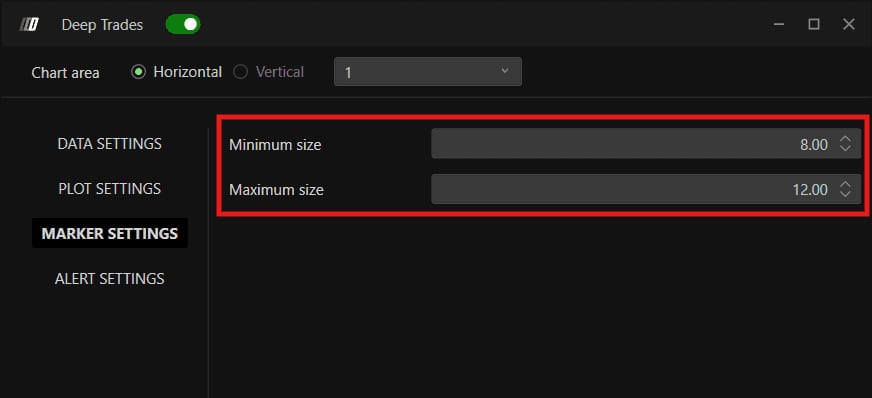
The Marker Settings tab with the Minimum Size and Maximum Size sliders.© DeepCharts - 05
Set the Alert Settings tab
Enable Alert Sound turns the audio alert on, disabled by default. Bid Alert and Ask Alert are two separate dropdown lists, each with its own sound, useful to tell heavy selling pressure from heavy buying pressure by ear without watching the screen. Both follow the same threshold as the Data Settings filtering: tighten that threshold first if the alerts fire too often.
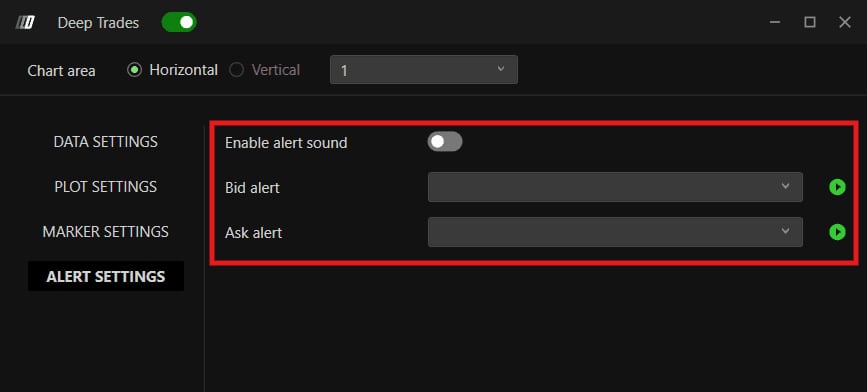
The Alert Settings tab with Enable Alert Sound, and the separate Bid Alert and Ask Alert lists.© DeepCharts
Settings, tab by tab
Reading orientation, to match the chart's.
Limited to days already collected locally: MBO data does not download retroactively.
Manual: size threshold set by hand through Manual Filter. Automatic: threshold adjusted by DeepCharts to recent liquidity.
Only visible in Automatic mode. Strong tightens the threshold: fewer markers, but more significant ones.
Only visible in Manual mode. Size threshold set by hand.
Statistical sensitivity of the filtering.
Opacity of trades that barely clear the trigger threshold.
Opacity of the most significant trades, so a cluster stands out at first glance.
Two shades for the buying side, the battle variant for the most contested trades.
Two shades for the selling side, same logic as the Ask side.
Size of the smallest displayed symbols.
Size of the largest symbols. Bounds set too close flatten the read.
Turns the audio alert on.
Sound played on heavy selling pressure, independent from the Ask alert.
Sound played on heavy buying pressure, independent from the Bid alert.
⚠ Traps to avoid
- Confusing Deep Trades with Big Trades. Since version 15.6, the old indicator named Deep Trades has been renamed Big Trades, and the Deep Trades name now refers to this new MBO based indicator. The two are not configured the same way.
- Expecting history that does not exist yet. MBO data does not download retroactively, it only accumulates in real time once the feed is active. On a fresh install, Days to Load will therefore show nothing until a few days of collection have passed. A database migration is required to keep the history when changing machines.
Want to get better at order flow?
We discuss flow, liquidity and our trades live, every day, on the OrderFlowFutures Discord. Join us, it's free.
Join the Discord for free4 online·46 members·Free · instant access