Published
The DeepCharts Strategy Report turns an account's history into a performance report: balance, profits, losses, drawdown, win rate, every trade in detail, result per instrument, equity curve and profitability by hour. You need a connected trading account with trades in the chosen period. This tutorial covers generating the report and then reading its five tabs.
- A trading account connected in DeepCharts (SIM, prop firm or live account)
- Trades executed on that account during the period you want to analyze
Step by step
- 01
Open the Strategy Report
In the DeepChart menu bar, click Trading then Strategy Report. The window that opens is titled Signal Performance: it is the same module. Its five tabs (Strategy Performance, Trade List, Symbol Performance, Chart, Time Analysis) stay empty until you generate a report.
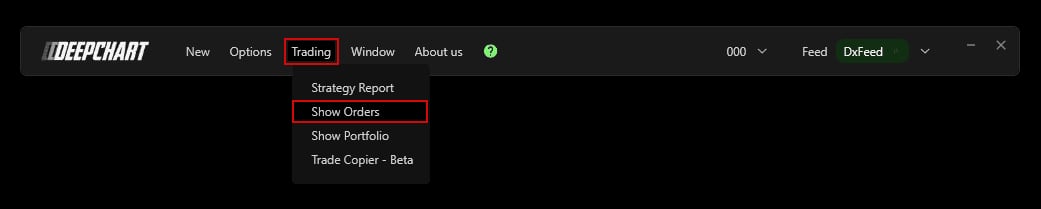
The DeepChart Trading menu with Strategy Report at the top.© DeepCharts - 02
Pick the account, period and symbols
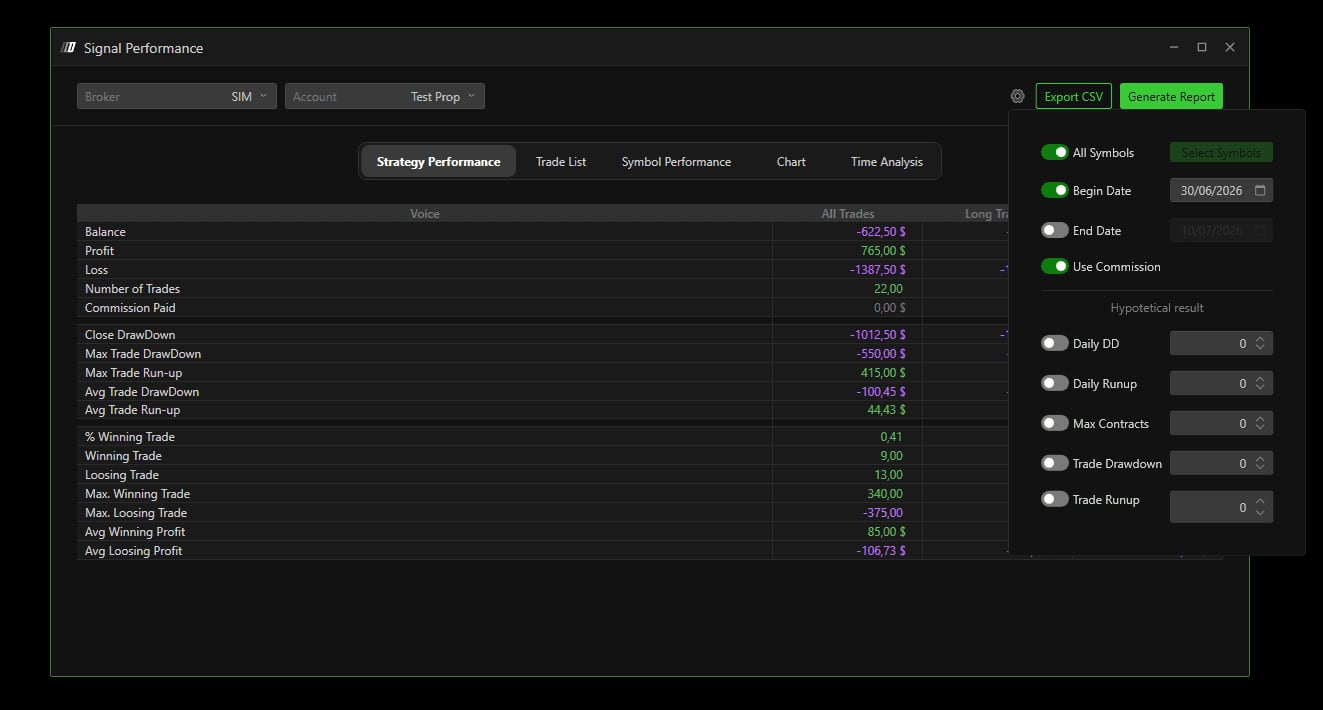
Select the Broker and Account to analyze at the top left. Then click the gear icon at the top right: All Symbols takes every instrument, or turn it off to use Select Symbols; Begin Date and End Date set the period; Use Commission includes commissions in the figures. The panel also has a Hypothetical result section (Daily DD, Daily Runup, Max Contracts, Trade Drawdown, Trade Runup), which the help center does not document. Finally click Generate Report. The Export CSV button sends the data out to a spreadsheet.
- 03
Read the Strategy Performance tab
This is the period's summary: Balance, Profit, Loss, Number of Trades and Commission Paid when commissions are on. Then come drawdowns and run-ups (Close DrawDown, Max Trade DrawDown, Max Trade Run-up and their averages), followed by trade quality: % Winning Trade, number of winners and losers, largest win and loss, average win and loss. Figures are split between all trades, longs and shorts. Always weigh average win against average loss together with the win rate: 41 % can be enough if average wins clearly beat average losses, and a high win rate saves nothing if a few losses wipe everything out.
- 04
Go through the Trade List
One row per trade: Entry DT and Exit DT (date and time), Entry price and Exit price, Entry qty and Exit qty, then the trade's Profit Loss, Drawdown and Runup. Runup shows how far the trade went your way before the exit, Drawdown how far it went against you. Losers with a large Runup point to targets set too far or a stop never moved up; winners with a Drawdown close to your stop point to more risk than you planned.
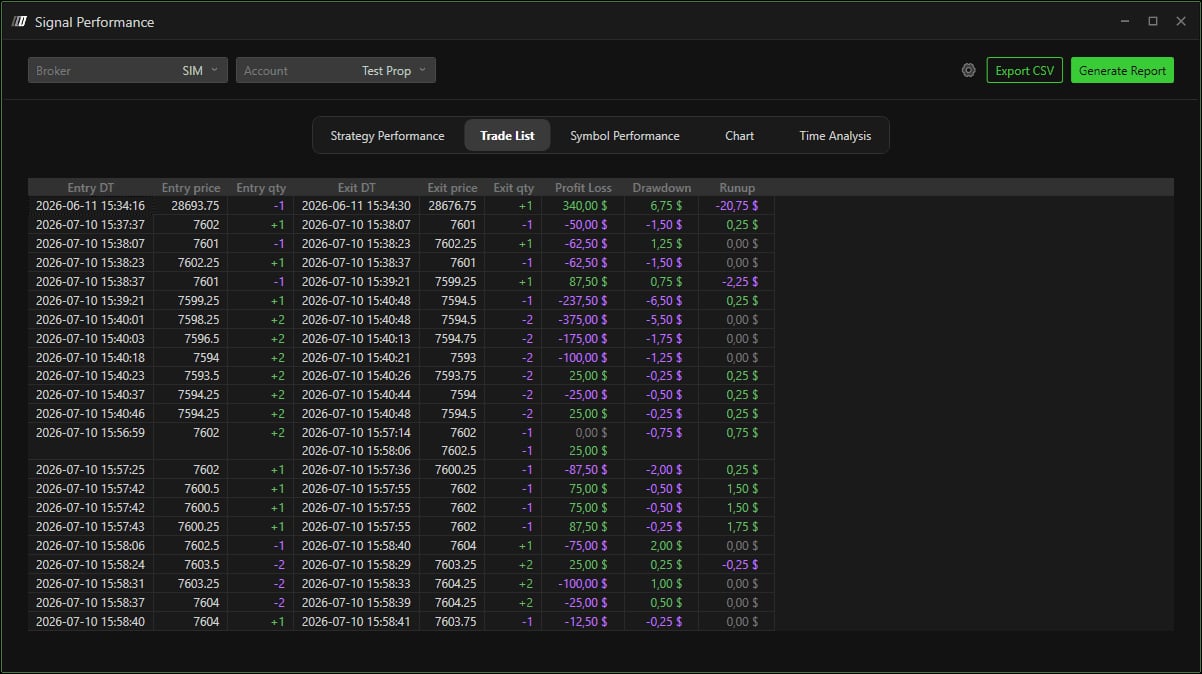
The Trade List tab with entry and exit times, prices and quantities, Profit Loss, Drawdown and Runup.© DeepCharts - 05
Compare instruments with Symbol Performance
This tab gives the period's balance per symbol, as All Trades, Long Trades and Short Trades. This is where you see whether your day is won on NQ and lost on ES, or whether you make money buying one contract but not selling it. An instrument that stays negative period after period deserves to come off your list rather than be traded just to see.
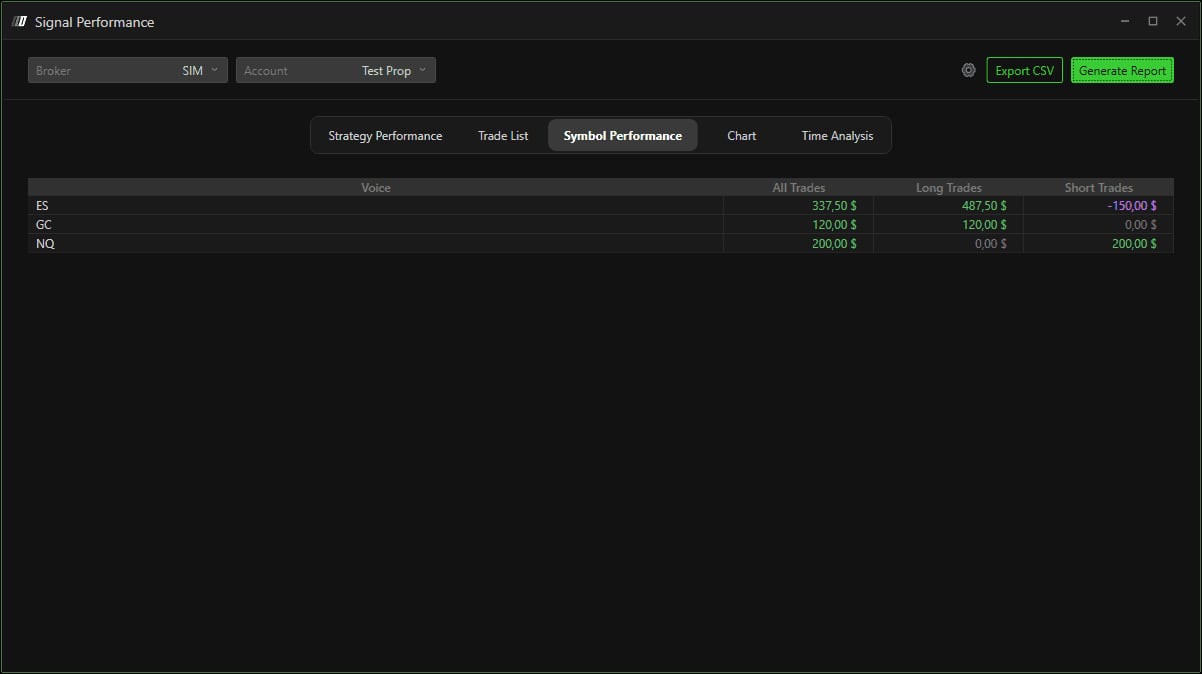
The Symbol Performance tab with ES, GC and NQ split into All, Long and Short Trades.© DeepCharts - 06
View the curve in the Chart tab
The left column offers several charts: Equity Curve, Long Equity and Short Equity, Drawdown, Equity Curve with DrawDown, Daily PL and Trade Analysis. The equity curve shows consistency better than a balance figure: a curve climbing in steady steps and one that dives then rebounds sharply can end at the same level with very different risk, which matters against a prop firm's maximum drawdown.
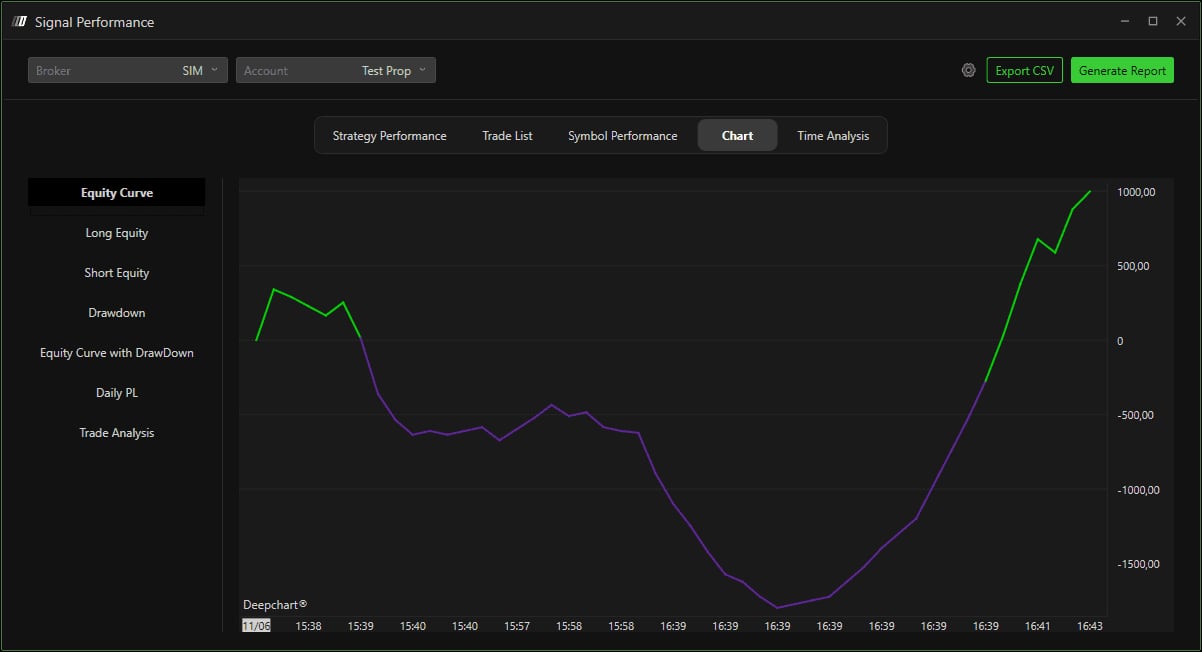
The Chart tab on the Equity Curve, with the list of other charts on the left.© DeepCharts - 07
Find your good and bad hours with Time Analysis
Hourly Analysis splits profitability by hour of the day, Daily, Monthly and Yearly Analysis by day, month and year, always as All, Long and Short Trades. On US index futures, the cash open and late morning do not trade alike: if a time slot stays negative over several weeks, the simplest fix is to stop trading it.
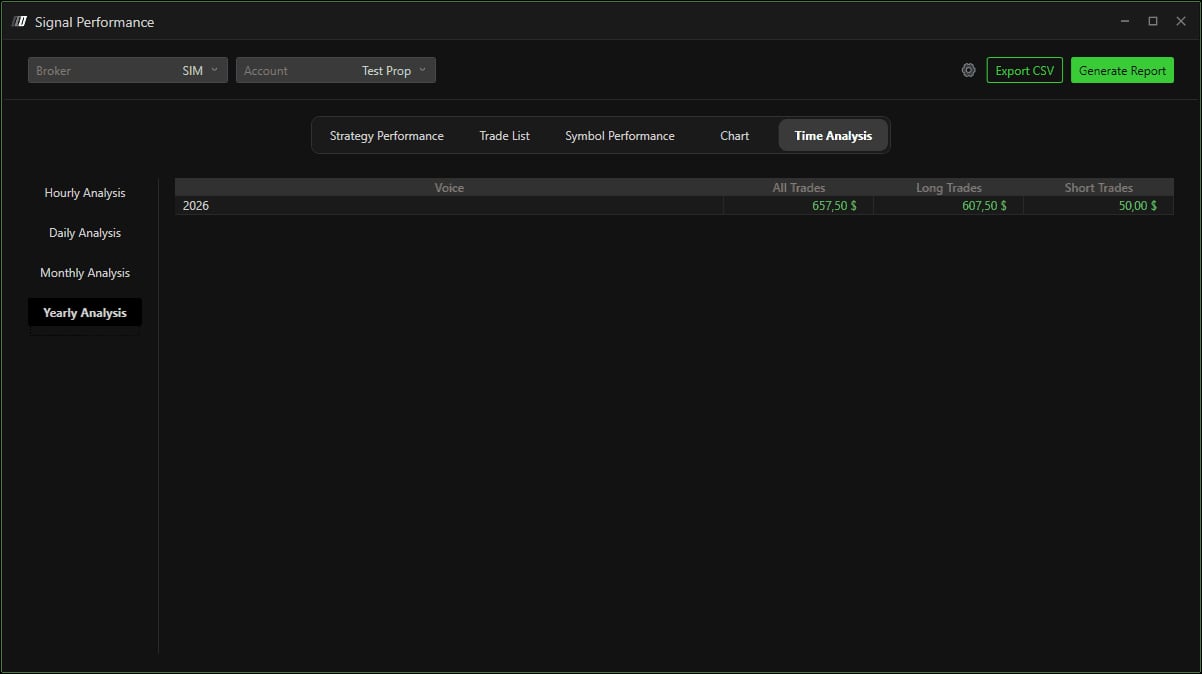
The Time Analysis tab with the Hourly, Daily, Monthly and Yearly Analysis views.© DeepCharts
Settings, tab by tab
Broker of the account to analyze.
Account analyzed.
Exports the data as CSV.
Runs the calculation with the chosen settings.
Every instrument, or a selection once All Symbols is off.
Start of the analyzed period.
End of the analyzed period.
Includes commissions in the figures (Commission Paid row).
Off and set to 0 in the screenshot. Section not documented by the help center.
Balance, profits, losses, drawdowns, run-ups, win rate, as All, Long and Short.
Entry, exit, quantities, Profit Loss, Drawdown, Runup.
Balance per instrument, as All, Long and Short Trades.
Equity Curve, Long Equity, Short Equity, Drawdown, Equity Curve with DrawDown, Daily PL, Trade Analysis.
Hourly, Daily, Monthly and Yearly Analysis.
⚠ Traps to avoid
- Analyzing the wrong account. Check Broker and Account before Generate Report, especially if you run a SIM account alongside one or more prop firm accounts.
- Forgetting Use Commission. Without commissions, very active scalping on MNQ or MES looks more profitable than it is.
- Drawing conclusions from too few trades. A time slot or instrument with three trades tells you nothing; widen the period before changing how you trade.
- Judging on Balance alone. Look at drawdown and the equity curve too: they often decide whether a prop firm evaluation passes.
FAQ
Where are the trading statistics in DeepCharts?+
DeepChart's Trading menu, then Strategy Report. Pick the broker, account and period, then click Generate Report.
Can I analyze a single instrument?+
Yes: in the settings (gear icon), turn off All Symbols and use Select Symbols. The Symbol Performance tab also compares instruments with each other.
Are commissions taken into account?+
Only if Use Commission is on in the settings. They then show in the Commission Paid row of Strategy Performance.
How do I find out which hours I trade best?+
Open the Time Analysis tab and choose Hourly Analysis: profitability is split by hour of the day, for longs, shorts and in total.
Want to get better at order flow?
We discuss flow, liquidity and our trades live, every day, on the OrderFlowFutures Discord. Join us, it's free.
Join the Discord for free9 online·82 members·Free · instant access