Published
Option Summary Gex plots the session's net gamma exposure (GEX) as an oscillator, so you know at any moment whether the market sits in a positive or negative gamma regime. Unlike Option Summary, it relies on real market maker data published by Cboe: it requires the DeepGamma module and an SPX option chart. This tutorial covers adding it, its settings and the Marker bands.
- An active DeepGamma module: it is licensed separately from DeepChart, and without it option indicators do not show up
- An SPX option chart opened through New then Option Chart (symbol ES-CME, exchange CME), the only supported instrument
Step by step
- 01
Open an SPX option chart
Go to New in the top menu, then Option Chart, and pick the SPX row, symbol ES-CME, exchange CME, in the Select Instrument box. Like the GEX Profile and the other indicators reading Cboe participant data, Option Summary Gex only exists on SPX: on NDX, QQQ or SPY it will not show up. The resulting chart carries the ES futures price, which also makes it the reference for an MES trader on a prop firm account.
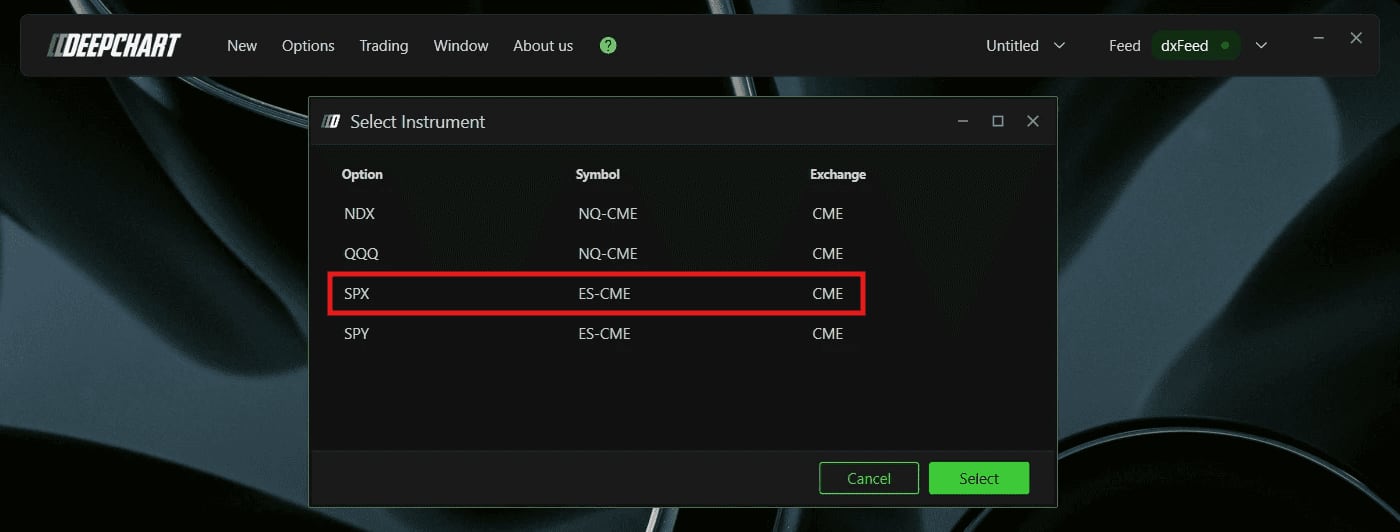
The Select Instrument box with the SPX, ES-CME, CME row highlighted.© DeepCharts - 02
Add Option Summary Gex
Click Indicator Add in the toolbar, type Option Summary Gex, add it with the plus button, then open the settings icon. The indicator sits in the Deep Gamma (CBOE) category of the list. In the screenshot, Chart area is on Horizontal with panel 2 selected: the oscillator draws in its own pane below price, not over the candles. The window has two tabs, Parameters (with the GENERAL and MARKER sections) and Subgraphs.
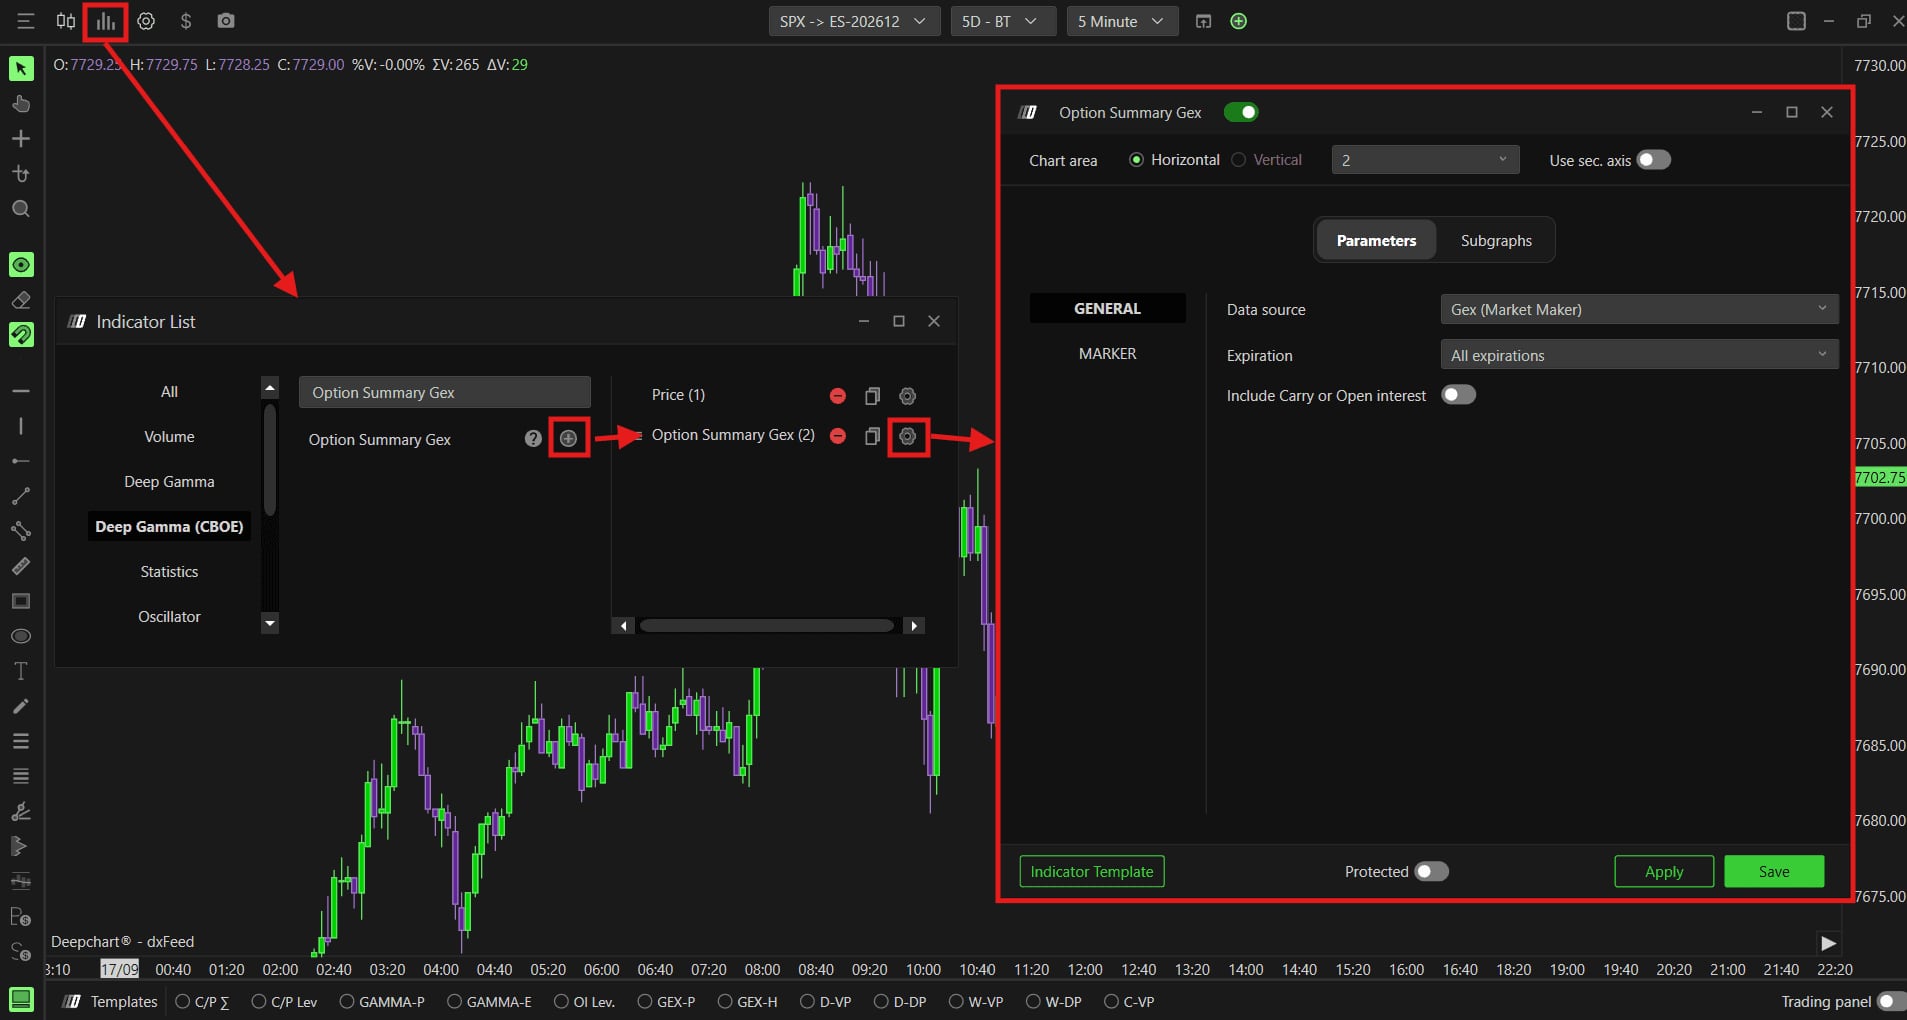
The indicator list on Deep Gamma (CBOE) with Option Summary Gex added and its settings window open.© DeepCharts - 03
Pick the data source
Data source decides what the oscillator adds up. Gex (Market Maker), the default, nets market maker gamma exposure reported by Cboe across all strikes: the most reliable read of the session's gamma regime. Gex (OI R.T.) computes net GEX on real time open interest rather than today's volume, for a more structural view. Dex (Market Maker) nets market maker delta exposure, so directional hedging pressure rather than the gamma regime. Market Maker Δ shows the net delta flow from market maker buying and selling. These are the same families as in the GEX Profile, but boiled down to one value per bar instead of spread strike by strike.
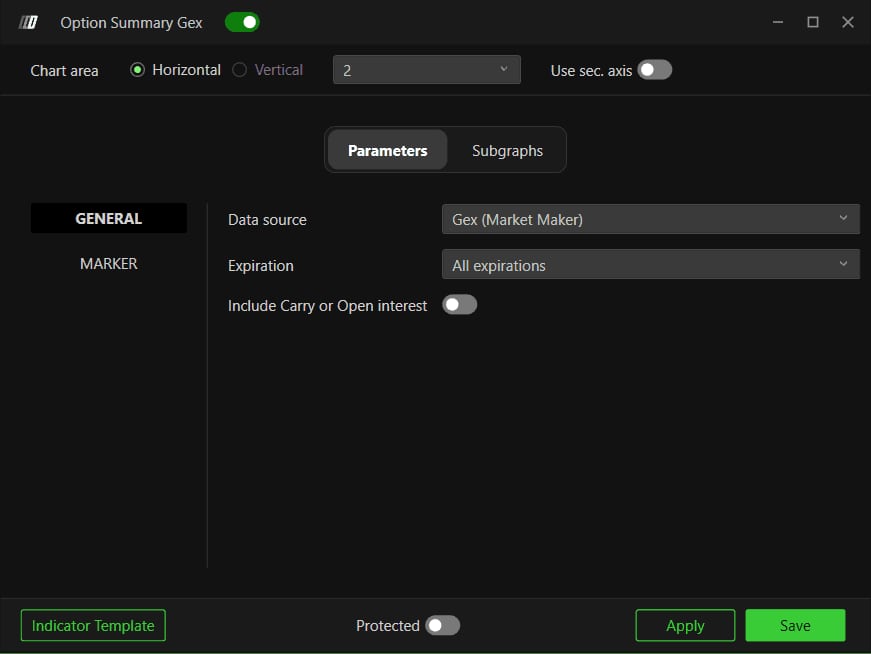
The Parameters tab, GENERAL section, with Data source on Gex (Market Maker) and Expiration on All expirations.© DeepCharts - 04
Set expiration and carry
Expiration defaults to All expirations, with 0 DTE, <= 1d, <= 7d, <= 31d and <= 91d as alternatives. Narrowing to 0 DTE gives the regime created by same day options, the ones weighing most on intraday SPX and therefore ES. Include Carry or Open interest, off by default, adds open interest carried from earlier sessions: on, you see total positioning; off, only the current session counts. There is no Number of Strikes here: the value is always netted across every strike.
Screenshot to comeThe Expiration and Include Carry or Open interest settings in the GENERAL section.
- 05
Color the chart with the Marker section
MARKER is what sets this indicator apart from a plain oscillator: it paints background bands right on the price chart according to the regime, so you catch regime shifts without taking your eyes off the candles. Enable is off by default. Positive color, green, shades positive regime periods; Negative color, purple according to the help center, shades negative ones. Value, zero by default, is the threshold that flips the color: at zero, the band changes exactly when net GEX changes sign. Opacity, twenty by default, keeps the bands subtle enough to read candles and your other indicators through them.
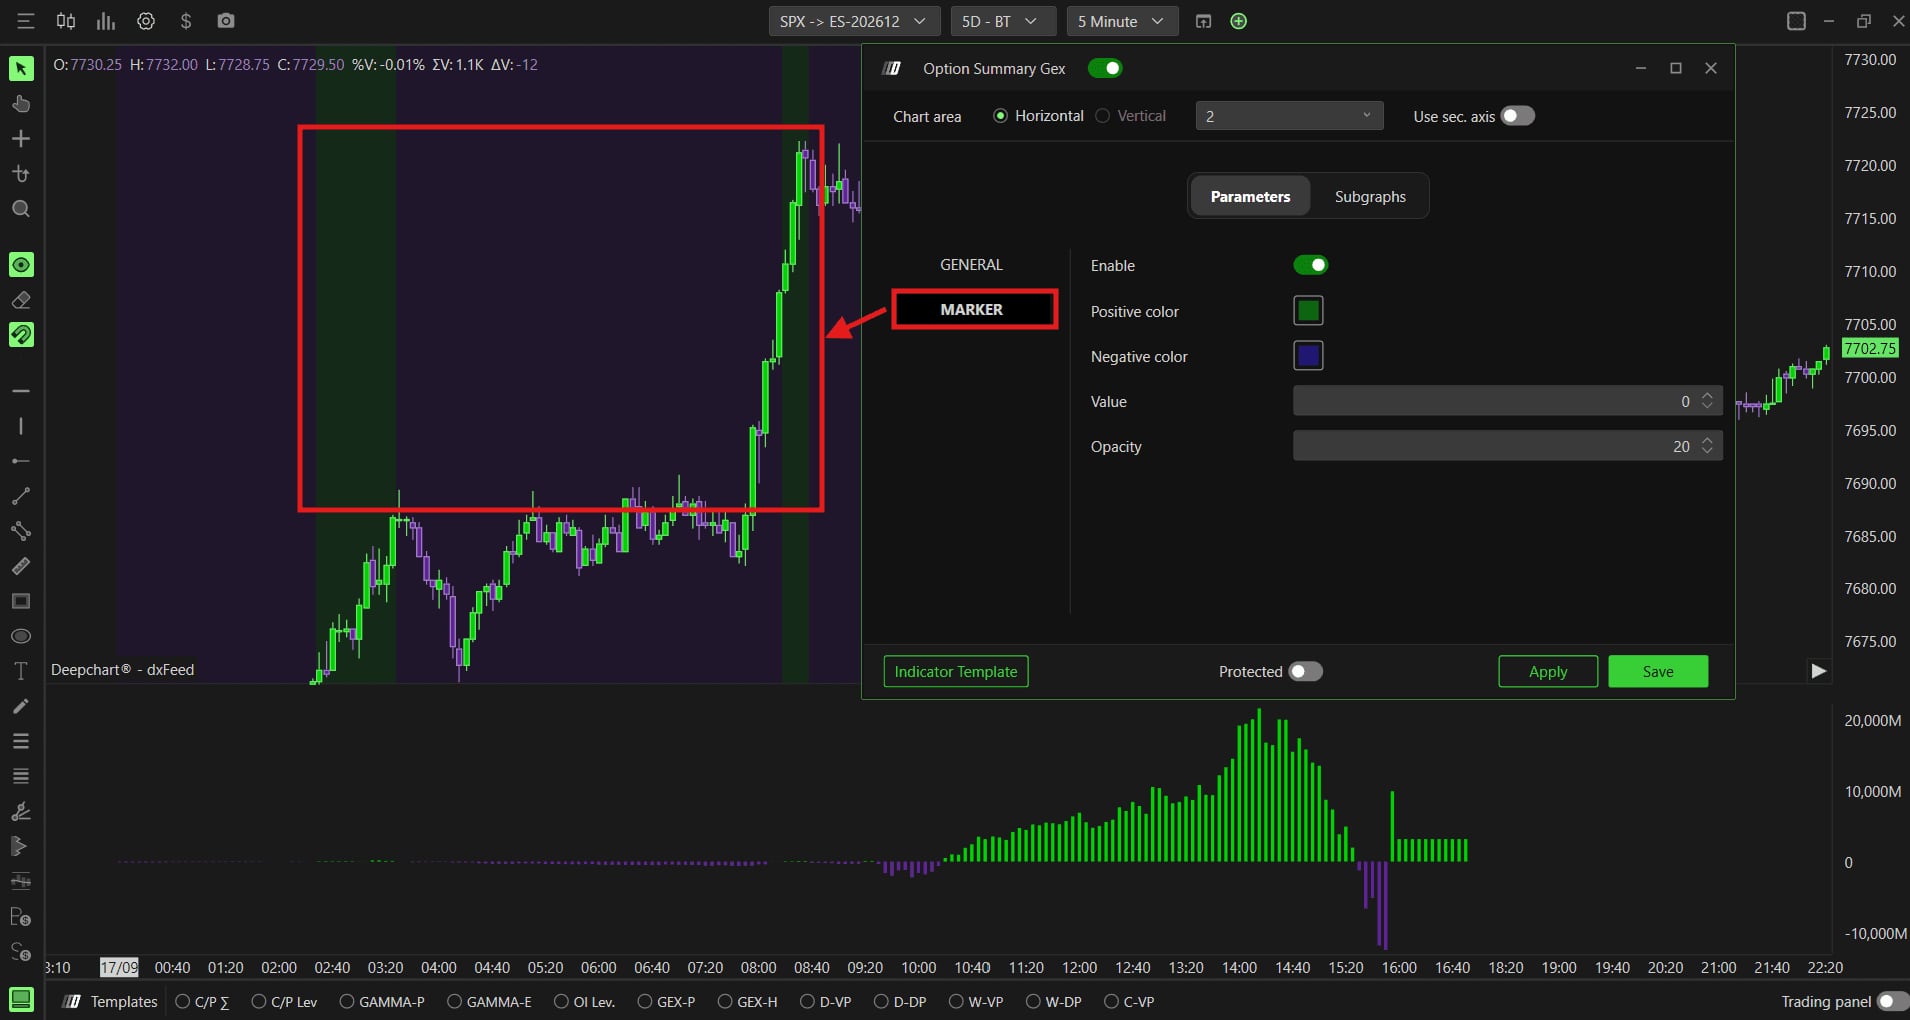
The MARKER section enabled, Value at 0 and Opacity at 20, and the chart background shaded in green and purple bands.© DeepCharts - 06
Style the Regime (1) series
The Subgraphs tab holds a single series, Regime (1). Color is green and 2° Color purple, and Auto Color on +/- applies one or the other by sign: green above zero, purple below. Subgraph Style is Bars (alternatives Line and Ignore), Line Style Solid, Line Width four. Value Label and Value Background are on, which shows the current value on the right scale; Name Label and Name Background are off, as is Chart color for marker. One quirk: Include on Auto Center is on here, whereas you keep it off on the Gamma Bands price lines. That makes sense, the oscillator lives in its own pane and must stay framed.
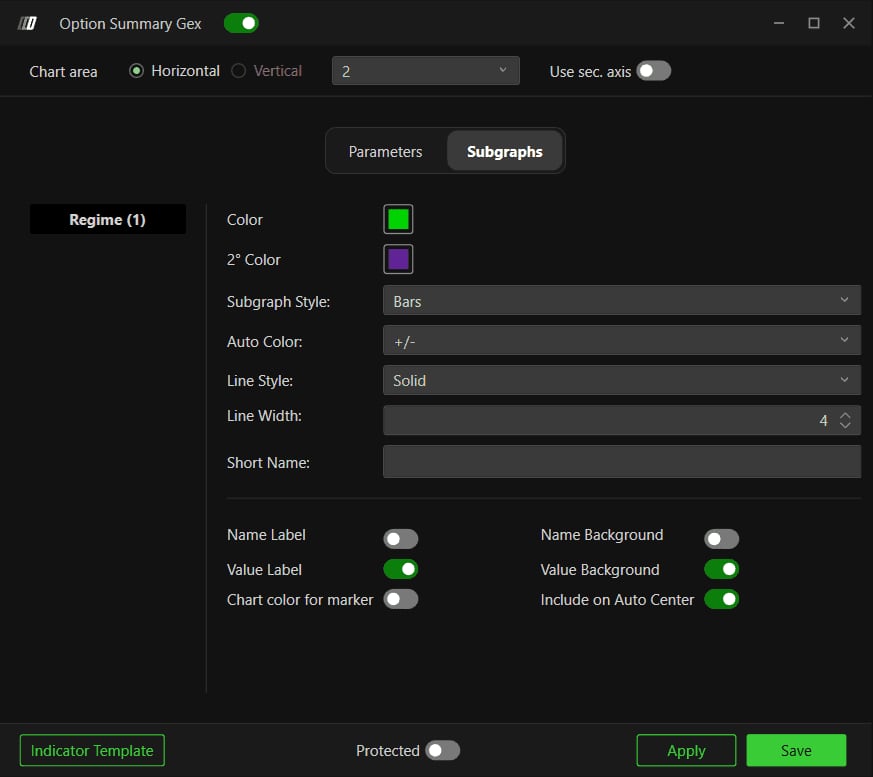
The Subgraphs tab on Regime (1) with Subgraph Style on Bars, Auto Color on +/- and Line Width at 4.© DeepCharts - 07
Read the regime during the session
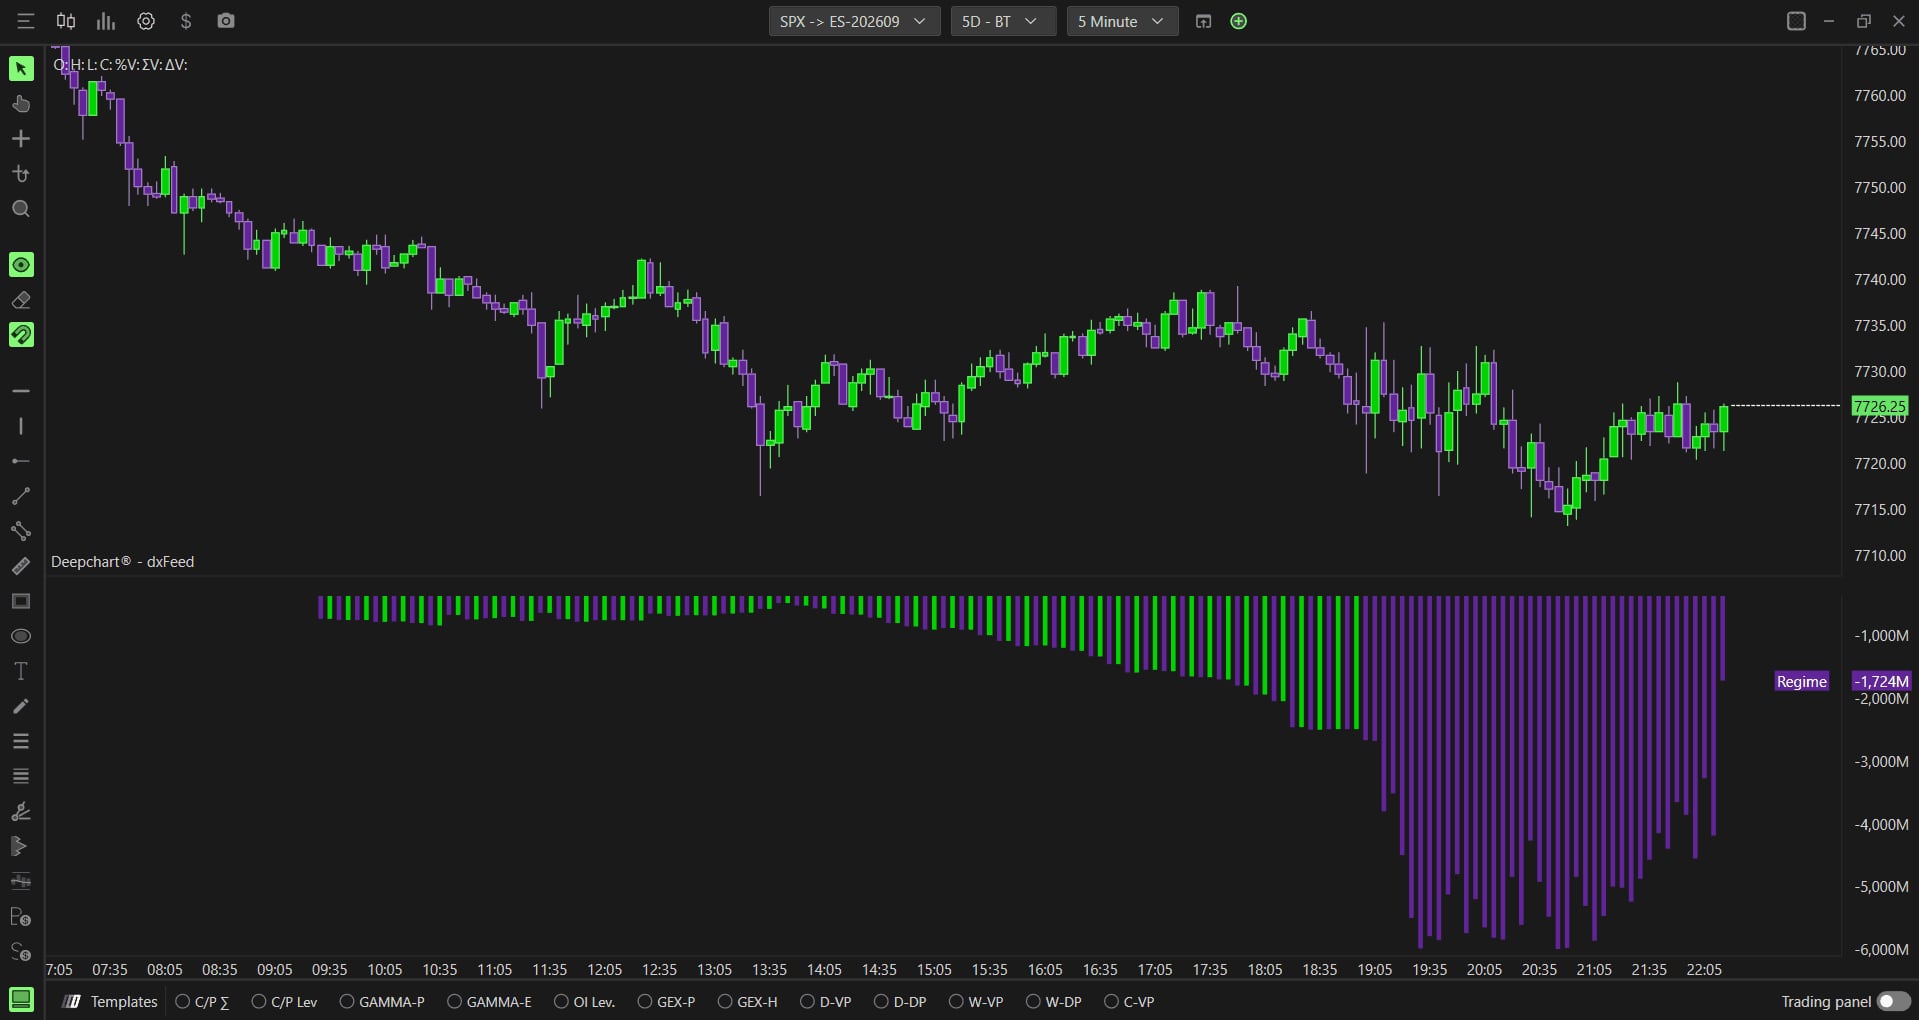
Green oscillator, positive gamma regime: expect more compressed price action, since real market maker positioning backs that regime. Turning purple, negative regime: expect more volatile, directional moves. In the screenshot, the oscillator is drawn as a Line and the purple Marker background keeps reminding you that the session is in negative gamma. The help center also suggests comparing with Option Summary: where the naive and real readings diverge, notably on 0DTE and OPEX sessions, the Gex version is the one to trust.
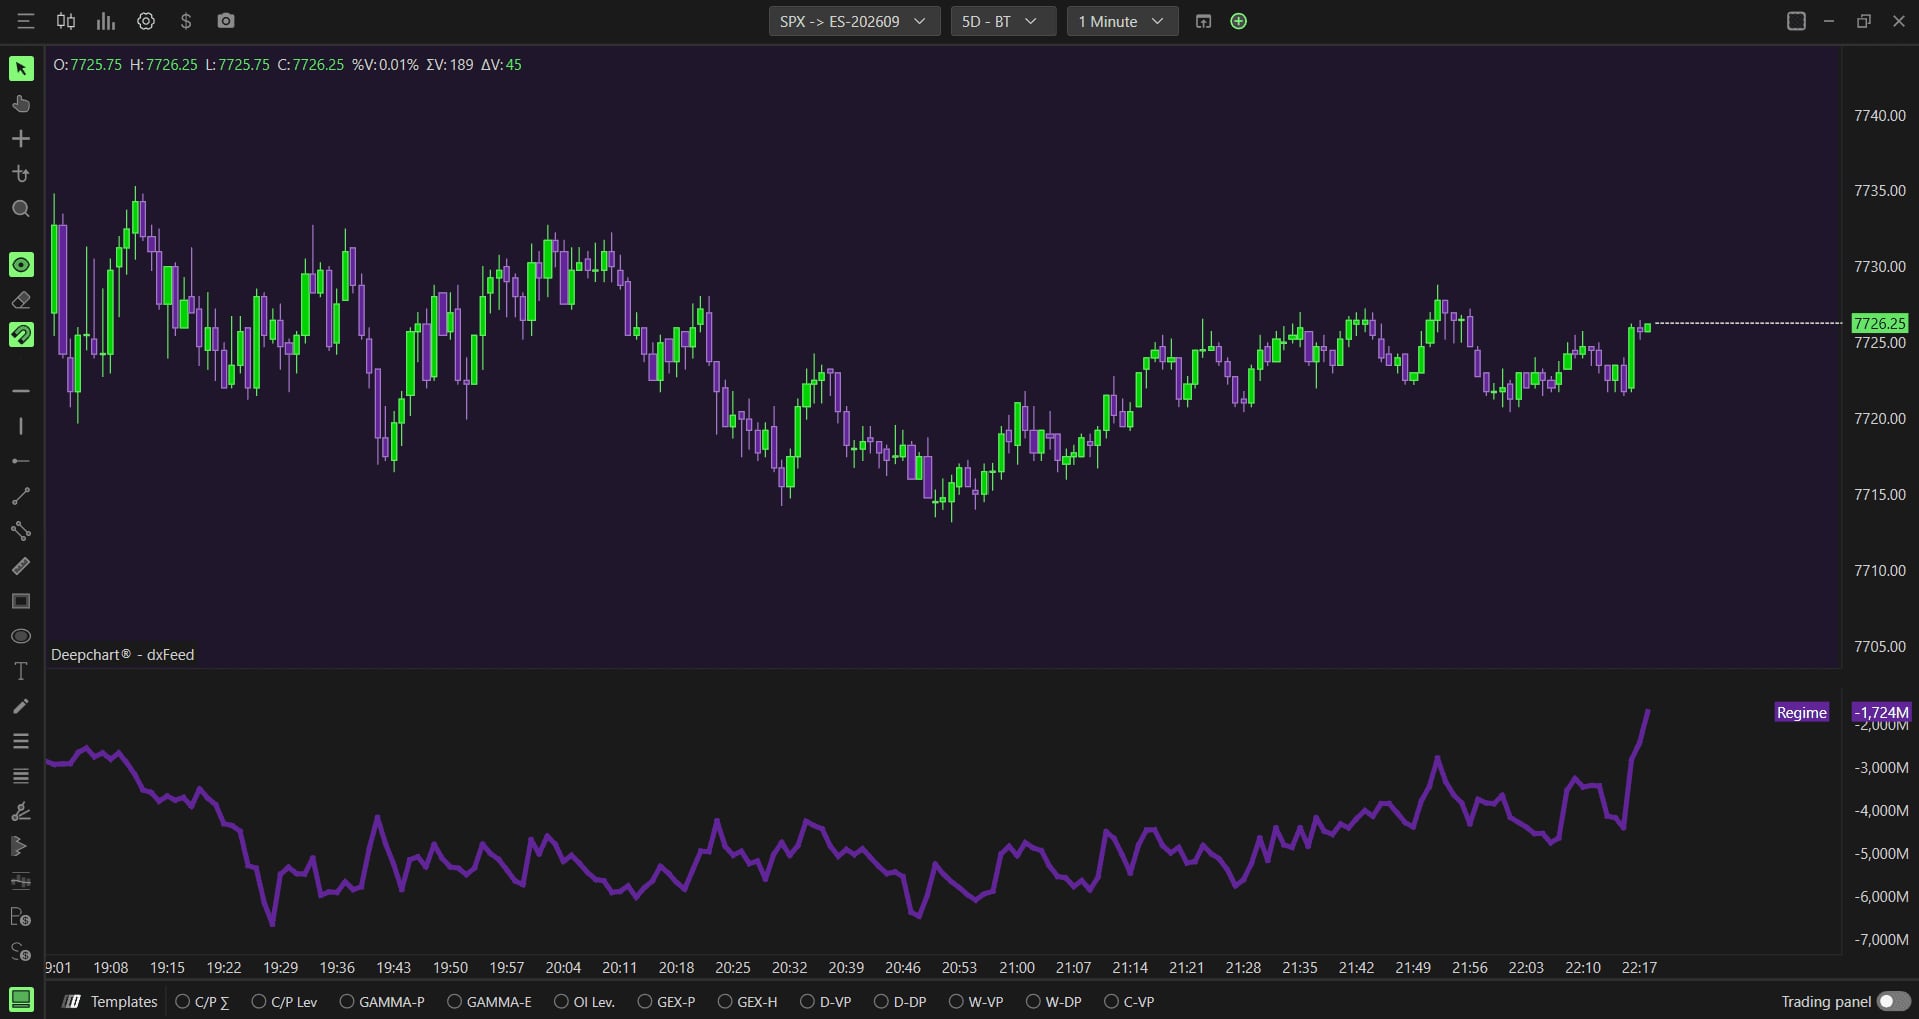
One minute SPX chart on a purple background, with the Regime oscillator drawn as a line below price.© DeepCharts
Settings, tab by tab
The settings that change the computed value.
Market maker gamma exposure reported by Cboe, netted across all strikes.
Structural view, less driven by today's volume.
Directional hedging pressure rather than the gamma regime.
Separates dealer activity from overall activity.
0 DTE, <= 1d, <= 7d, <= 31d, <= 91d, All expirations.
Adds open interest carried from previous sessions.
Background bands painted on the price chart according to the regime.
Shows or hides the bands on price.
Background for positive regime periods.
Background for negative regime periods.
Threshold that triggers the color change.
Transparency of the bands.
Line, Bars or Ignore.
None, Slope or +/-: green above zero, purple below.
The label shown in the screenshot reads Regime.
Current value shown on the scale.
Keeps the oscillator framed in its pane.
⚠ Traps to avoid
- Looking for Option Summary Gex on an NDX chart to trade NQ. It needs Cboe data and only works on SPX.
- Mixing up Option Summary and Option Summary Gex. The former relies on a standard positioning assumption; the latter on real market maker data. According to the help center, the assumption breaks down most on 0DTE and OPEX sessions.
- Enabling Marker and forgetting the bands stack with your other indicators. At Opacity twenty they stay subtle; pushing it much higher drowns the candles and any heatmap.
- Reading a regime as an entry signal. Positive or negative gamma describes how the market is likely to behave (compressed or directional), not a direction: it is a filter to choose between fading moves and following breakouts.
FAQ
What does the oscillator's color mean?+
With Auto Color on +/-, bars are green when net GEX is positive (positive gamma regime, a rather compressed market) and purple when it is negative (negative regime, a more volatile and directional market).
What is the Marker section for?+
It paints color bands in the background of the price chart according to the regime, with a threshold (Value, 0 by default) and an opacity (20 by default). You see regime shifts without looking at the oscillator pane.
How is it different from the GEX Profile Summary?+
The GEX Profile Summary shows cumulative totals next to the profile. Option Summary Gex is a separate indicator that tracks net GEX bar after bar as an oscillator, and can shade price according to the regime.
Should I keep Gex (Market Maker) as the source?+
It is the read the help center recommends for the session's gamma regime. Gex (OI R.T.) gives a more structural view based on real time open interest; Dex (Market Maker) and Market Maker Δ answer another question, directional pressure.
Want to get better at order flow?
We discuss flow, liquidity and our trades live, every day, on the OrderFlowFutures Discord. Join us, it's free.
Join the Discord for free9 online·82 members·Free · instant access