Published
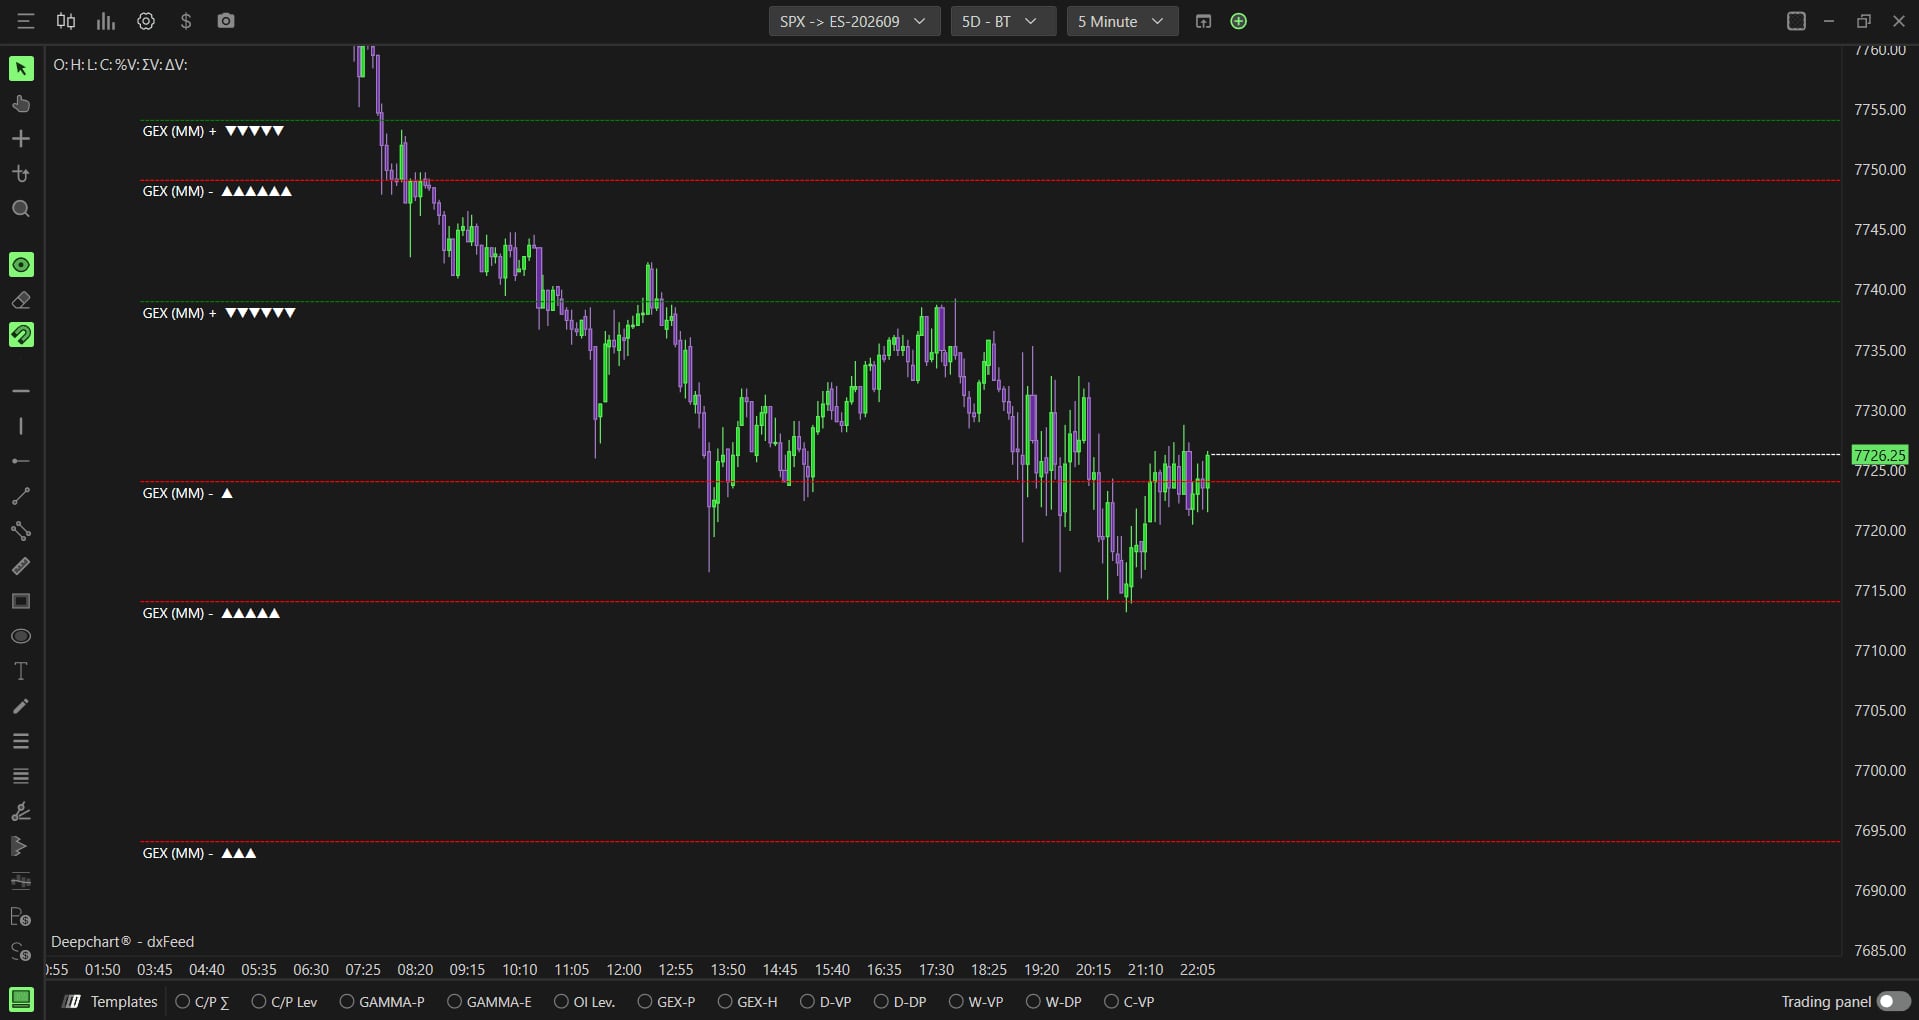
Option Levels Advanced draws, right on the price chart, the strikes where market maker exposure is most concentrated, ranks them by strength with triangles, and adds the Zero Gamma line. Unlike the standard version, it relies on real Cboe participant data: you need the DeepGamma module and an SPX option chart. This tutorial covers adding it, both settings tabs and how to read the levels.
- An active DeepGamma module: it is licensed separately from DeepChart, and without it option indicators do not show up
- An SPX option chart opened through New then Option Chart (symbol ES-CME, exchange CME), the only supported instrument
Step by step
- 01
Open an SPX option chart
Go to New in the top menu, then Option Chart. In the Select Instrument box, pick the SPX row, symbol ES-CME, exchange CME. The other three rows (NDX, QQQ, SPY) are there, but the indicator will not work on them: like the GEX Profile, it reads the participant data published by Cboe, which only exists for SPX options. Once the chart is open, the title bar reads SPX -> ES followed by the contract month: the levels are read on the ES futures price, which also holds if you trade MES on a prop firm account.
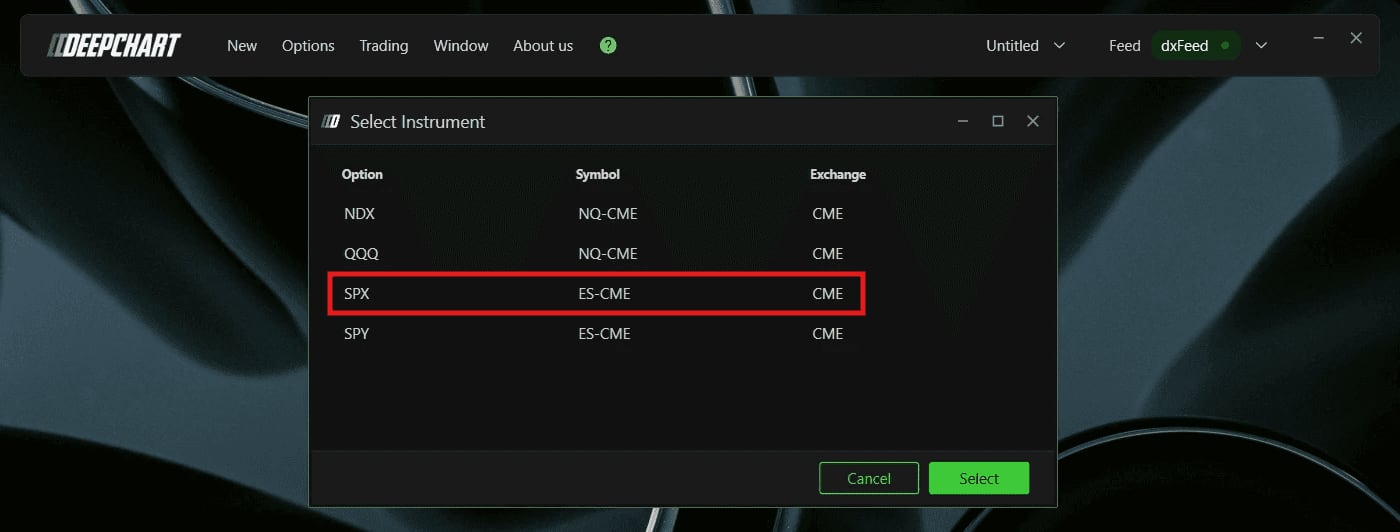
The Select Instrument box with the SPX, ES-CME, CME row highlighted.© DeepCharts - 02
Add Option Levels Advanced
Click Indicator Add in the chart toolbar, type Option Levels Advanced in the search box, add it with the plus button, then click the settings icon next to Option Levels Advanced (2) in the right hand list. The settings window has two tabs in its left column, GENERAL and PLOT SETTINGS, under the Chart area row (Horizontal or Vertical) that every indicator shares. The word Advanced matters: the standard version, Option Levels, builds its levels on volume or gamma assumptions, not on Cboe market maker data.
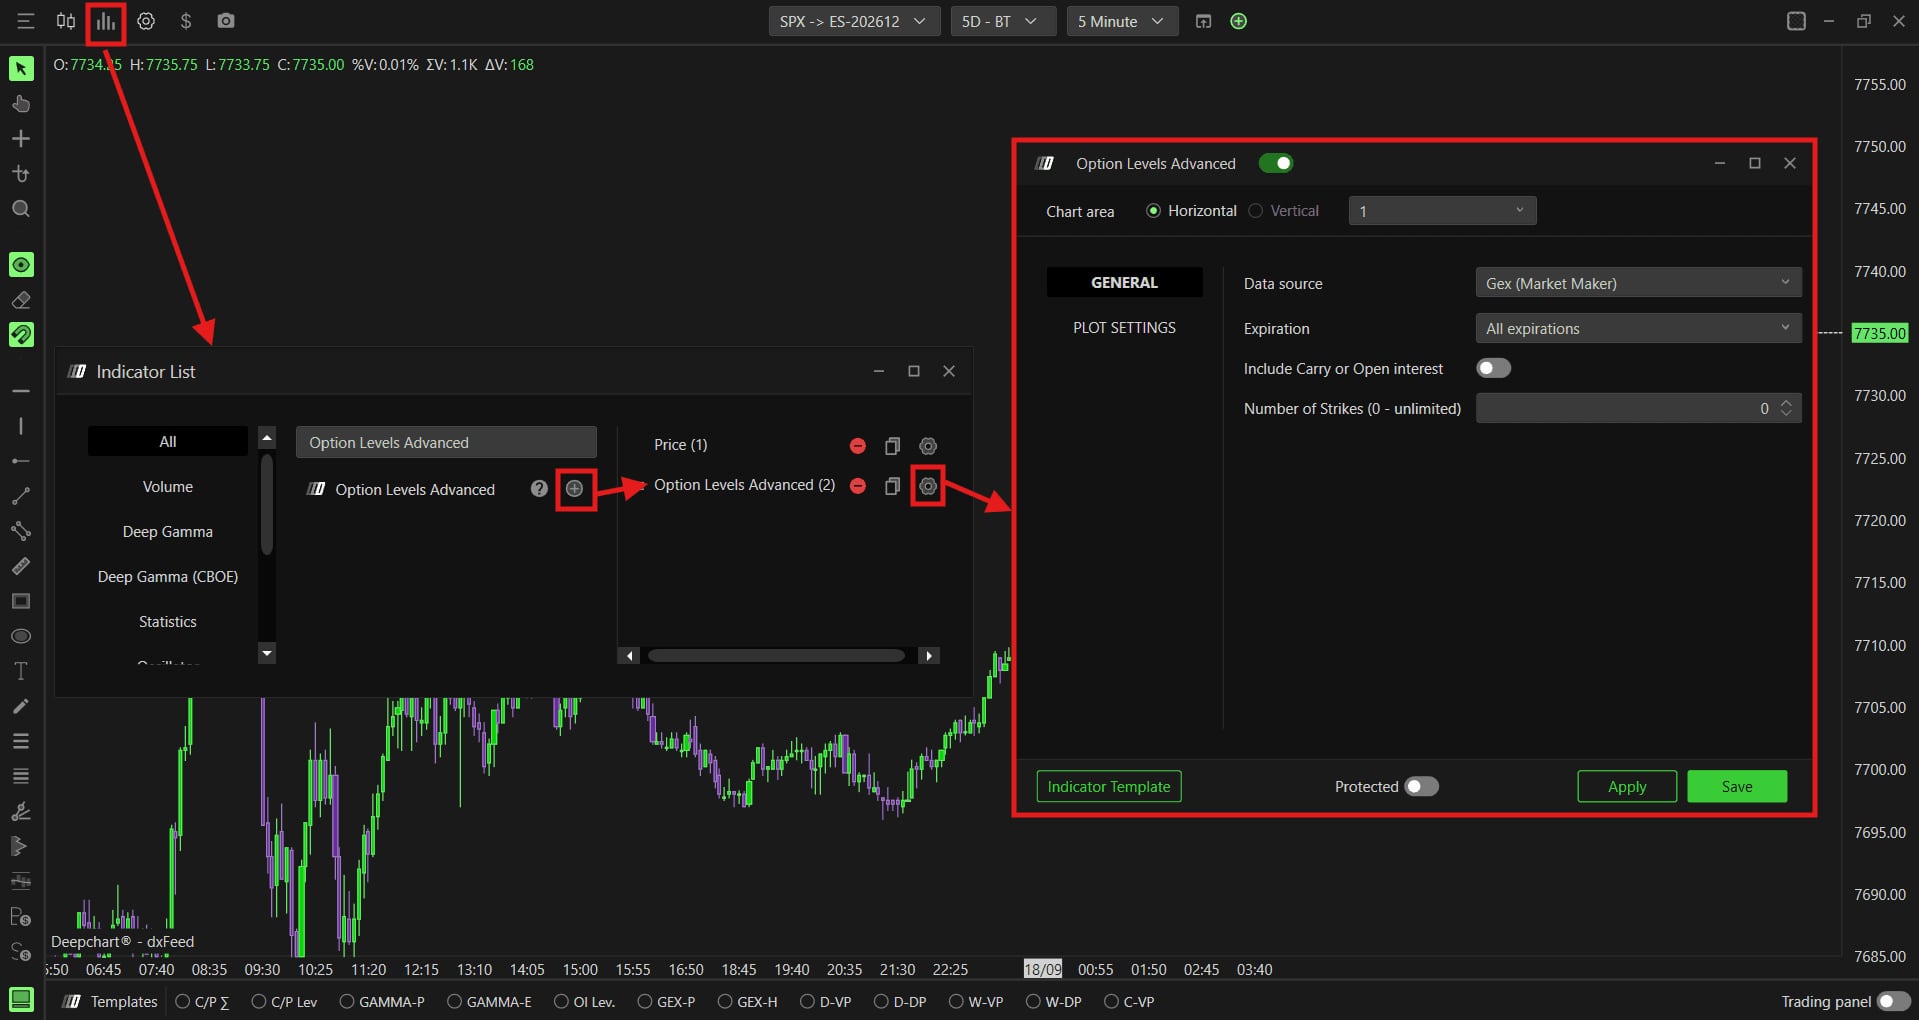
The indicator list with Option Levels Advanced added and its settings window open on GENERAL.© DeepCharts - 03
Pick the data source
Data source decides what the lines represent. Gex (Market Maker), the default, uses market maker gamma exposure as reported by Cboe: the reference read for where real hedging pressure sits. Market Maker Net Flow isolates the net delta flow from market maker buying and selling. OI (R.T.) uses the open interest DeepChart computes in real time from the Cboe flow, useful to see where standing positions are rather than today's volume. Dex (Market Maker) shows delta exposure, so directional hedging pressure rather than gamma sensitivity. Gamma (Call OI-R - Put OI-R) recomputes gamma on real time open interest for a structural view. It is almost the same list as in the GEX Profile: the difference is that here each source turns into lines on price instead of a histogram pinned to the right edge.
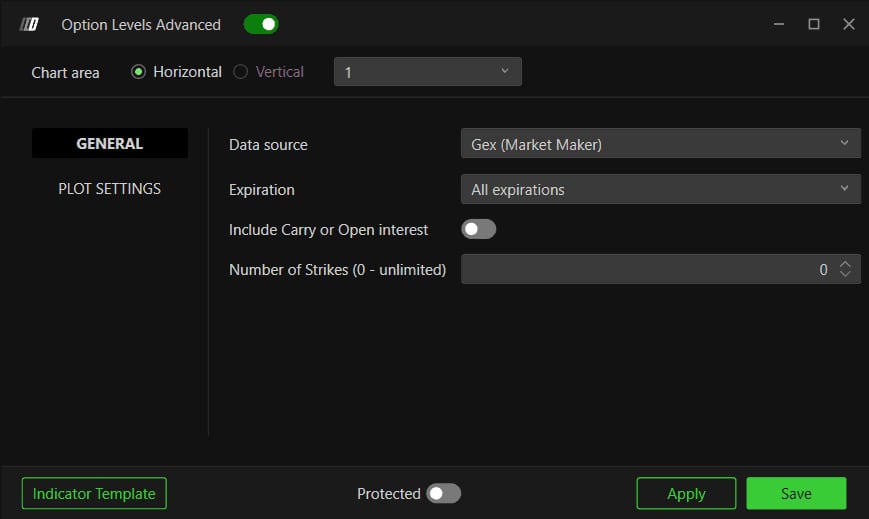
The GENERAL tab with Data source on Gex (Market Maker), Expiration, Include Carry or Open interest and Number of Strikes.© DeepCharts - 04
Frame the expiration and strike count
Expiration defaults to All expirations and narrows to 0 DTE, one day, seven days, thirty one days or ninety one days. Include Carry or Open interest, off by default, adds open interest carried over from earlier sessions: on, you see total positioning; off, only the current session counts. Number of Strikes (0 - unlimited) limits the calculation to the strikes closest to price; zero, the default, takes them all. Every level label reflects the chosen source and expiration filter (GEX (MM) in the screenshot): change either one and you change what the line means.
Screenshot to comeThe Expiration, Include Carry or Open interest and Number of Strikes (0 - unlimited) settings.
- 05
Read the triangles and the Zero Gamma line
Each plotted level carries a row of triangles ranking it against the other levels on the chart: more triangles means a stronger concentration at that strike. Positive levels are green with downward triangles, negative levels red with upward triangles. On top of these ranked levels, the indicator draws the Zero Gamma line, yellow by default: it does not depend on how many levels you display, and marks the single price where market maker gamma exposure flips from positive to negative, computed here from Cboe data. It is the same concept as the Zero Gamma line in Gamma Bands, minus the volume based estimate.

Two GEX (MM) labels with their triangles, pointing up on a red line and down on a green line.© DeepCharts - 06
Set line extension in Plot Settings
The EXTENSION section controls how much information lands on screen. Number of sessions, one by default, sets how many previous sessions the levels extend across. Number of levels, two by default, sets how many levels are drawn and therefore ranked against each other by the triangles: raising it adds strikes to the ranking, but quickly clutters an already busy ES chart. Extension mode offers None (levels drawn on the current session only), Till interaction, the default, which extends the line until price touches it, and Till end window, which extends it to the edge of the visible window.
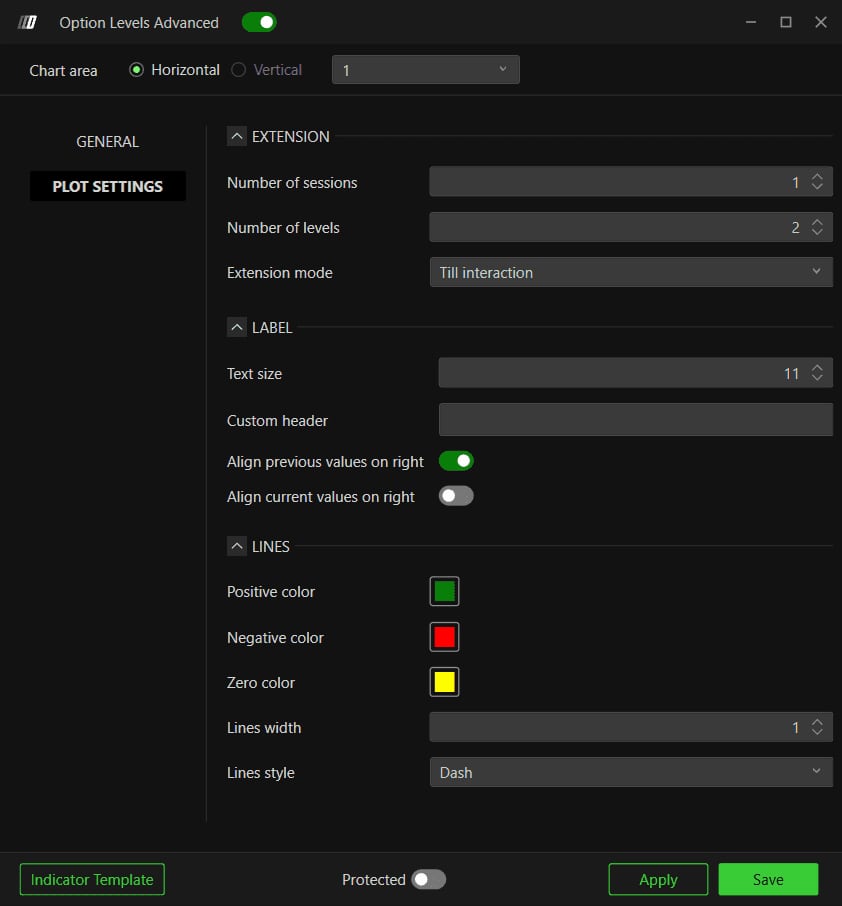
The PLOT SETTINGS tab with its EXTENSION, LABEL and LINES sections.© DeepCharts - 07
Style the labels and lines
Under LABEL, Text size is eleven, Custom header adds your own text to the labels, Align previous values on right (on by default) pushes the labels of previous sessions to the right, and Align current values on right (off) does the same for the current session. Under LINES, Positive color is green, Negative color red and Zero color yellow; Lines width is one and Lines style Dash. If you also run Gamma Bands, change the Zero color of one of them: two yellow Zero Gamma lines calculated differently, and you no longer know which one you are looking at.
Screenshot to comeThe LABEL and LINES sections of the PLOT SETTINGS tab.
- 08
Cross check with the other DeepGamma indicators
The help center frames the indicator as an anchor: specific prices to react to, to be confirmed by context. Option Summary gives the market regime (positive or negative gamma) before you trade a level, the GEX Profile shows the full exposure distribution around each level, the GEX Heatmap shows the same exposure as colored zones on price, and Option Gex Profile Hedging tells you whether hedging at that level is likely to amplify or dampen the move. Start from the regime, drill down to the level, then confirm with positioning.
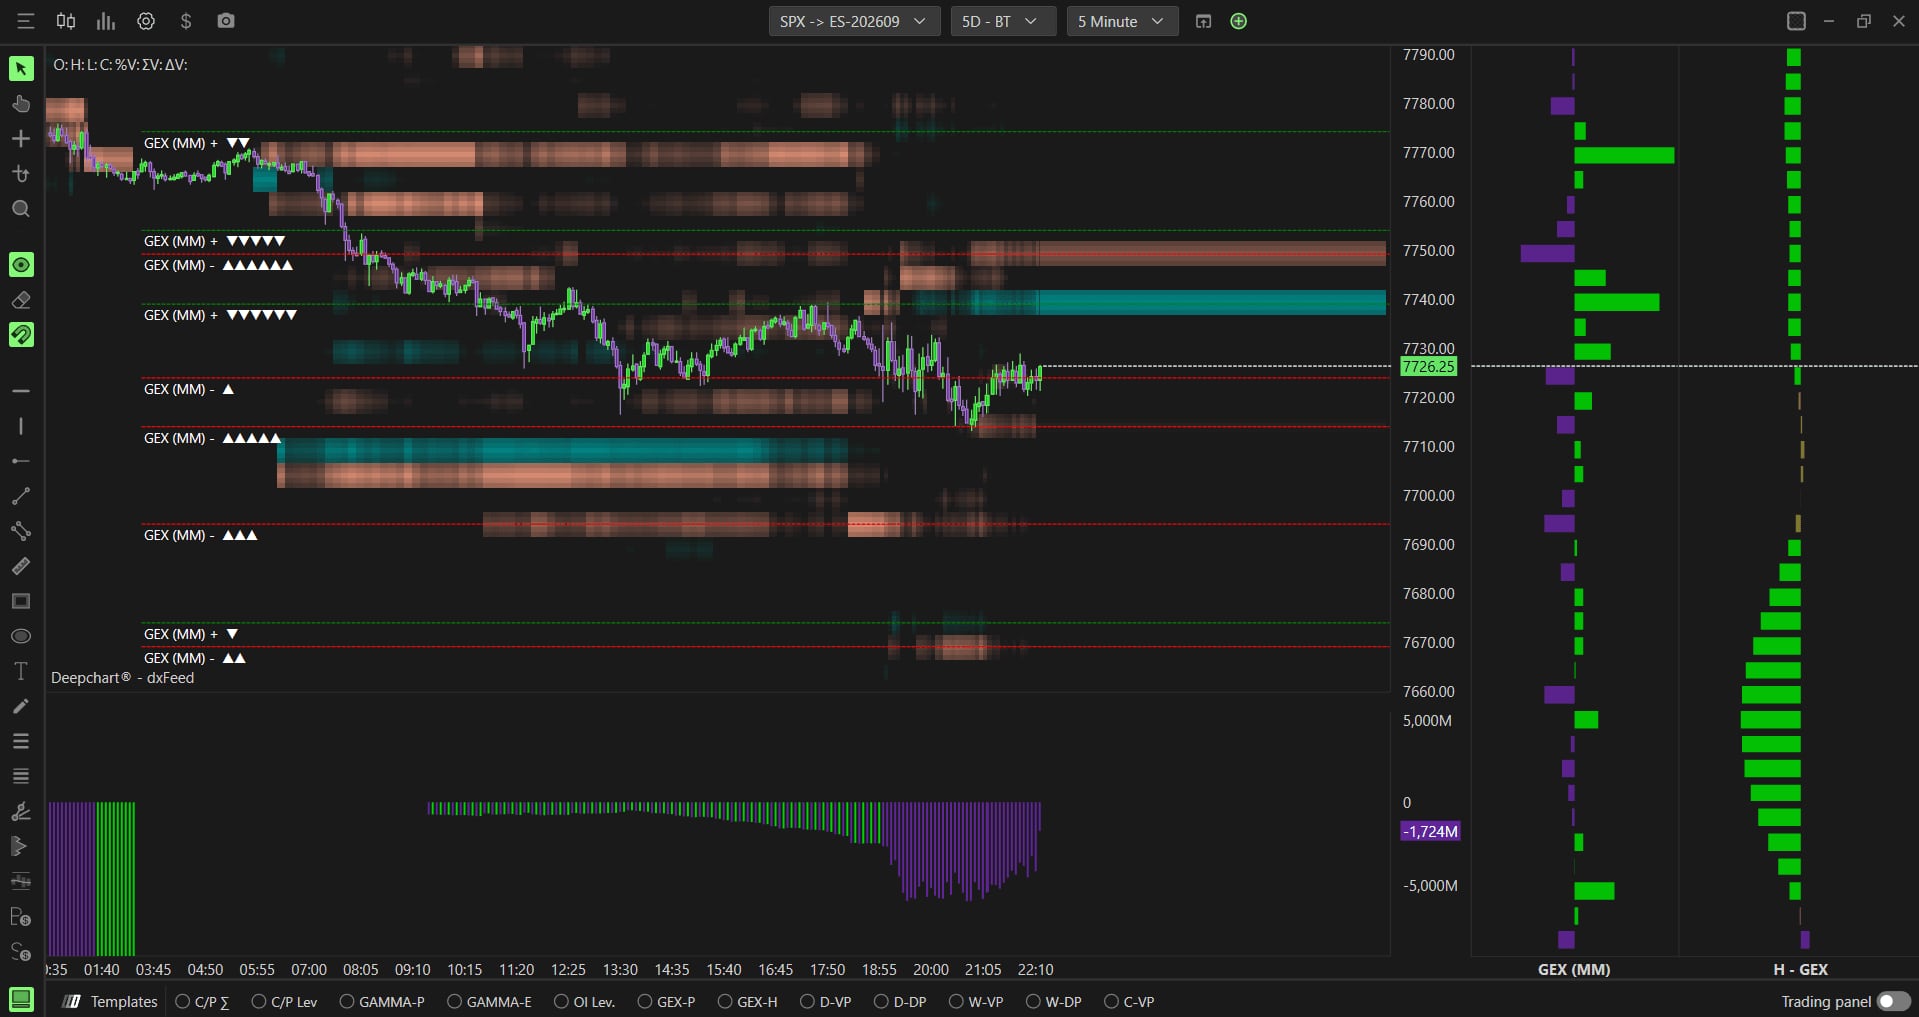
Option Levels Advanced layered with a heatmap, two GEX profiles on the right and an oscillator below price.© DeepCharts
Settings, tab by tab
The only tab that changes the data being read rather than how it is displayed.
Market maker gamma exposure as reported by Cboe.
Separates dealer activity from overall market activity.
Computed by DeepChart from the Cboe flow, without waiting for the official end of day figure.
Directional hedging pressure rather than gamma sensitivity.
Structural view, less driven by today's volume.
0 DTE, <= 1d, <= 7d, <= 31d, <= 91d, All expirations.
Adds open interest carried over from previous sessions.
How many strikes around price are included; 0 means all.
How many previous sessions the levels extend across.
How many levels are drawn and ranked by the triangles.
None, Till interaction or Till end window.
Custom text added to the labels.
Labels of previous sessions aligned to the right.
Same for the current session.
Positive levels, downward triangles.
Negative levels, upward triangles.
Zero Gamma line, independent of Number of levels.
⚠ Traps to avoid
- Looking for the indicator on an NQ or NDX chart. Option Levels Advanced needs Cboe participant data and only works on SPX: an NQ or MNQ trader will never see it appear, whatever the settings.
- Mixing up Option Levels Advanced and Option Levels. The standard version relies on volume or gamma assumptions; the Advanced one on real market maker data. According to the help center, the gap shows most around 0DTE and OPEX, when naive GEX calculations break down.
- Treating a level as guaranteed support or resistance. The reaction depends on the side price approaches from and which side of the market the level represents: watch for a slowdown, a reversal or an acceleration, not an automatic bounce.
- Raising Number of levels to see everything. The triangles rank levels against each other: the more you show, the more the ranking dilutes and the more dashed lines pile up on your ES chart.
FAQ
What do the triangles next to the levels mean?+
They rank each level's strength against the other displayed levels: more triangles means a stronger concentration at that strike. Downward on a green line for a positive level, upward on a red line for a negative one.
Does the Zero Gamma line depend on Number of levels?+
No. It is always drawn, yellow by default, and marks the single price where market maker gamma exposure flips from positive to negative. Above it the market tends to be calmer and more compressed; below it, more volatile and directional.
How is it different from the GEX Profile?+
The data sources are very close, but the GEX Profile shows the whole distribution as a histogram on the right edge of the chart, while Option Levels Advanced keeps only the strongest levels, drawn as lines on price. They complement each other: the level to react to, the profile to judge its weight.
Why did my levels move after a settings change?+
Each label depends on the Data source and the Expiration filter. Switching from All expirations to 0 DTE, or from Gex (Market Maker) to OI (R.T.), recomputes the levels: keep one stable combination so you can compare sessions.
Want to get better at order flow?
We discuss flow, liquidity and our trades live, every day, on the OrderFlowFutures Discord. Join us, it's free.
Join the Discord for free9 online·82 members·Free · instant access