Published
Option Envelopes Advanced draws the same three levels as Gamma Bands, Zero Gamma, Major Gamma and Minor Gamma, but computes them from real time open interest derived from Cboe market maker data rather than from volume. It requires the DeepGamma module and an SPX option chart. This tutorial walks through both settings tabs and what changes compared with the simple version.
- An active DeepGamma module: it is licensed separately from DeepChart, and without it option indicators do not show up
- An SPX option chart opened through New then Option Chart (symbol ES-CME, exchange CME): unlike Option Envelopes, the Advanced version does not exist on NDX, QQQ or SPY
Step by step
- 01
Open an SPX option chart
Go to New in the top menu, then Option Chart, and pick the SPX row, symbol ES-CME, exchange CME, in the Select Instrument box. That is the first difference from Option Envelopes (Gamma Bands): the simple version accepts NDX, QQQ, SPY and SPX, the Advanced version SPX only, because it needs real Cboe participant data. If you trade NQ or MNQ, the simple version on an NDX or QQQ chart is the one you want.
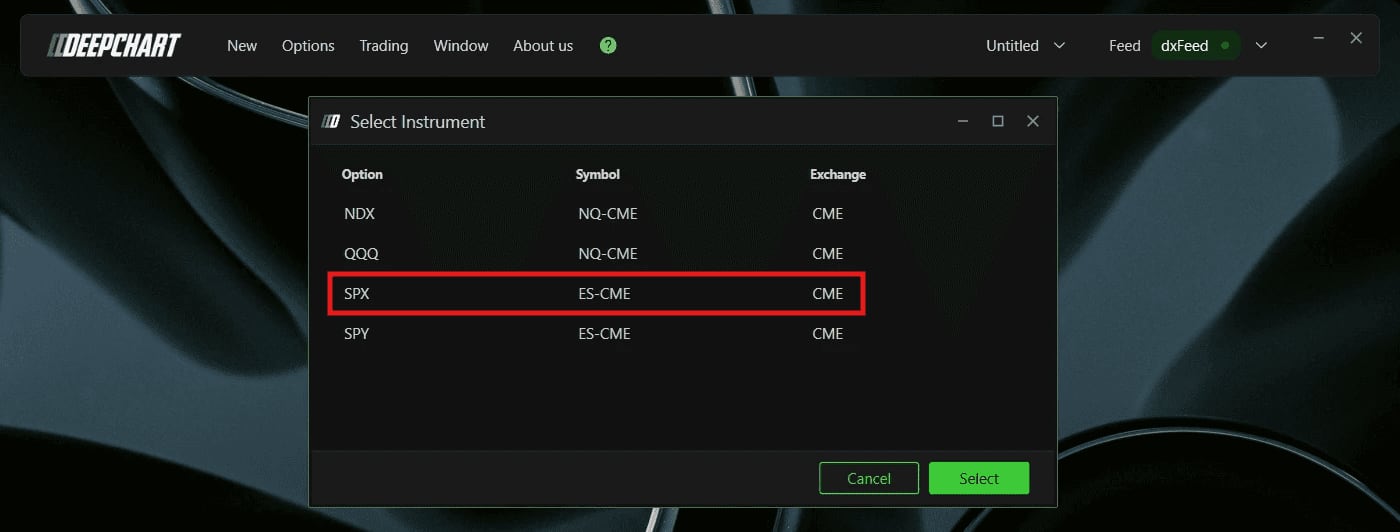
The Select Instrument box with the SPX, ES-CME, CME row highlighted.© DeepCharts - 02
Add Option Envelopes Advanced
Click Indicator Add in the toolbar, type Option Envelopes Advanced in the search box, add it with the plus button, then open the settings icon next to the added line. In the left hand list, the indicator sits under the Deep Gamma (CBOE) category, separate from Deep Gamma: that is where the versions reading Cboe data live. The window keeps the layout you already know from Gamma Bands, two tabs named Parameters and Subgraphs, topped by the Chart area row and the Use sec. axis switch.
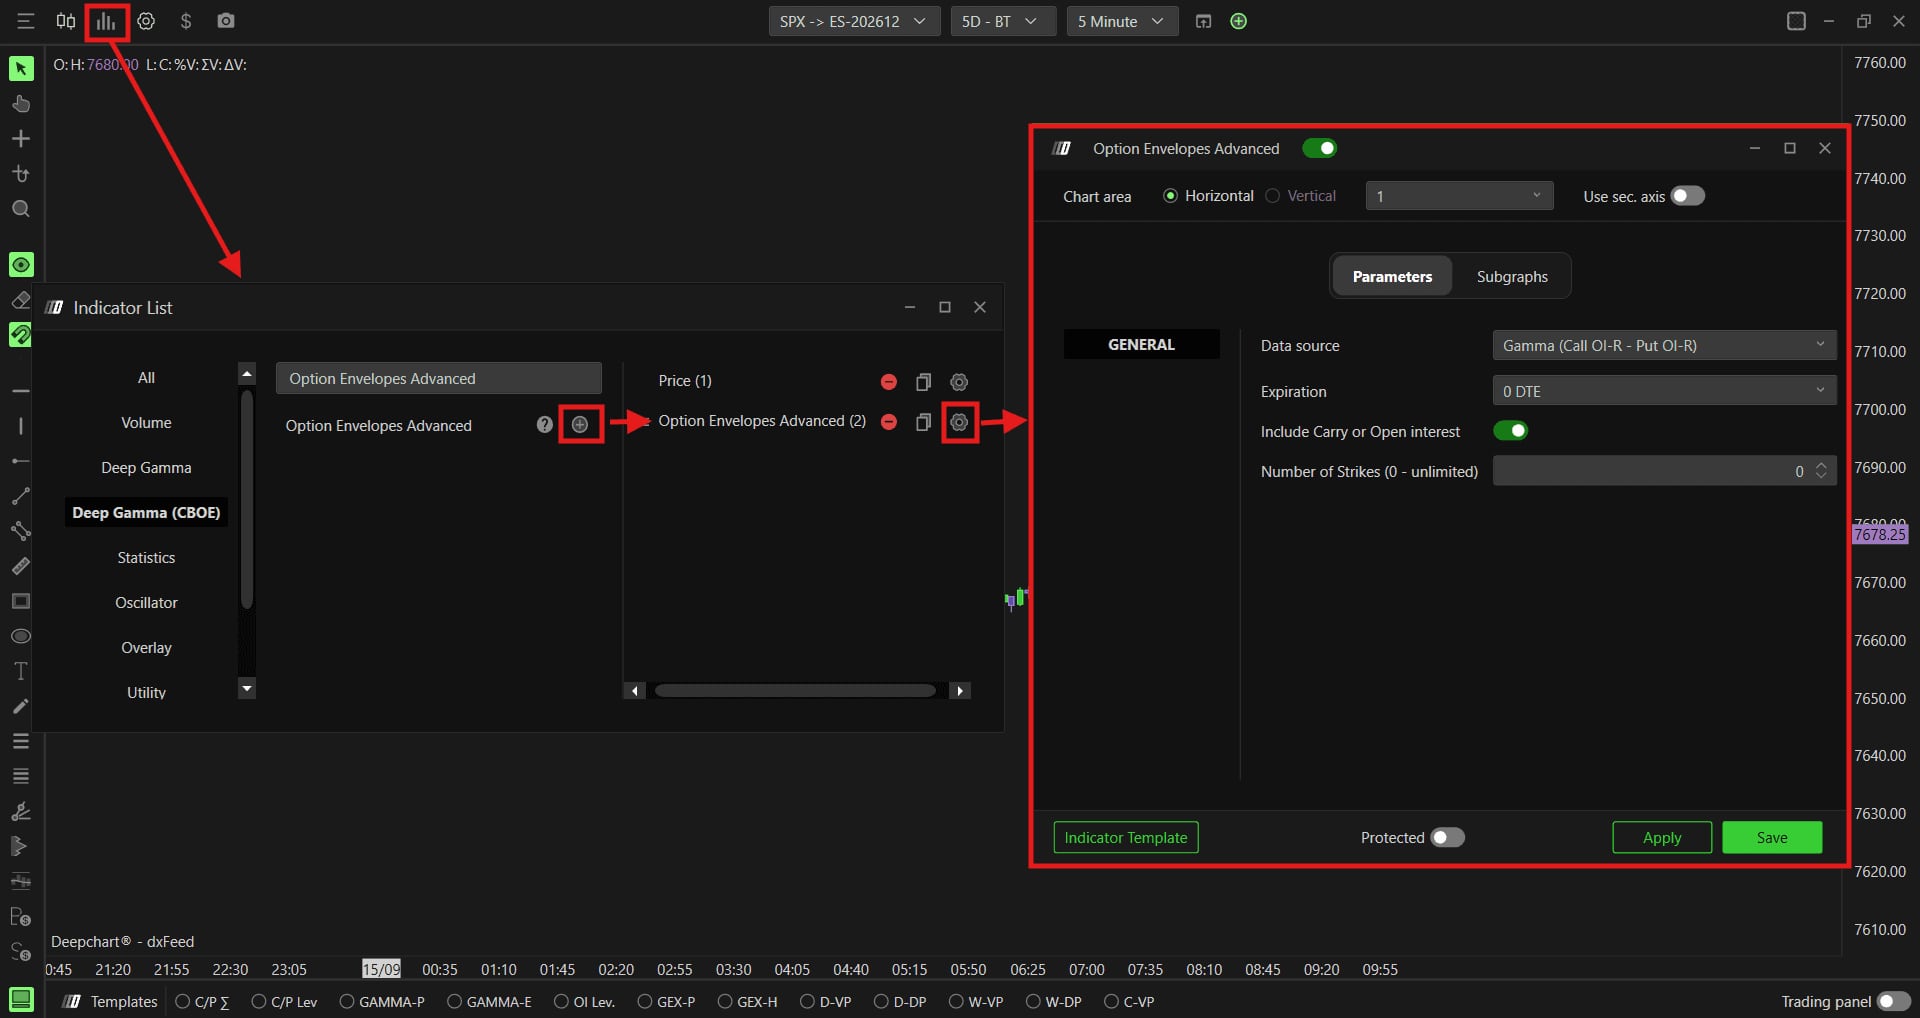
The indicator list on Deep Gamma (CBOE) with Option Envelopes Advanced added and its settings window open.© DeepCharts - 03
Pick the data source
This is the core difference from the simple version. Where Option Envelopes offers Gamma volume, Call put and Open interest eod, the Advanced version offers only two sources, both real time. Gamma (Call OI-R - Put OI-R), the default, multiplies real time call and put open interest by gamma: a gamma weighted read of the positions actually in place, rather than an estimate drawn from the day's activity. OI (R.T.) shows real time open interest alone, unweighted, to see where positions are concentrated live. Official open interest is only published at the end of the day: OI-R is DeepChart's intraday calculation from the Cboe buy and sell flow.
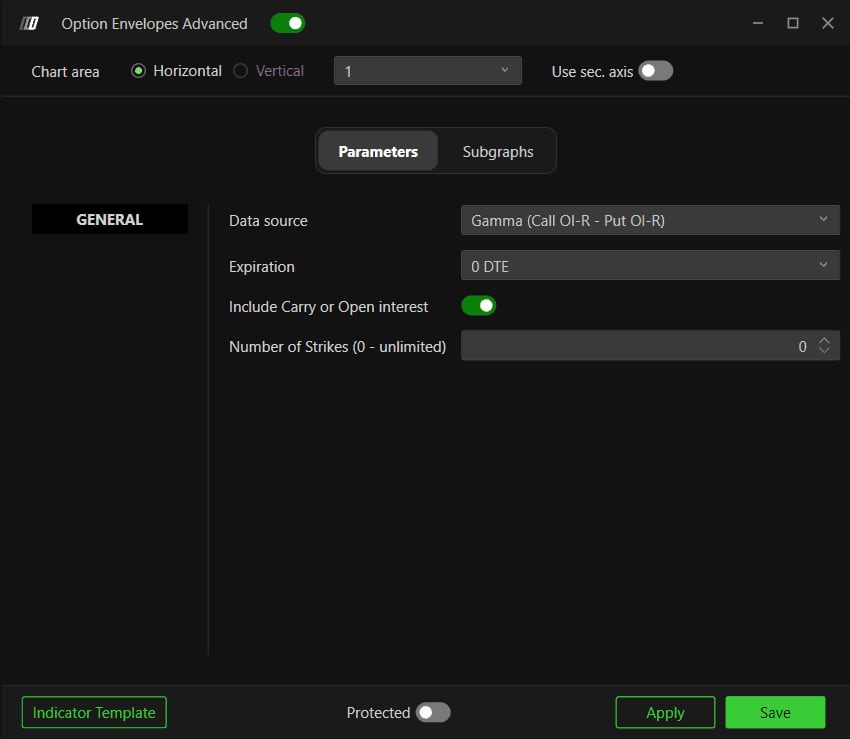
The Parameters tab with Data source on Gamma (Call OI-R - Put OI-R), Expiration on 0 DTE and Include Carry or Open interest on.© DeepCharts - 04
Check expiration, carry and strike count
The defaults are not those of the simple version, and that is the trap when you switch between them. Expiration starts on 0 DTE (versus All expirations in Option Envelopes), with the same choices from <= 1d to All expirations. Include Carry or Open interest is on by default (versus off): open interest carried from earlier sessions enters the calculation. Number of Strikes (0 - unlimited), missing from the simple version, limits the calculation to strikes near price; zero, the default, takes them all. If you want to compare the two indicators side by side, align these settings first, or you are comparing two different expirations.
Screenshot to comeExpiration on 0 DTE, Include Carry or Open interest on and Number of Strikes at 0.
- 05
Configure Zero Gamma (1) in Subgraphs
Zero Gamma remains the key line: the price where dealer gamma exposure flips from positive to negative, computed here from real time open interest. Above it dealers are long gamma and dampen moves; below it they are short gamma and amplify them. It is gold yellow, Subgraph Style on Line (or Hidden), Auto Color on None (Slope and +/- available), Line Style Solid, Line Width one. You also get Short Name and the Name Label, Value Label, Name Background, Value Background switches, plus Chart color for marker, and Include on Auto Center off: leave it that way so your price scale is not squeezed.
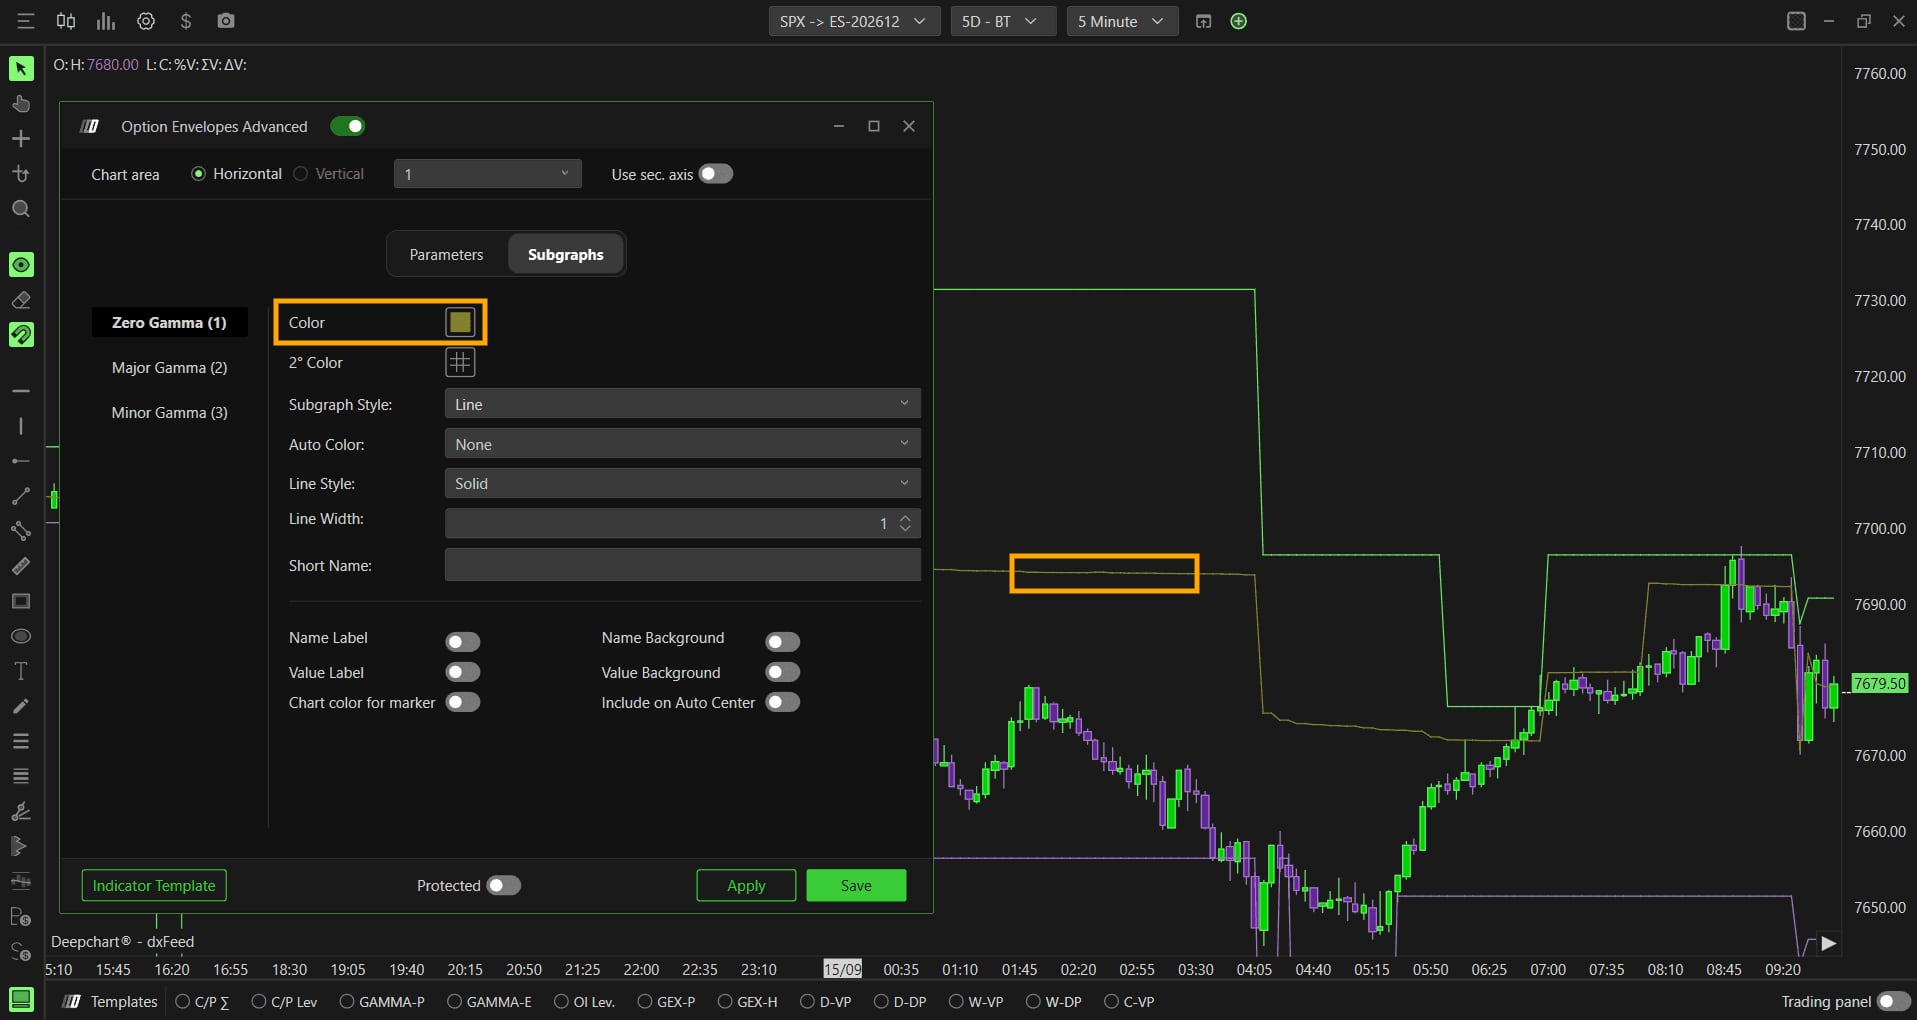
The Zero Gamma (1) series in the Subgraphs tab, gold yellow, with the line highlighted on the chart.© DeepCharts - 06
Configure Major Gamma (2)
Major Gamma marks the highest concentration of dealer gamma exposure above the current price, based on real time open interest: where hedging is most likely to produce resistance or support. It is green. The help center lists BrokerLine as the default Subgraph Style (a line extended to the right edge with its price label), yet the article's screenshot shows Line: check what your version displays and pick BrokerLine if you want the level to stay visible as price moves away. Everything else matches Zero Gamma.
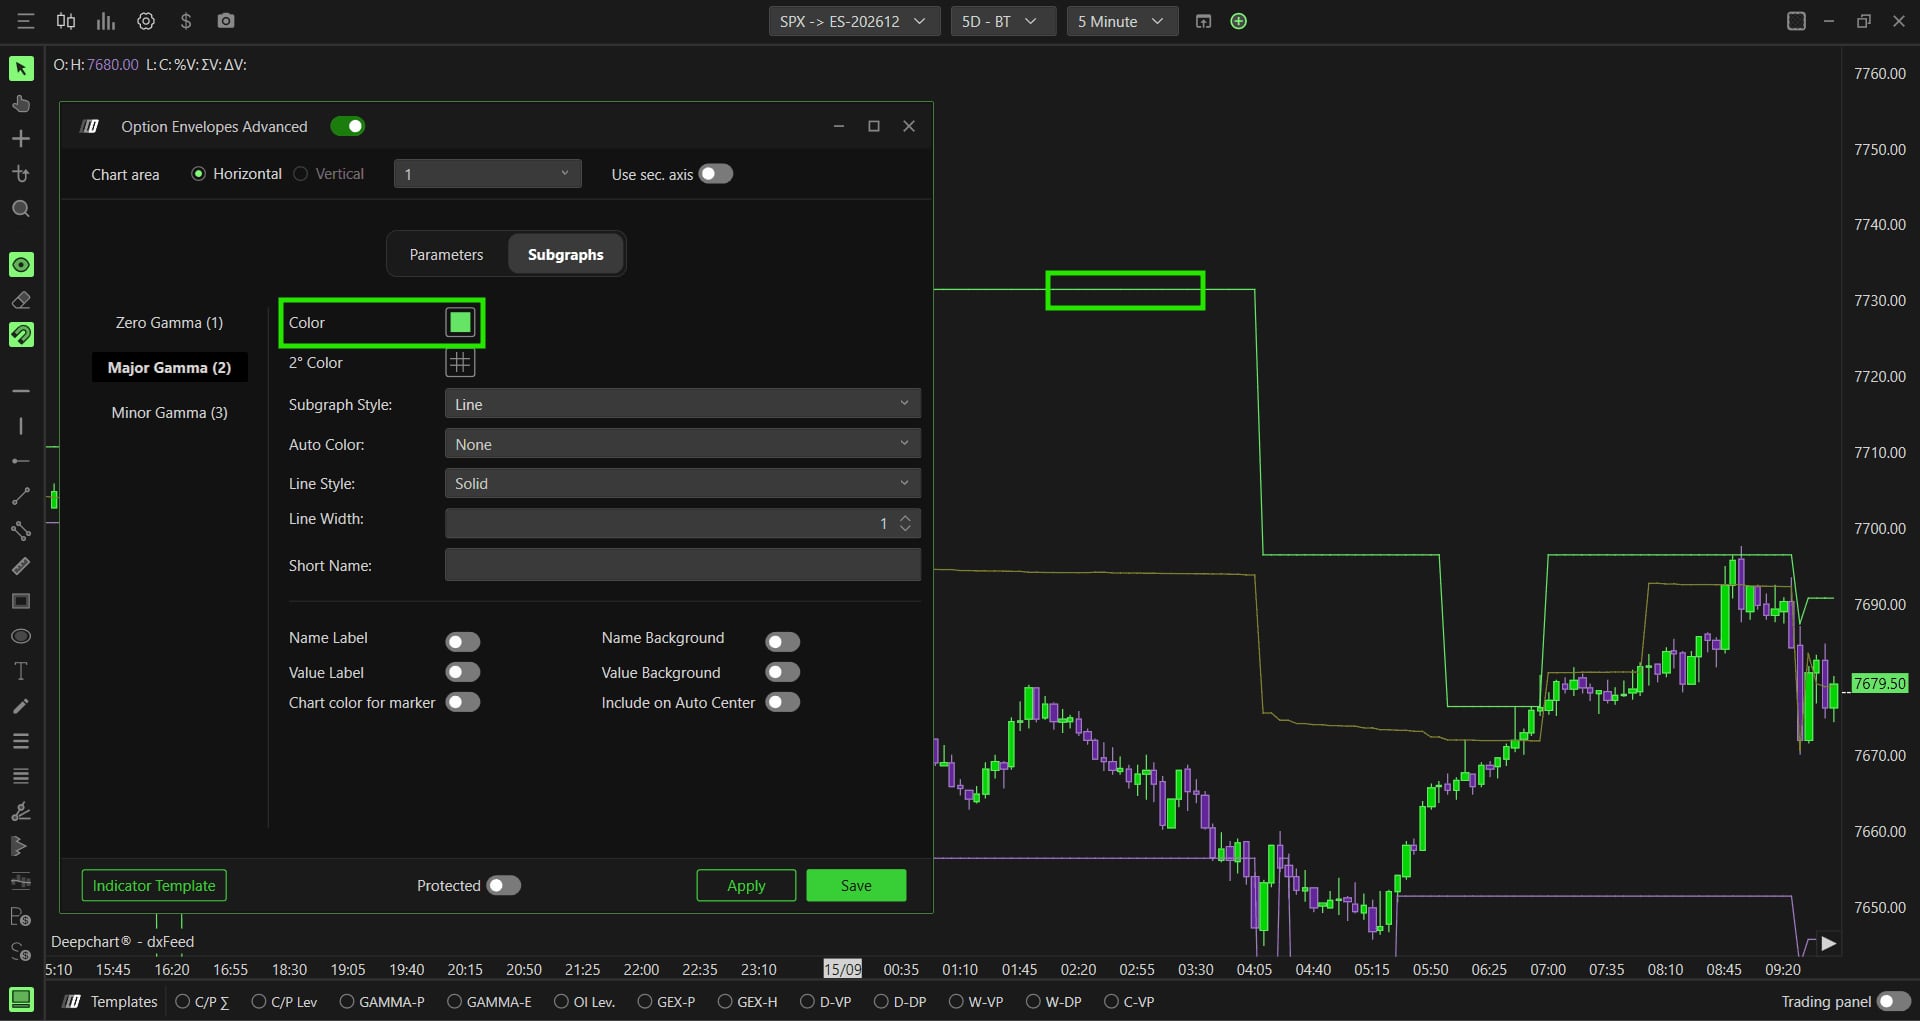
The Major Gamma (2) series, in green, with the matching line highlighted on the chart.© DeepCharts - 07
Configure Minor Gamma (3)
Minor Gamma marks the secondary concentration, in purple, with the same settings and the same caveat on Subgraph Style (BrokerLine in the text, Line in the screenshot). It is a softer level than Major Gamma, useful to spot intermediate reaction zones. If you display the simple version at the same time for comparison, change the color or Line Style of one set of lines: six overlapping yellow, green and purple lines quickly become unreadable.
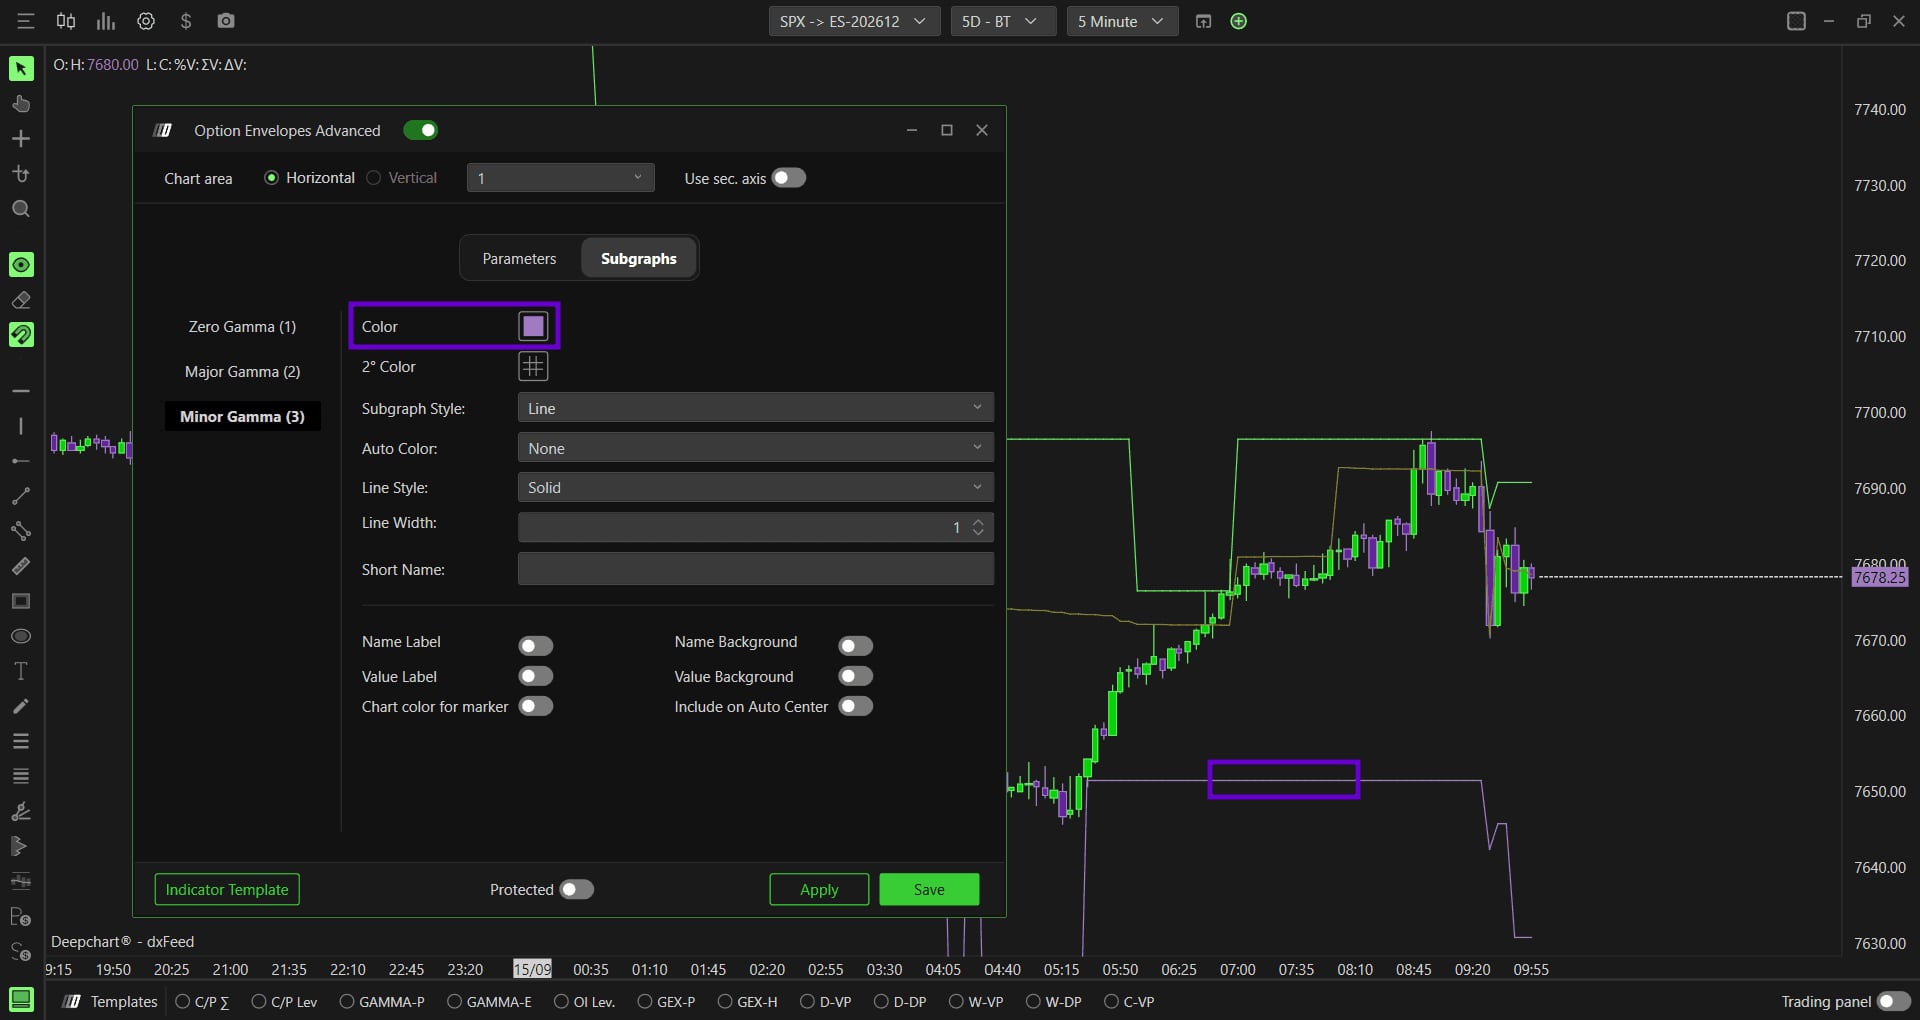
The Minor Gamma (3) series, in purple, with the matching line highlighted on the chart.© DeepCharts - 08
Read the three lines during the session
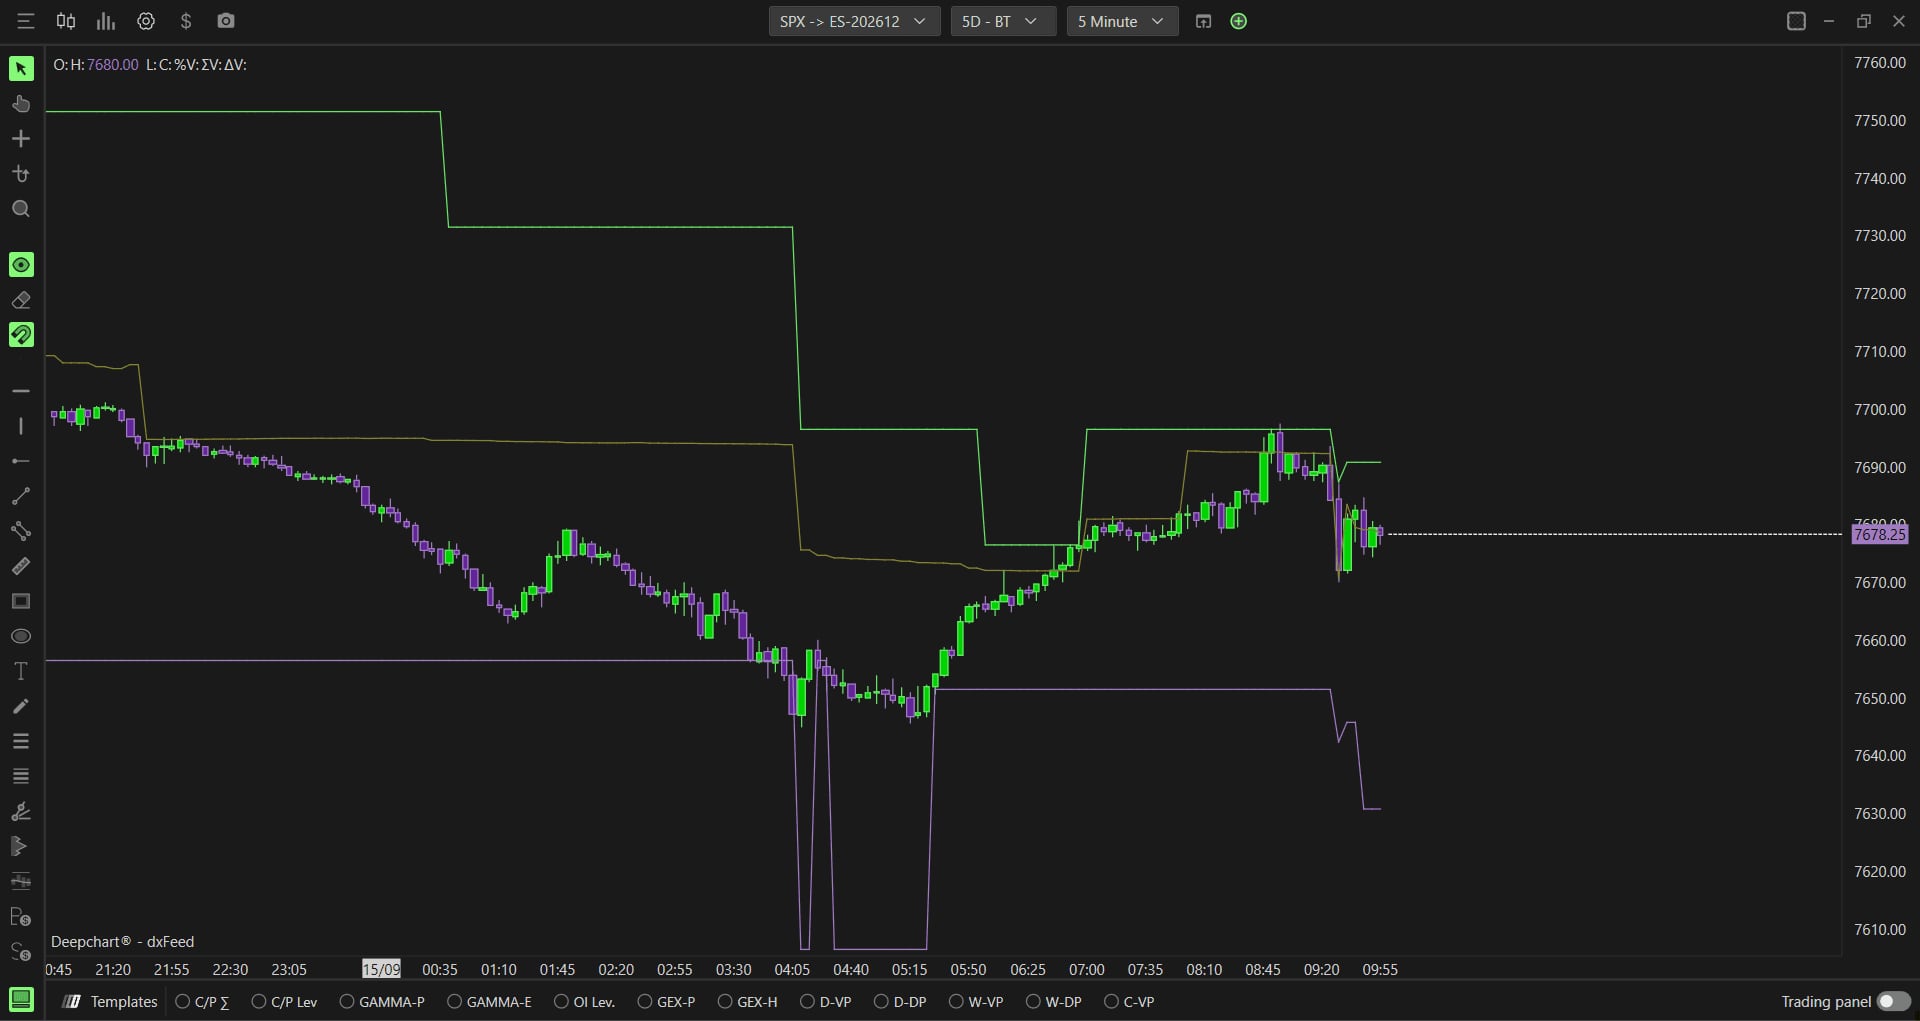
The read is the same as Gamma Bands, with a real time edge: the yellow line reflects positioning actually in place rather than an estimate drawn from trading. Price above Zero Gamma, dealers tend to be long gamma and the market calmer; a break below, dealers tend to be short gamma and the market can turn more volatile. The green Major Gamma lines are where real positioning is most concentrated, with the reaction depending on the direction price comes from and the regime; the purple Minor Gamma plays the same role to a lesser degree. Levels step around through the session as open interest changes. Help center tip: run the simple version alongside, since a clear divergence between the volume read and the real positioning read is information in itself.
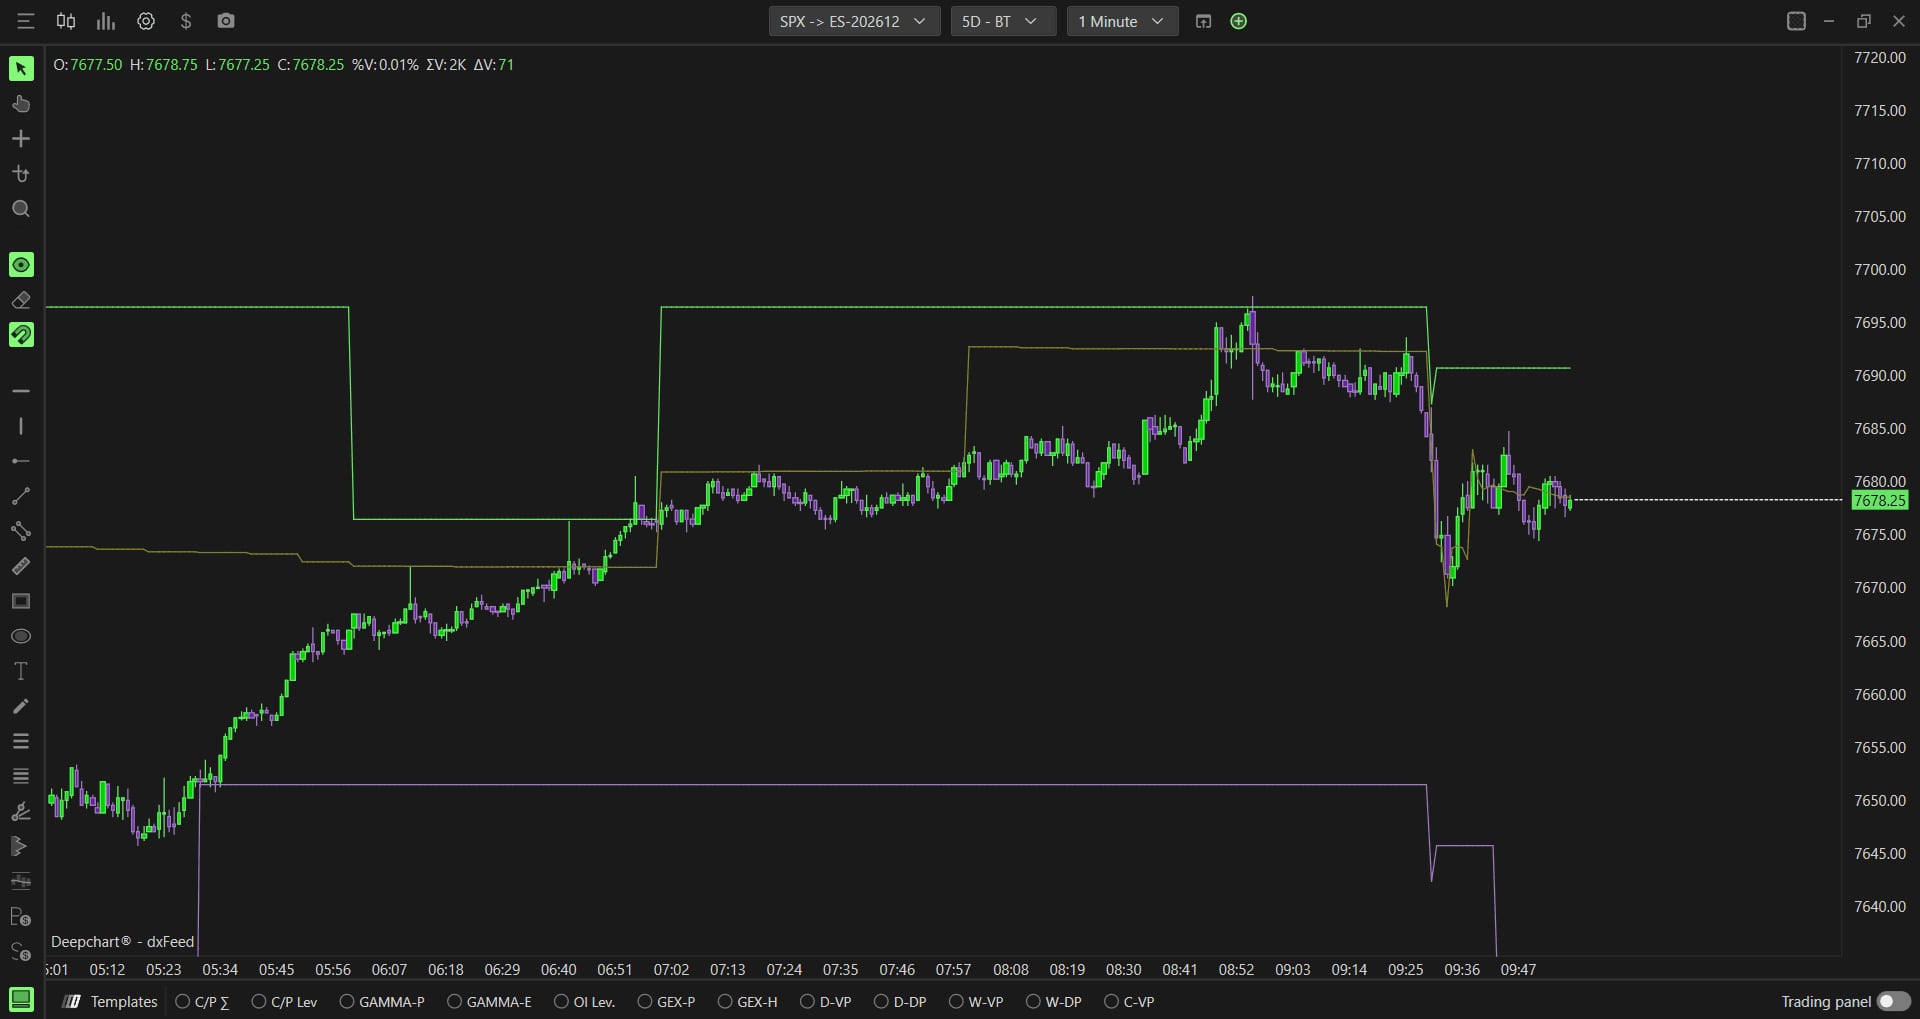
One minute SPX chart with price between Major Gamma in green, Zero Gamma in yellow and Minor Gamma in purple.© DeepCharts
Settings, tab by tab
The only settings that change the levels themselves.
Real time call and put open interest multiplied by gamma.
No gamma weighting: where positions are concentrated live.
0 DTE, <= 1d, <= 7d, <= 31d, <= 91d, All expirations. The simple version starts on All expirations.
Includes open interest carried from previous sessions. Off by default in the simple version.
Strikes included around price; 0 means all. Not available in the simple version.
The price where dealer gamma exposure flips from positive to negative.
Line or Hidden.
None, Slope or +/-.
Switches off in the screenshot.
Uses the chart color for markers.
Leave it off to keep your price scale.
The highest gamma concentration above the current price.
Line, Hidden or BrokerLine. The article's screenshot shows Line.
The secondary concentration, a softer level.
Line, Hidden or BrokerLine. The article's screenshot shows Line.
⚠ Traps to avoid
- Looking for the Advanced version on NDX or QQQ to trade NQ. It only exists on SPX; on the Nasdaq side, Option Envelopes (Gamma Bands) is the one to use.
- Comparing the simple and Advanced versions without aligning their settings. By default one runs All expirations without carry, the other 0 DTE with carry: the gap you see then comes from the settings, not the data.
- Expecting static lines. Computed from real time open interest, the levels step around during the session: a level noted in the morning may have moved by midday.
- Treating Zero Gamma as an entry point. It is the border where dealer hedging behavior flips, not a price where the market bounces: it changes your read of the regime, not your order.
FAQ
What is the difference between Option Envelopes and Option Envelopes Advanced?+
The three lines and how you read them are the same. The simple version computes them from volume (Gamma volume by default) and works on NDX, QQQ, SPY and SPX; the Advanced version computes them from real time open interest drawn from Cboe market maker data, and only works on SPX.
What does OI-R mean?+
Real-Time Open Interest: since official open interest is only published at the end of the day, DeepChart recomputes it intraday from the Cboe buy and sell flow. The Gamma (Call OI-R - Put OI-R) source combines it with gamma, OI (R.T.) shows it alone.
Why is the default expiration 0 DTE?+
That is how DeepCharts ships this indicator, while the simple version starts on All expirations. Narrowing to 0 DTE sticks to the day's hedging; widen to All expirations if you want a broader positioning view.
My Major and Minor Gamma lines do not reach the right edge, is that normal?+
The help center states BrokerLine by default, but its own screenshots show Line. If your lines stop at price, switch their Subgraph Style to BrokerLine to extend them to the right edge with their label.
Want to get better at order flow?
We discuss flow, liquidity and our trades live, every day, on the OrderFlowFutures Discord. Join us, it's free.
Join the Discord for free9 online·82 members·Free · instant access