Published
When DeepCharts slows down, lags behind the feed or disconnects, the platform gives you three tools to pin the problem down: the RAM indicator in the toolbar, the Diagnostic Report that measures machine and network, and date stamped log files. No technical prerequisite, just DeepCharts open. This tutorial shows how to read them and what to send support for a quick answer.
- DeepCharts installed and running, ideally while the problem is happening
- Access to Windows File Explorer to collect the log files
Step by step
- 01
Read the RAM indicator
Top right of the toolbar, the RAM indicator shows two numbers. The first is total system memory usage, the second, in brackets, is DeepCharts' own share. In the screenshot, RAM 91% (2%) tells the whole story: the machine is maxed out, but DeepCharts is not the one eating the memory.

The DeepChart toolbar with the RAM 91% (2%) indicator highlighted top right.© DeepCharts - 02
Free up memory if the total stays high
Sustained high total usage drags the platform down, whatever the number in brackets says. Close what runs alongside: browser tabs, another trading platform, screen recorders. If it is the bracketed number that climbs, DeepCharts itself is asking for too much: cut the number of charts open at once and mention it to support.
- 03
Open the Diagnostic Report
Click the ? icon in the toolbar, then Contact Support, and choose "I have a problem or delay with the platform". The Diagnostic window opens with a snapshot of your machine and connection.
- 04
Read the first part: machine and latency
The window lists the DeepCharts version, operating system, CPU name and usage (total and DeepCharts' share), total and used memory (system and DeepCharts), IPv4 and IPv6 connectivity, then ping to European and US servers. A high US ping weighs directly on a CME feed when you trade from Europe.
- 05
Confirm the full collection
Click the orange Click here to confirm banner. DeepCharts then adds location, VPN detection and Global, EU and US download speeds to the report. A red triangle next to a speed flags a weak value. No username or credentials are collected, as the window itself states.
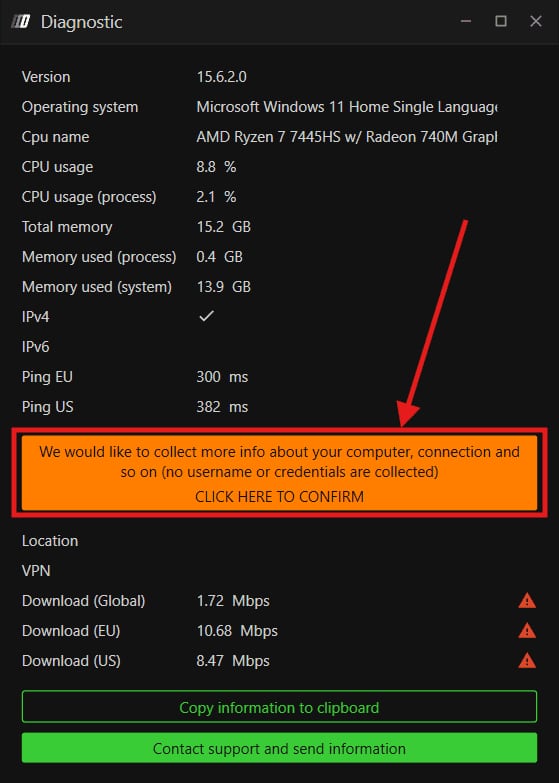
The Diagnostic window with the Click here to confirm banner, measured speeds and the Copy information to clipboard and Contact support and send information buttons.© DeepCharts - 06
Send the report to support
Contact support and send information sends the report straight to the DeepCharts team. Copy information to clipboard copies the same content so you can paste it into a ticket or email. Send it while the problem is happening: a diagnostic run the next day on an idle machine shows nothing.
- 07
Find the log files
In File Explorer: This PC, Documents, the DeepCharts folder (shown as Deepchart on screen), then Logs. If your Documents folder syncs with OneDrive, it may live under OneDrive instead of the usual location. You will find four families of files: general (overall activity), trade_copier (Trade Copier), trading (orders and executions) and various (everything else).
- 08
Attach the right day's logs to your ticket
Each file carries the date of its day, for example trading_2026-06-22. Attach the files dated on the day of the incident, not the whole folder: that is what lets the backend team find the event. Add a screenshot of the problem and two lines on what you were doing. A ticket from the deepcharts.com website is the fastest route; email to support@deepcharts.com takes a little longer.
Settings, tab by tab
Persistently high: close other applications.
If it climbs, cut the number of charts open at once.
? icon, Contact Support, "I have a problem or delay with the platform".
Support first checks you are up to date.
Whole machine, then DeepCharts' share.
Same reading as the RAM indicator, in absolute values.
Latency to each server region.
Speeds in Mbps; a red triangle flags a weak value.
To paste the report into a ticket.
Sends the report straight to support.
Documents, DeepCharts, Logs (or the OneDrive equivalent).
The key file for a rejected or badly filled order.
⚠ Traps to avoid
- Reading the first RAM number as DeepCharts' consumption. It is the system total; DeepCharts' share is the one in brackets, and the two call for different fixes.
- Running the diagnostic after the fact, on an idle machine. The report describes the present moment: run it during the slowdown, ideally at the US open if that is when things fall behind.
- Stopping before Click here to confirm. Without that confirmation the report has no download speeds and no VPN detection, the two most useful pieces of information for feed lag.
- Looking for logs in Documents when the folder is synced by OneDrive. They then sit under OneDrive; if in doubt, live support helps you locate them.
- Sending the whole Logs folder, or the wrong day's files. Only the files dated on the day of the incident let the team trace the event.
FAQ
What does RAM 91% (2%) mean in DeepCharts?+
The system is using 91% of its memory, and DeepCharts only accounts for 2%. The platform suffers from the saturation without causing it: the other open applications are what need closing.
Does the Diagnostic Report collect my credentials?+
No. It collects information about the machine and the connection (version, OS, CPU, memory, ping, speeds, location, VPN), and the window states that no username or credentials are collected.
Where are the DeepCharts log files?+
In Documents, DeepCharts folder, Logs subfolder. If your Documents folder syncs with OneDrive, the path goes through OneDrive. Files are named by type and date, for example trading_2026-06-22.
What should I send support to get a quick answer?+
The Diagnostic Report run while the problem was happening, the log files dated on the day of the incident, a screenshot and a short description of what you were doing. A ticket on the deepcharts.com website is the fastest route.
Want to get better at order flow?
We discuss flow, liquidity and our trades live, every day, on the OrderFlowFutures Discord. Join us, it's free.
Join the Discord for free9 online·82 members·Free · instant access