Published
DeepChart lets you place orders straight from the chart: through the trading panel on the right, or with a click thanks to the Chart DOM. Prerequisite: a connected trading account, SIM or broker. This tutorial covers enabling trading, the panel and Mini/Micro cross trading, every order button, the execution history, the Chart DOM and its click rules, then the order frequency limit.
- A trading account connected in DeepCharts (the SIM account is enough to test everything)
- A chart open on the instrument you trade, or on its Mini contract if you trade the Micro
Step by step
- 01
Enable trading on the chart
By default a chart is for analysis: you have to give it permission to send orders. Click the Dollar icon at the top left of the chart, or right click anywhere and choose Trading Enabled (shortcut Ctrl Alt T in the screenshot). It is set chart by chart: an analysis chart without trading enabled cannot receive an order by mistake.
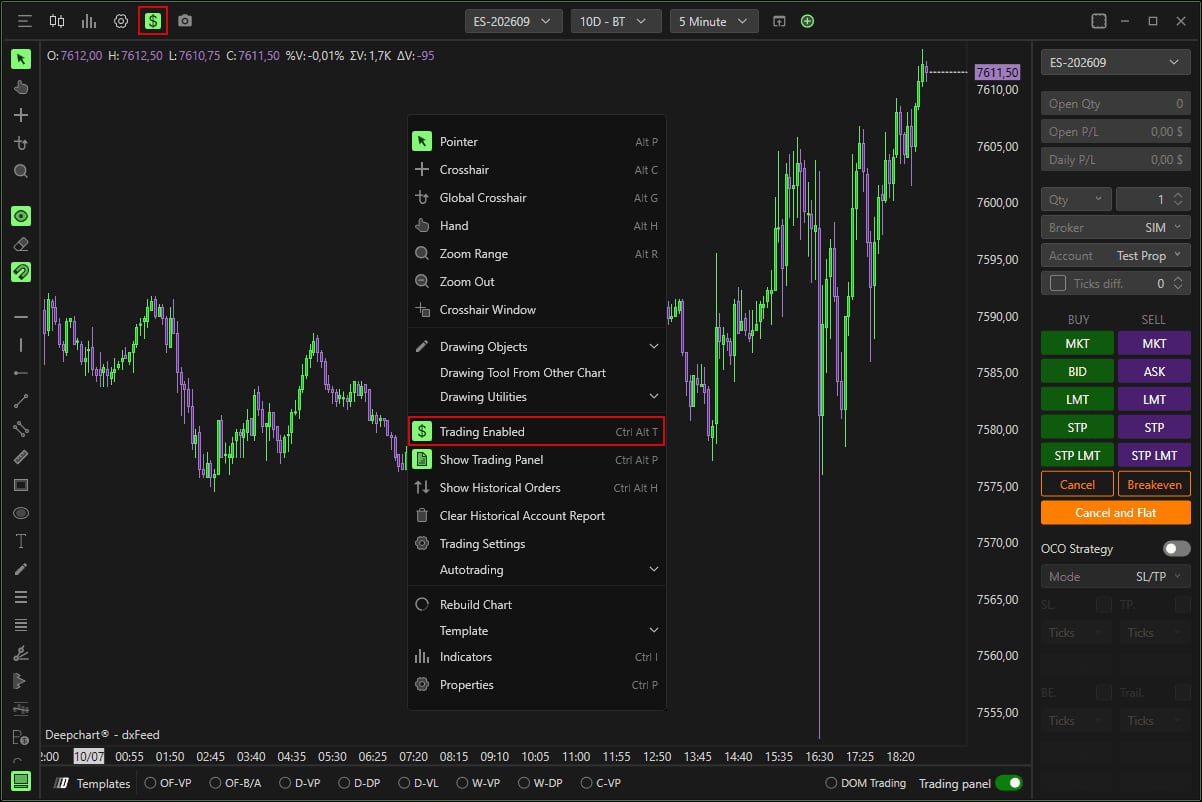
The right click menu of an ES chart with Trading Enabled highlighted, and the Dollar icon highlighted top left.© DeepCharts - 02
Show the trading panel
Turn on the Trading panel switch at the bottom right of the chart, or right click and pick Show Trading Panel. The panel opens on the right side: it carries the traded instrument, quantities, account and every order button. Without it you can still trade with a click through the Chart DOM, but you lose sight of your position and your P/L.
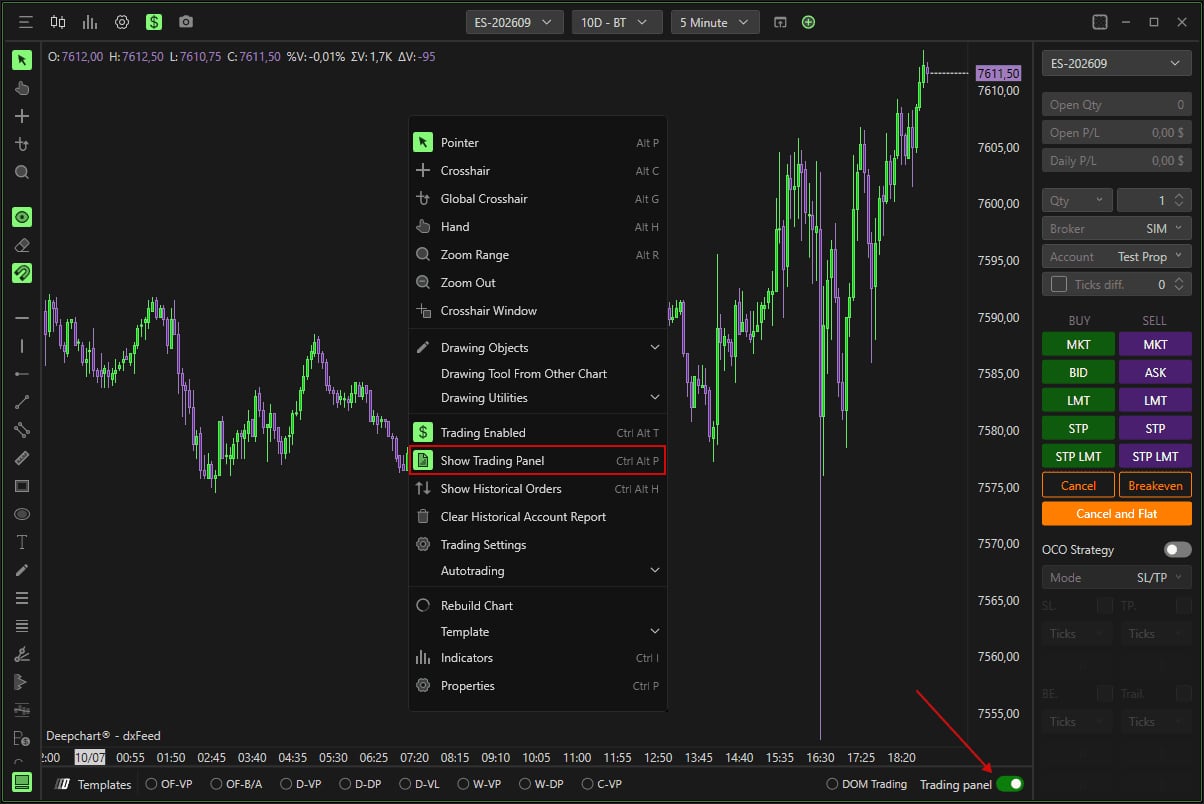
The right click menu with Show Trading Panel highlighted, and an arrow to the Trading panel switch.© DeepCharts - 03
Pick the traded instrument: Mini/Micro cross trading
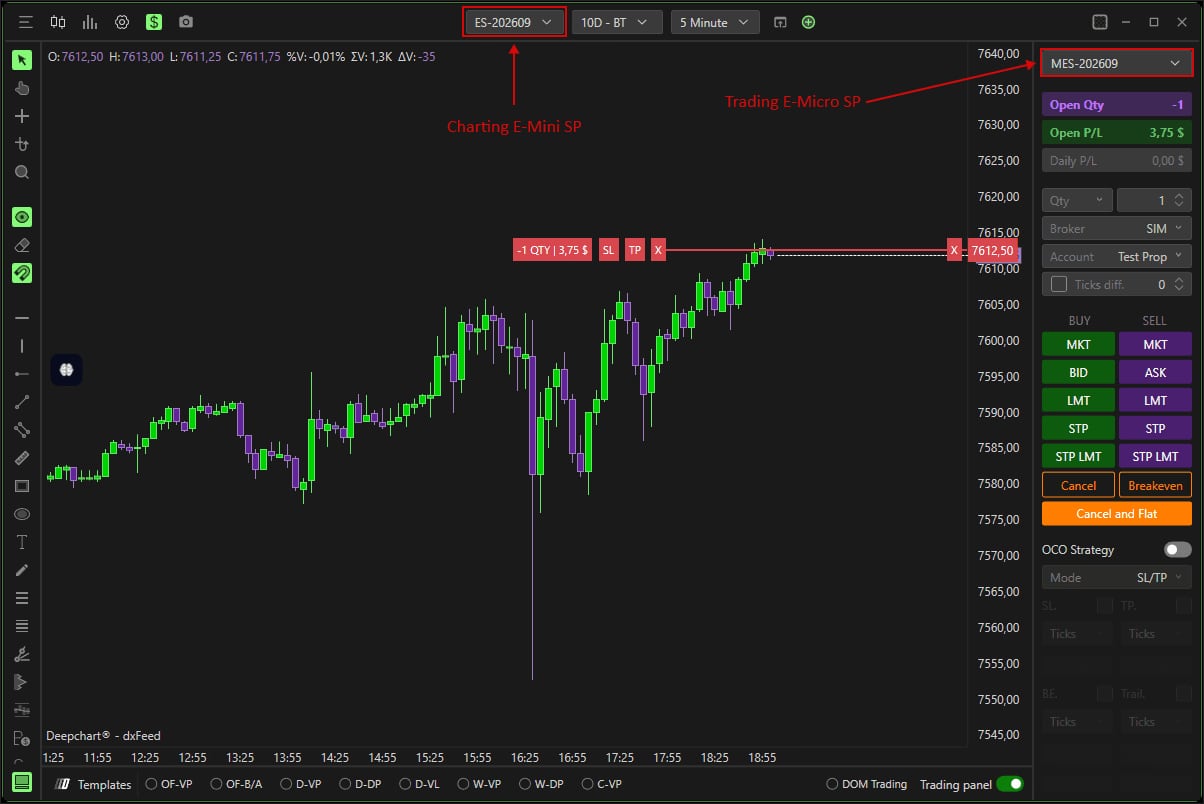
The list at the top of the panel sets the instrument orders go to, independently of the chart's. That is what lets you read ES and trade MES, or read NQ and trade MNQ, without opening a second chart: the opening screenshot shows an ES-202609 chart with the panel set to MES-202609. Keep your analysis on the main contract, which carries the real volume and the real order flow read. Below the list, three lines to watch: Open Qty (open contracts), Open P/L (current position result) and Daily P/L (the day's result on the selected instrument).
- 04
Set quantity, broker, account and Ticks diff.
Qty sets the number of contracts per order. Broker and Account choose where and on which account the order goes: with several prop firm accounts connected, that is the line to reread before each session. Ticks diff. (Tick Diff in the documentation) offsets BID and ASK orders by a fixed number of ticks from the market when its box is ticked: set to 300, a click on BID places a Buy Limit 300 ticks below price instead of at the best bid.
- 05
Use the order buttons
Two columns, BUY and SELL. MKT sends a market order. BID and ASK rest a limit at the best bid or best ask. LMT places a custom limit, below the market to buy, above it to sell. STP places a stop that triggers a market order, above the market to buy, below it to sell. STP LMT triggers a limit instead of a market order: no slippage, but the risk of no fill if price runs through your limit. Cancel cancels every pending order, Cancel and Flat (FLAT in the documentation) closes the position and cancels everything. On the chart, a left click moves a limit or stop order, a right click cancels it. A Breakeven button also sits on the panel; the article does not cover it. Further down, OCO Strategy automatically ties a target and a stop to the main trade: when one fills, the other is cancelled.
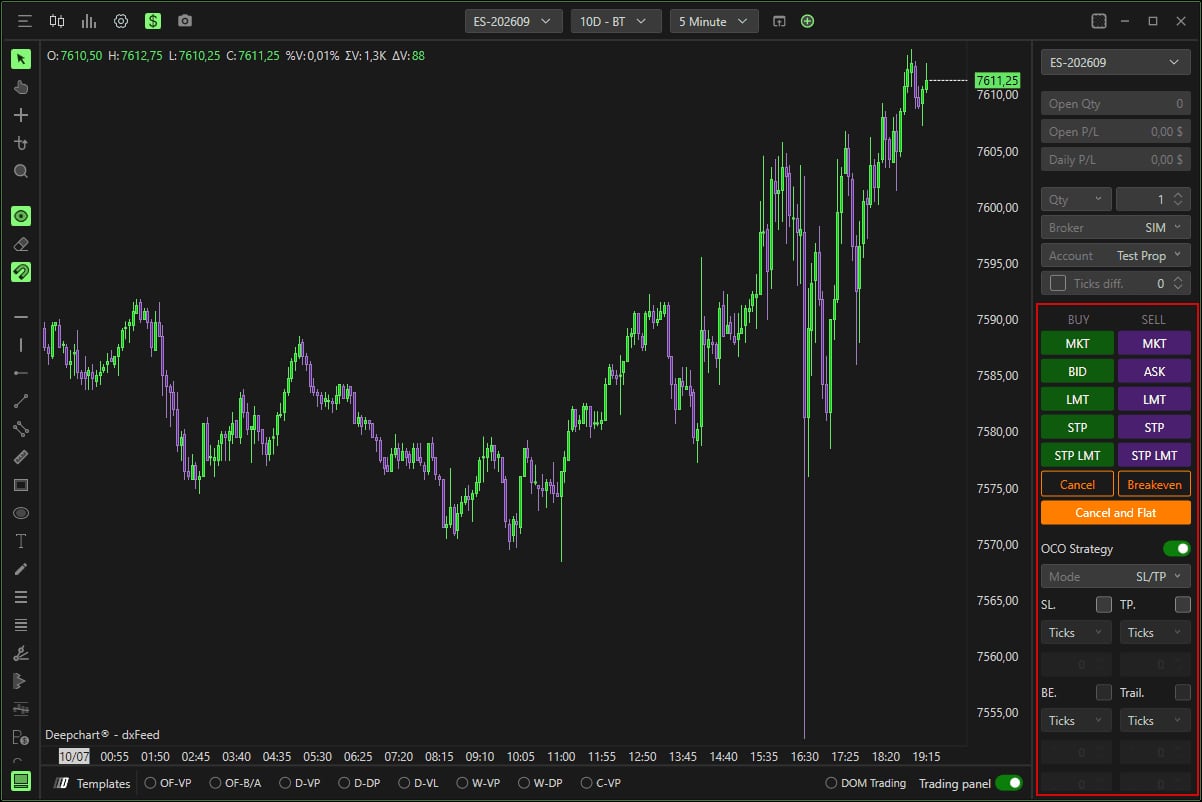
The trading panel with the BUY and SELL buttons, Cancel, Breakeven, Cancel and Flat and the OCO Strategy block highlighted.© DeepCharts - 06
Show the execution history
To review your entries and exits on the candles, turn on past executions. The documentation goes through the Settings icon and Show historical executions; in the screenshot the same feature sits in the right click menu as Show Historical Orders (Ctrl Alt H). It is the most direct review tool: you see where you got in relative to structure, not just your result. The same menu leads to Trading Settings, where order display, text size and colors are set.
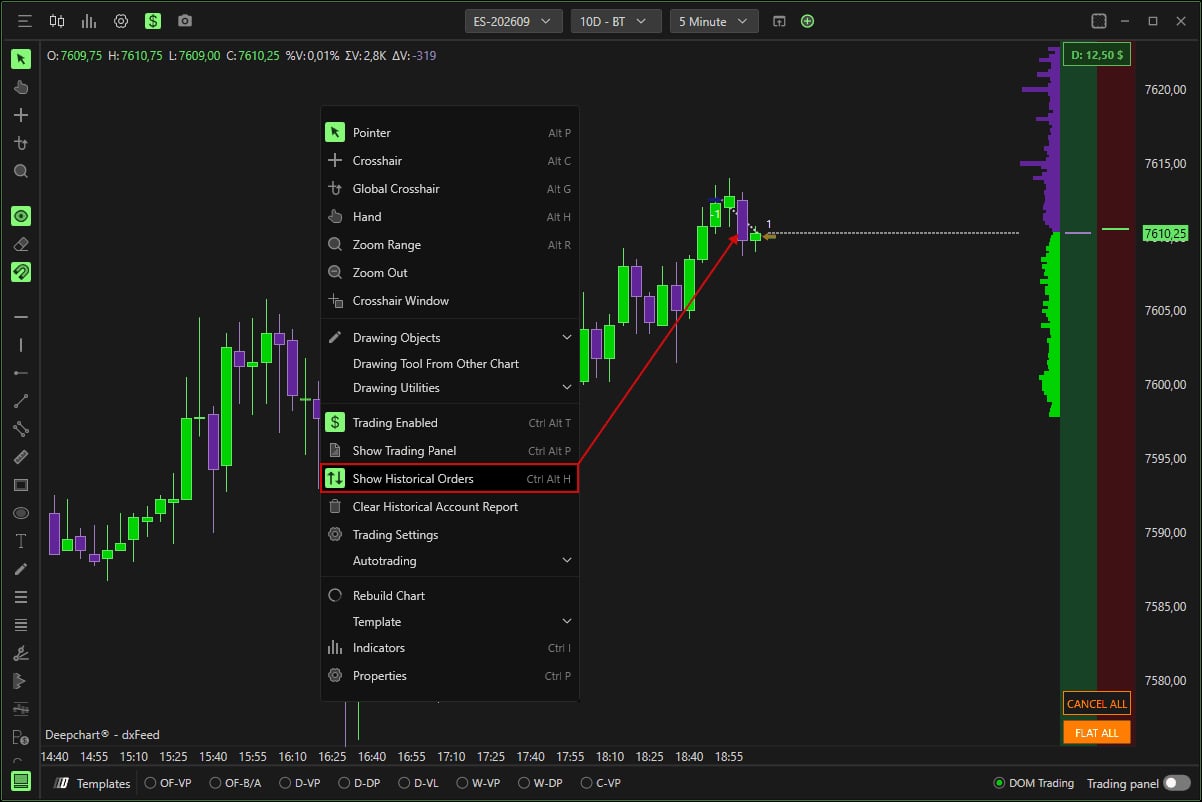
The right click menu with Show Historical Orders highlighted and an arrow to the execution markers on the candles.© DeepCharts - 07
Enable the Chart DOM
Tick DOM Trading at the bottom right of the chart: a price ladder appears along the axis, with market depth and, in the screenshot, CANCEL ALL and FLAT ALL buttons and the day's result at the top. The DOM Trading dropdown opens the Chart DOM settings window, organised in tabs on the left: CHART TRADING, DOM SETTINGS, TRADING COLORS, BID/ASK LINE and TEXT SETTINGS.
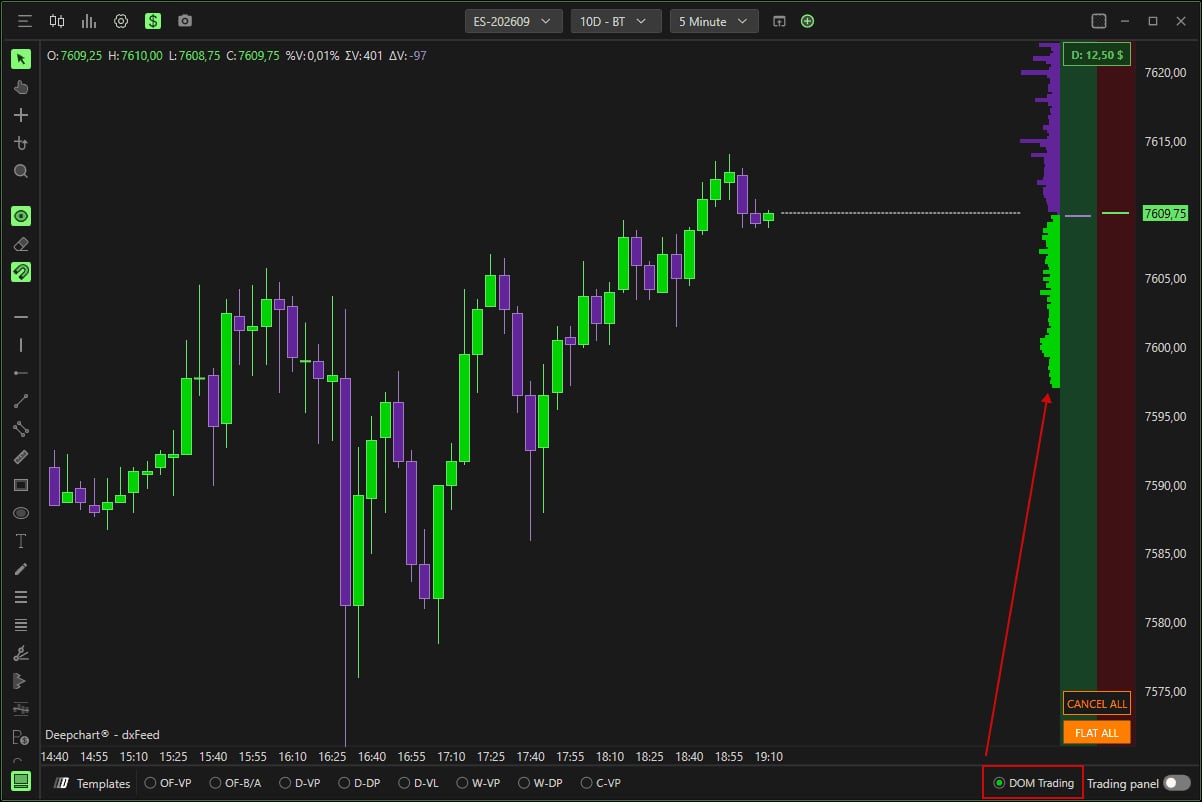
An ES chart with the Chart DOM on the right and DOM Trading highlighted bottom right.© DeepCharts - 08
Set up Chart Trading: which click does what
In the CHART TRADING tab, Enable chart trading allows click order entry and Chart trading width sets the column width (75 in the screenshot). Then come eight lists, one per combination of mouse button and position relative to the last price. By default, on the buy side, a left click below the last price places a Buy Limit and above it a Buy Stop; on the sell side, a left click above places a Sell Limit and below a Sell Stop. And in all four cases, a right click sends a market order. Each list offers Limit, Stop or Market: adapt them before trading live. The other tabs set the column colors (TRADING COLORS), the Bid/Ask line (BID/ASK LINE), depth display and colors (DOM SETTINGS) and text (TEXT SETTINGS).
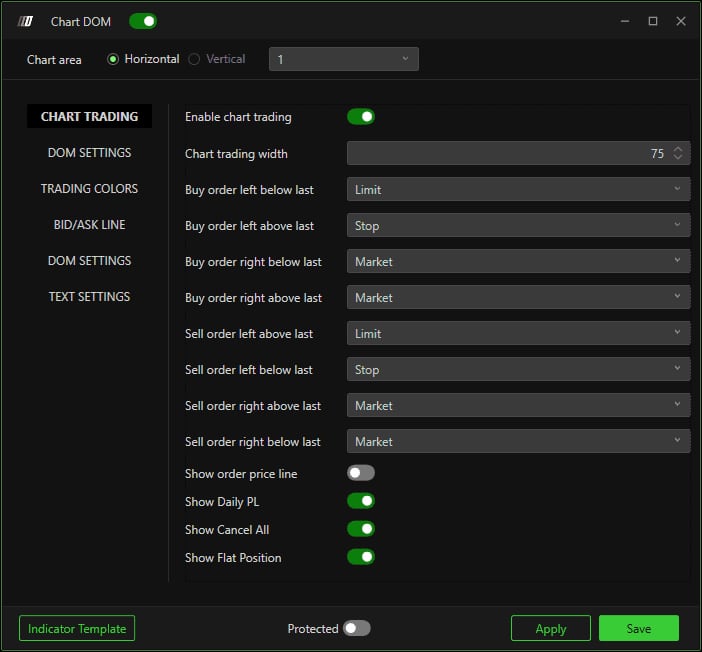
The Chart DOM window on the CHART TRADING tab, with Enable chart trading, Chart trading width and the eight click rules.© DeepCharts - 09
Cap the order frequency
Last setting, and not the least useful when you trade with clicks: protection against orders fired in bursts. It lives in Options, Settings, General tab, TRADING section. Frequency limitation - max orders per second sets how many orders are allowed per second (6 in the screenshot): beyond that, submission is blocked and an error notification appears. Frequency limitation - pause time (seconds) sets how long that block lasts (10 seconds in the screenshot). A nervous double click or a bouncing mouse no longer turns into five orders on NQ.
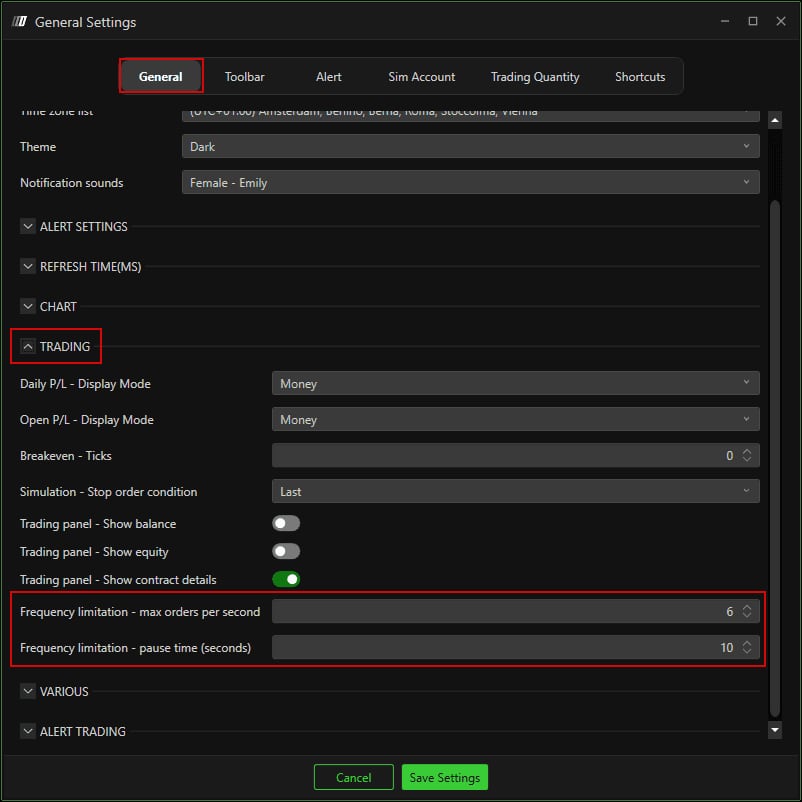
The General Settings window, TRADING section, with both Frequency limitation fields highlighted.© DeepCharts
Settings, tab by tab
Allows this chart to send orders. Ctrl Alt T in the screenshot.
Shows the trading panel on the right. Ctrl Alt P in the screenshot.
Independent of the chart: read ES, trade MES.
Contracts or shares currently open.
Result of the active position.
The day's result on the selected instrument.
Contracts per order.
Execution broker and account: reread it when several accounts are connected.
Offsets BID/ASK orders by a fixed number of ticks from the market.
Below the market to buy, above it to sell.
Above the market to buy, below it to sell.
Avoids slippage, with the risk of no fill.
Called FLAT in the documentation.
Ties a target and a stop to the main trade; one filling cancels the other.
Show Historical Orders in the right click menu in the screenshot (Ctrl Alt H).
Order display, text size, colors.
DOM Trading dropdown, bottom right of the chart.
Allows click order entry on the chart.
Width of the Chart DOM columns.
A right click buys at market.
A right click sells at market.
The first off, the other three on in the screenshot.
Colors of the Chart DOM columns.
Bid/Ask line on the chart.
Market depth display and its colors.
Chart DOM text, its color and appearance.
Beyond it, order submission is blocked and an error shows.
How long the block lasts after the limit is exceeded.
⚠ Traps to avoid
- Forgetting that a right click goes to market. With Enable chart trading on, all four right click combinations are set to Market by default: an absent minded right click on the chart opens a position at the current price. Change those lists if your right click habits go elsewhere.
- Trading the wrong account. Broker and Account are chosen in the panel: with a SIM account and several prop firm accounts connected, an order can go live when you thought you were testing, or the other way round. Reread the Account line before the session's first order.
- Mixing up the chart's instrument and the panel's. An ES chart with the panel on MES is intended; an NQ chart with the panel left on NQ when you meant MNQ is ten times the planned size, since the Micro is a tenth of the Mini.
- Leaving Ticks diff. ticked. The offset applies to the BID and ASK buttons as long as the box is ticked: an order you thought was at the best bid lands dozens of ticks away from the market and never fills.
- Reading volume on the Micro. Cross trading is about trading the Micro while reading the Mini: order flow and volume based indicators belong on the main, more liquid contract.
- Turning the frequency limit off for comfort. The block rarely bothers a discretionary trader and guards against repeated clicks. Just remember that once the limit is crossed, order submission stays blocked for the pause: the article makes no exception for exit orders.
FAQ
Can I read the ES chart and trade MES?+
Yes, that is Mini/Micro cross trading: the list at the top of the trading panel picks the traded instrument independently of the chart's. You keep the analysis on the main contract and execute on the Micro without opening a second chart.
What is the difference between STP and STP LMT?+
STP triggers a market order once its price is reached: near certain fill, possible slippage. STP LMT triggers a limit order: no slippage beyond your limit, but the order can stay unfilled if the market runs through it without coming back.
Why did a right click on the chart open a position?+
Because Chart Trading is on and, by default, its four right click rules are set to Market, on the buy side below or above the last price as well as on the sell side. Open the Chart DOM window from DOM Trading, CHART TRADING tab, and swap Market for Limit or Stop, or turn Enable chart trading off.
Where do I set the orders per second limit?+
In Options, Settings, General tab, TRADING section: Frequency limitation - max orders per second and Frequency limitation - pause time (seconds). The documentation screenshot shows 6 orders per second and a 10 second pause.
Want to get better at order flow?
We discuss flow, liquidity and our trades live, every day, on the OrderFlowFutures Discord. Join us, it's free.
Join the Discord for free9 online·82 members·Free · instant access