Published
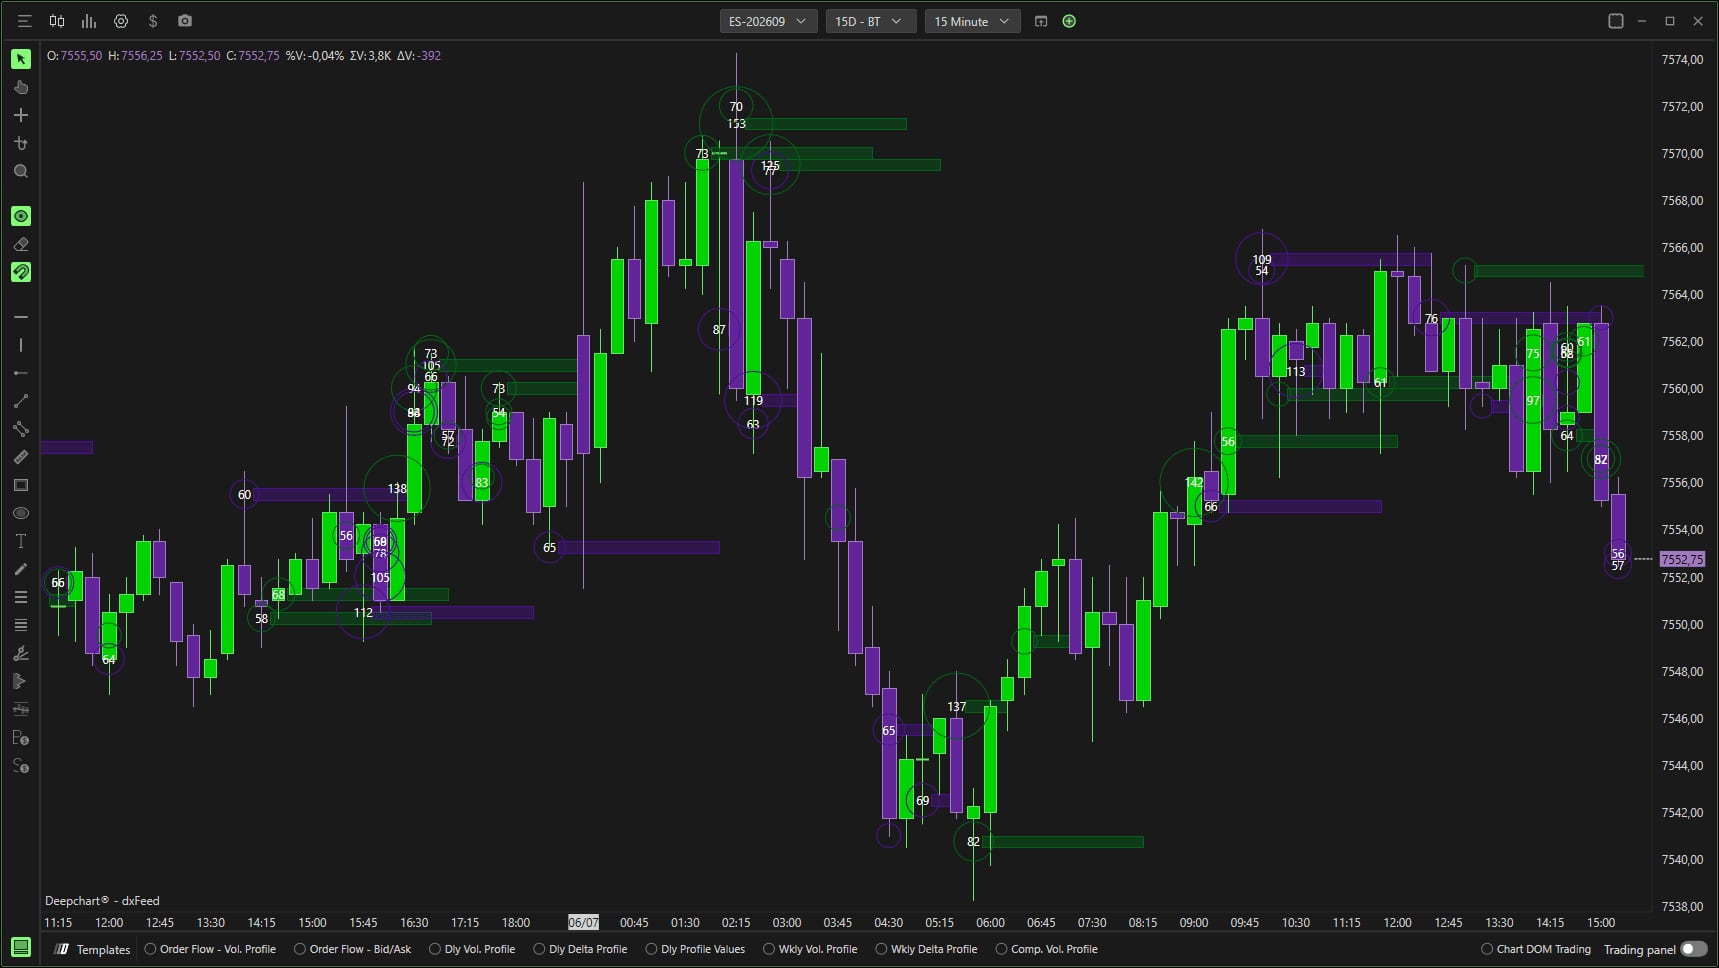
Big Trades plots large aggressive market orders on the chart as circles sized by volume, and can extend those levels into horizontal zones. It is the former Deep Trades, renamed in version 15.6, and it runs without MBO data. This tutorial covers Data Settings, Plot Settings, Zones Settings and the Big Trades Analysis procedure that computes automatic thresholds for each symbol.
- DeepChart installed with a data feed connected on the instrument you follow
- The Big Trades indicator added to the chart from the indicator list
- For Automatic mode: a Big Trades Analysis run at least once (step 6)
Step by step
- 01
Tell Big Trades and Deep Trades apart
Since version 15.6, the indicator formerly called Deep Trades has been renamed Big Trades. The Deep Trades name now belongs to a different indicator built on MBO (order by order) data, with its own tabs. Big Trades works from the aggregated trades of a regular feed: if your feed has no MBO, this is the one you want. Check the settings window title, it should read Big Trades.
Screenshot to comeA 15 minute ES chart with Big Trades: numbered circles on the candles and horizontal zones.
- 02
Set the source and history (Data Settings)
Open the indicator settings on the Data Settings tab. Chart area places the indicator on the chart (Horizontal by default). Days to load sets how many days of large trades are loaded, ten in the screenshot: the more you load, the heavier the chart is to recalculate. Input data picks the type of order flow data used, Aggregate trades by default, which groups the fills of a single aggressive order instead of counting them as small pieces.
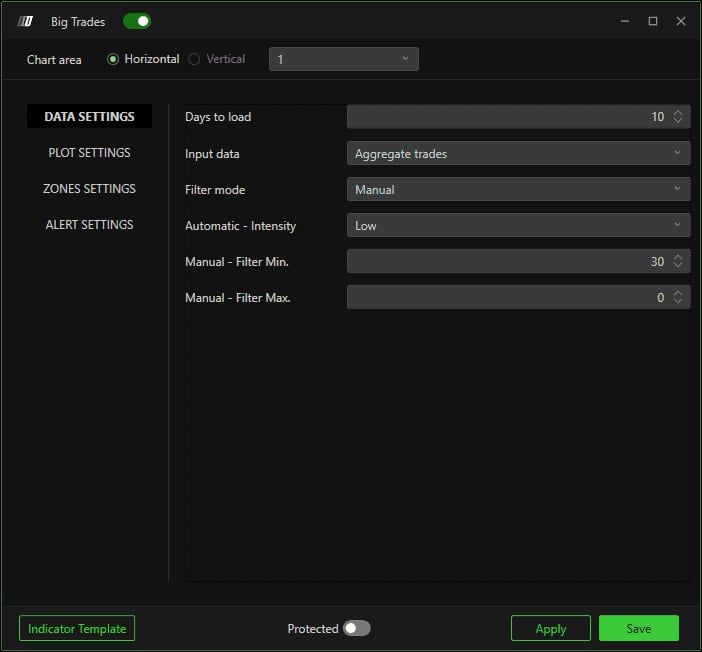
The Big Trades Data Settings tab with Days to load, Input data, Filter mode and the manual filters.© DeepCharts - 03
Set the threshold by hand (Filter mode Manual)
In Manual mode, Manual Filter Min. is the minimum trade size that gets plotted: at 30, only trades of 30 contracts or more appear. Manual Filter Max. caps the size from above, left at 0 in the screenshot. The right threshold depends entirely on the instrument: a filter tuned for ES lets almost nothing through on MNQ and floods the chart on a more liquid contract. Raise it until only a handful of bubbles remain per session.
- 04
Style the bubbles (Plot Settings)
Under General, Marker sets the shape (Circle), Hollow fill draws outlines with no fill, handy over a busy footprint, and Show text prints the trade size inside the bubble. Under Size, Standard Dev. spreads sizes between Minimum size and Maximum size: keep the default, as DeepCharts recommends. Under Color, the minimum and maximum opacities make the largest trades stand out, Ask color marks aggressive buyers and Bid color aggressive sellers. Text Settings only matter once Show text is on.
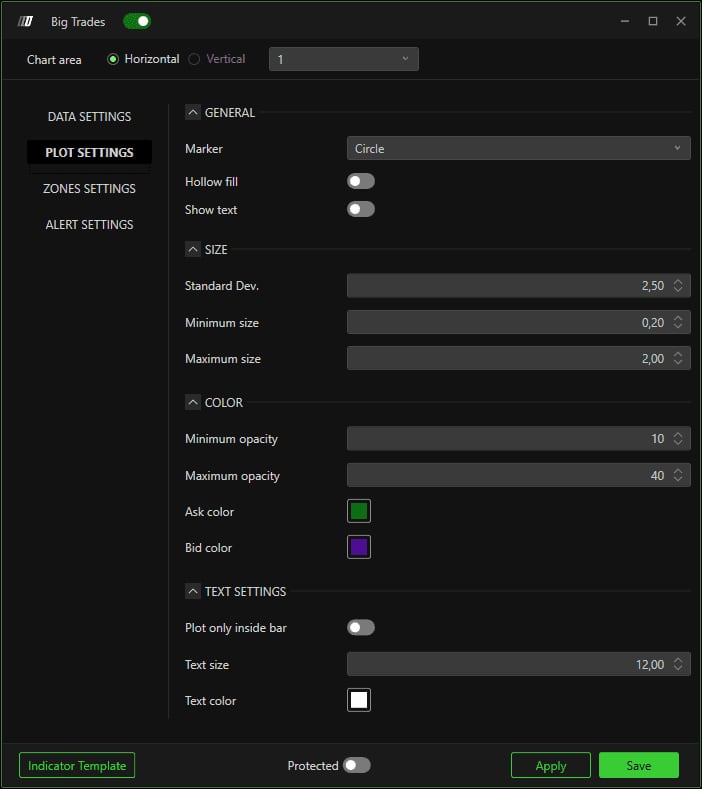
The Plot Settings tab with Marker, Hollow fill, Show text, sizes, opacities and text settings.© DeepCharts - 05
Turn large trades into zones (Zones Settings)
Switch Enable on so each qualifying large trade extends a horizontal zone to the right. Biggest only limits zones to the largest trades. Shadow mode handles trades printed in the wick, Body mode those printed in the candle body: All keeps everything, Reverse only keeps the side fighting the candle (buyers on a bearish candle, sellers on a bullish one), Trend only keeps the side moving with it, None draws nothing. Number of bars sets the zone length.
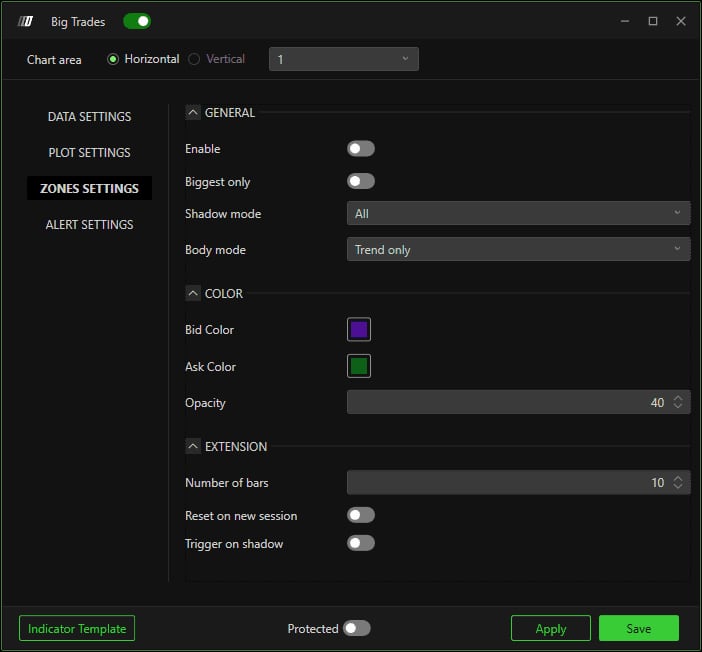
The Zones Settings tab with Enable, Biggest only, Shadow mode, Body mode, colors and extension.© DeepCharts - 06
Switch to Automatic mode
Rather than hunting for the right threshold, go back to Data Settings, set Filter mode to Automatic and pick an Automatic Intensity: Low, Medium or Strong. These three levels play the role of the Min and Max filters, but are computed by the platform for the displayed symbol. Click Save. Until the analysis in the next step has run, Automatic mode has no optimized threshold to apply.
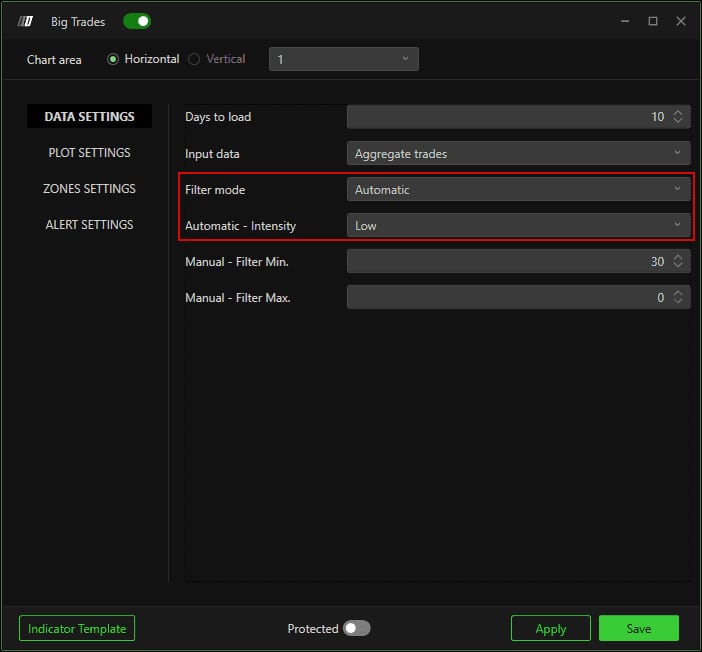
Data Settings with Filter mode set to Automatic and Automatic Intensity on Low highlighted.© DeepCharts - 07
Run Big Trades Analysis
In the DeepChart menu bar, open Options, then Tool, then Big Trades Analysis, and run it. The algorithm computes thresholds from each symbol's price behavior and volatility, then saves them: no need to rerun it every time you launch the platform, once a week or once a month is enough. If the bubbles do not change straight away, reload or restart the chart.
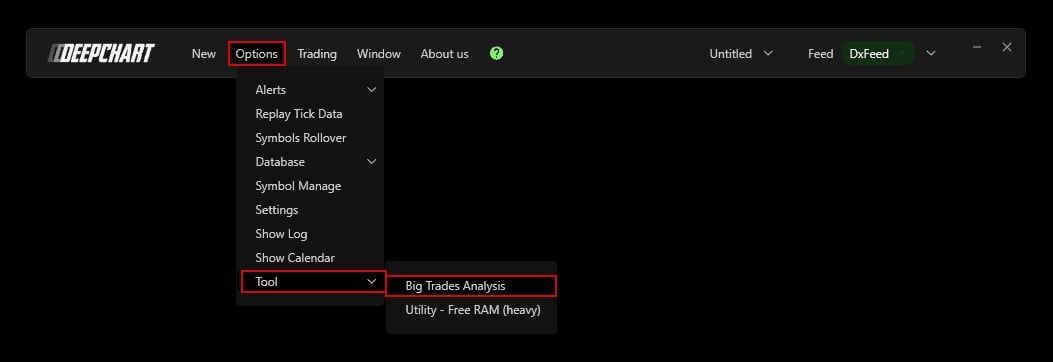
The DeepChart Options menu, Tool submenu, Big Trades Analysis entry.© DeepCharts
Settings, tab by tab
Where the indicator sits, with the chart area number next to it.
Days of large trades loaded. More days, more work at load time.
Type of order flow data used by the indicator.
Manual: threshold set by Filter Min. and Max. Automatic: threshold from Big Trades Analysis.
Used in Automatic mode, the computed equivalent of the Min and Max filters.
Minimum plotted size, in contracts.
Maximum plotted size.
Marker shape.
Outlines only, no fill.
Prints the trade size inside the bubble.
Spreads sizes between minimum and maximum. Keep the default.
Marker size bounds.
The largest trades are the most opaque.
Aggressive buyers on the Ask side, aggressive sellers on the Bid side.
Keeps the text within the candle body.
Text font, only relevant with Show text on.
Turns horizontal zones on.
Zones for the largest trades only.
Trades printed in the wick.
Trades printed in the candle body.
Zones for aggressive sellers and buyers.
Zone transparency.
Horizontal length of the zone.
Shown on screen, not detailed by the help center.
The submenu reads Tool on screen.
Results are saved automatically.
Otherwise the computed thresholds are not used.
⚠ Traps to avoid
- Looking for Big Trades under the Deep Trades name, or the other way round. Since 15.6, Big Trades is the former Deep Trades, and today's Deep Trades is a separate MBO indicator. Trust the name shown in the settings window.
- Reusing the same Manual Filter Min. across contracts. A threshold built for ES means nothing on NQ, GC or a micro like MNQ: every instrument has its own liquidity. Keep one template per symbol, or switch to Automatic.
- Switching to Automatic without running Big Trades Analysis. Automatic mode relies on the thresholds the analysis computes: run it from Options, Tool, then reload the chart.
- Turning zones on with Shadow mode and Body mode both on All. On a 1 minute chart every large trade opens a zone and the chart becomes unreadable. Start with Biggest only or a Reverse only mode, then widen.
FAQ
Does Big Trades need MBO data?+
No. Big Trades works from the feed's trades, Aggregate trades by default. It is today's Deep Trades, introduced in 15.6, that requires a feed with MBO.
Do I have to rerun Big Trades Analysis every session?+
No. Results are saved automatically; one analysis a week or a month is enough to keep up with changing volatility.
What is the difference between Reverse only and Trend only?+
Reverse only keeps the side fighting the candle: aggressive buyers on a bearish candle, sellers on a bullish one. Trend only keeps the side moving with the candle: sellers on a bearish candle, buyers on a bullish one.
Why don't the automatic thresholds show up after the analysis?+
Make sure Filter mode is set to Automatic in Data Settings, then reload or restart the chart: DeepCharts notes that results may not appear immediately.
Want to get better at order flow?
We discuss flow, liquidity and our trades live, every day, on the OrderFlowFutures Discord. Join us, it's free.
Join the Discord for free9 online·82 members·Free · instant access