Getting started with DeepCharts and DeepDom: the beginner course
Module 04 · 4 · Setting up DeepChart's order flow toolsLesson 15 of 368 min🔒 Students only
The Deep Prints footprint: timeframe, grouping, modes
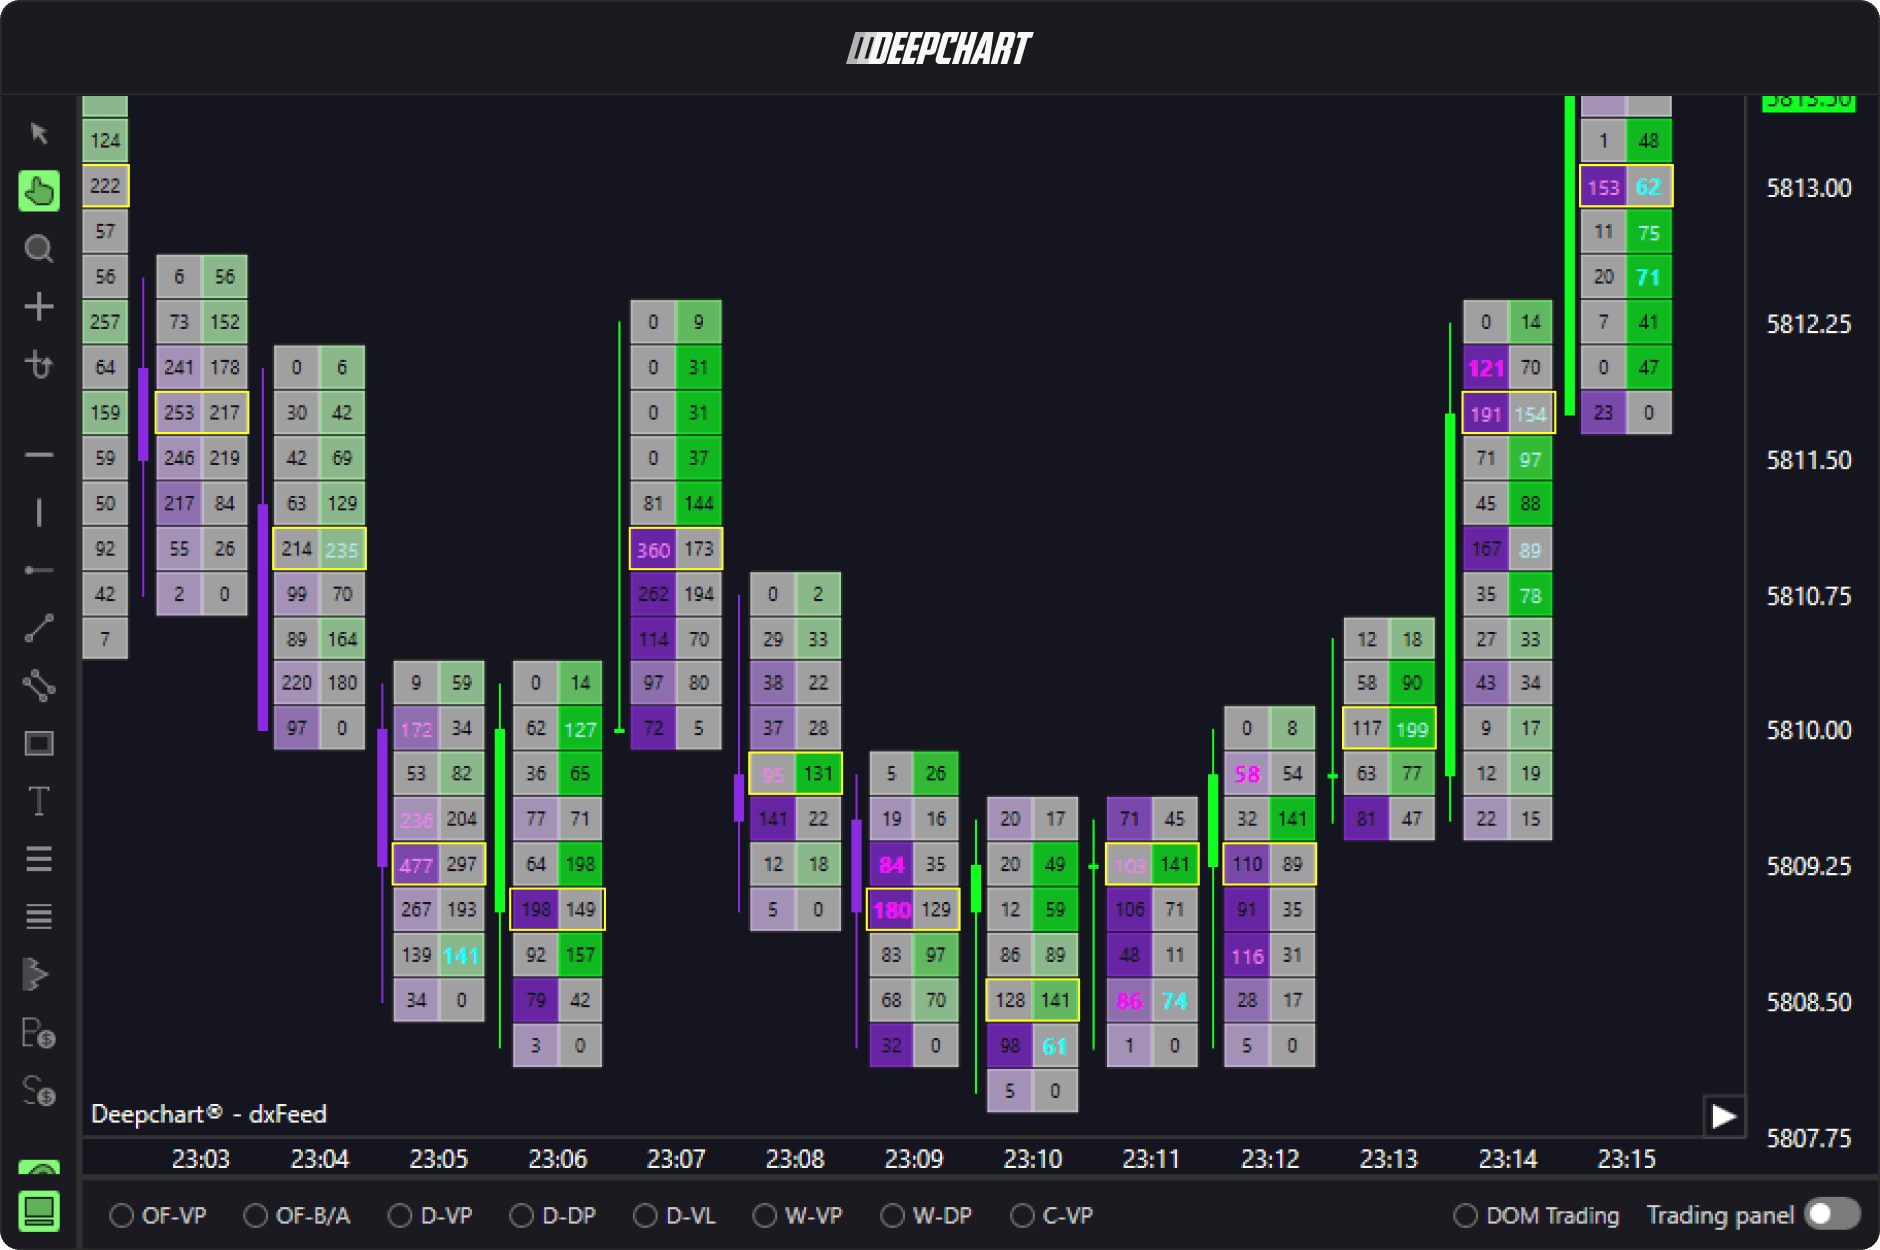
The footprint is DeepChart's central tool, and here it is called Deep Prints. It opens each candle price by price, with the volume sold at the bid and the volume bought at the ask. Its split relies on order by order data: the side of each execution is exact, where many platforms estimate it. Three settings decide how readable it is: the timeframe, the tick grouping and the display mode.
The course on order flow basics explains how to read it; this lesson explains how to set it up so that it can be read.
Student access · free
The rest of this lesson is for students
Also in this lesson
- The timeframe
- Tick grouping
- Display modes
- Reading the right contract
It's free: create your account with your email or Discord, and every course opens right away.
→ Big Trades and Deep Trades: seeing the large orders