FDAX: order flow on Eurex
What Eurex MBO depth really shows
Two feeds for one order book
Eurex publishes its order book through two channels, and the difference between them is the difference between doing order flow and watching a price ladder.
The first is the EMDI (Enhanced Market Data Interface): depth aggregated by price level, a limited number of levels. It is what most brokers call "Level 2" and sell for about twenty dollars a month. There you read "340 lots at 26,350".
The second is the EOBI (Enhanced Order Book Interface): the book order by order, each order with its identifier, quantity, price and priority timestamp, each modification and each cancellation transmitted individually. That is market-by-order, MBO. There you read that those 340 lots are made of 12 orders, that the largest is 150 and has been waiting since 8:42, that an order of 60 was just cancelled and replaced by an order of 60 at the same price, at the back of the queue.
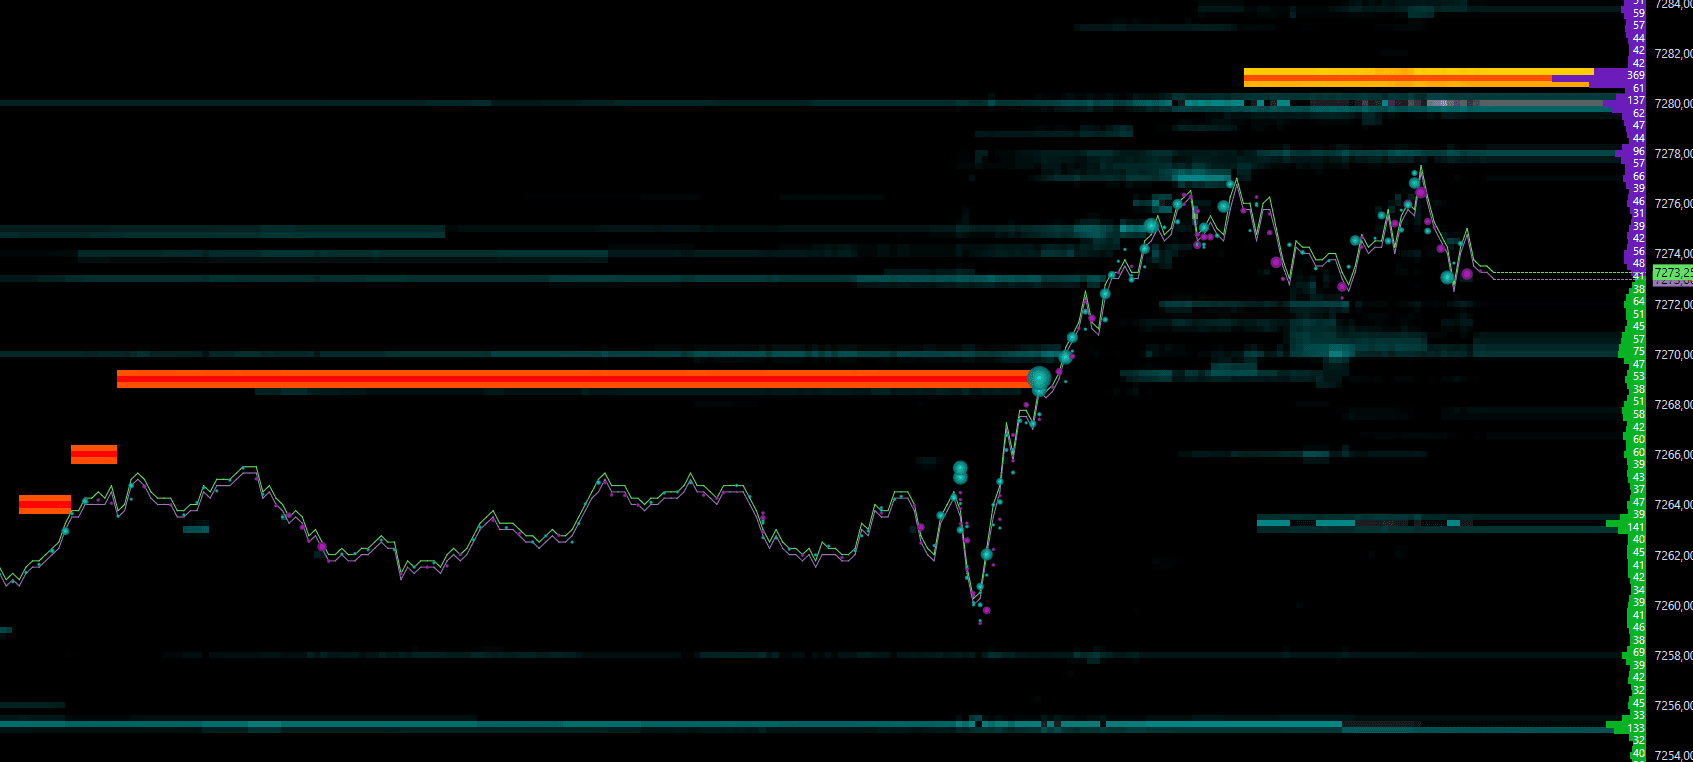
The same level seen through both feeds. On the left, the aggregate: one number. On the right, order by order: the composition of the level, the age of each order, and the reload that just happened. The heatmap, the iceberg detector and the stop run detector read only the right-hand column.
What order by order makes visible
Four pieces of information exist only in the MBO, and they are exactly the ones that make an order flow signal:
- The composition of a level. 340 lots in one order and 340 lots in 40 orders do not say the same thing. The first is a participant; the second is a crowd, and a crowd pulls faster.
- The age of orders. An order placed two hours ago and never modified is an intention that has survived several tests of price. An order placed 300 milliseconds ago is a decoy until proven otherwise. The DeepDom heatmap encodes that age in the persistence of its bands, and it can only do so with the EOBI.
- The reload. An order executed, then a new order of the same size reappearing at the same price a millisecond later: that is the signature of an iceberg. In aggregate, the level goes from 340 to 290 then back to 340; you do not know whether it is the same participant or another.
- The pull before contact. An order of 200 that disappears when price gets within two points is not liquidity, it is display. The aggregate shows you a level melting; order by order shows you who melted, and whether they come back three points further.
What MBO does not show either
One has to be as precise about the limits as about the promises:
- The identity of participants. The EOBI transmits an order identifier, not a member. You recognise behaviours, never names.
- Stops. They are not in the book, on any exchange. You see their trigger as aggression, not their presence.
- The hidden part of a native iceberg. T7 only publishes the displayed peak. The total size is guessed from the number of reloads and the volume executed at the level, never from the book.
- Orders on the other contracts. The FDAX book does not contain the FDXM's. Arbitrage links them, the feed does not merge them.
What changes compared with CME MBO
The CME also publishes its book order by order, and the read is the same in principle. Two practical differences:
- Cost. On the CME, MBO depth is a single subscription; on Eurex, it is a surcharge billed by the exchange, on top of the base feed. The order of magnitude is on the Eurex pillar and the DeepCharts promo code page, with the date it was checked.
- Density. The FDAX has fewer orders per level than the ES and a wider price step: each order weighs more in its level, each reload shows better. Eurex MBO is, on screen, more readable than CME MBO, because there are fewer people to read.
Reminder: educational content, past performance does not predict future results.
End of the free lesson
The other 30 lessons of this course, its quizzes and the completion certificate open with the Student role.
It's free: join the Discord, click the Student role, then log in with Discord here to access all courses.
→ The Eurex desk: the data, the platform, and why the niche stays empty