GEX (MM), H-GEX and C/P OI (R): DeepCharts' gamma columns against the order book
The three columns and the 6:29 pm guided tour (capture 9)
The three columns to the right of the chart ask three different questions about the same strike. GEX (MM) shows how much gamma market makers carry at that strike. H-GEX shows whether their hedging will brake or accelerate price when it gets there. C/P OI (R) shows how many call and put contracts are open there. All three come from the same base indicator, Option Gex Profile, set to different sources, or from its Hedging variant. Before interpreting a bar, you need to know which one you are looking at and what it measures.
What the three columns show
| Column | DeepCharts indicator (data source) | What it measures | Unit shown | Question it answers |
|---|---|---|---|---|
| GEX (MM) | Option Gex Profile, "Gex (Market Maker)" source | Market makers' real net gamma exposure per strike, as reported by the CBOE | Millions (M) | Where is hedging concentrated? |
| H-GEX | Option Gex Profile Hedging | Likely effect of hedging (amplify, brake or neutral), estimated from implied volatility and the Greeks | Color only | Will hedging accelerate or brake price here? |
| C/P OI (R) | Option Gex Profile, "Call/Put OI-R" source | Call and put open interest computed in real time, with no gamma weighting | Thousands of contracts (K) | Where are the open positions? |
Conventions to know before reading the columns
- SPX data only. These profiles only work on SPX, because they require CBOE participant data. You open an SPX options chart tied to CME ES, hence the window title "SPX → ES-202612".
- Projection onto the ES axis. The documentation does not explain how SPX strikes are placed on the ES scale. On the capture, bars are 5 points apart, the SPX strike step, and land about one point below round numbers. It looks like an adjustment by the ES versus SPX basis, but it is not documented.
- Colors. Green means positive or the call side, purple means negative or the put side. The longer the bar, the larger the value at the strike.
- Expirations. An Expiration filter selects which expiries are counted: Default, 0 DTE, ≤ 1d, ≤ 7d, ≤ 31d, ≤ 91d or All. With Default, the expiry chosen in the Settings quick bar applies. Always check this setting before interpreting a bar: a 0DTE profile and an all-expiries profile do not tell the same story.
Guided tour: the 6:29 pm capture
A strike is read horizontally, across the three columns. Near 7,599, for instance, you read a large purple bar on GEX (MM), purple on H-GEX, and 14K puts against 14K calls on C/P OI (R). Taken together, those three signals point to a pivot.
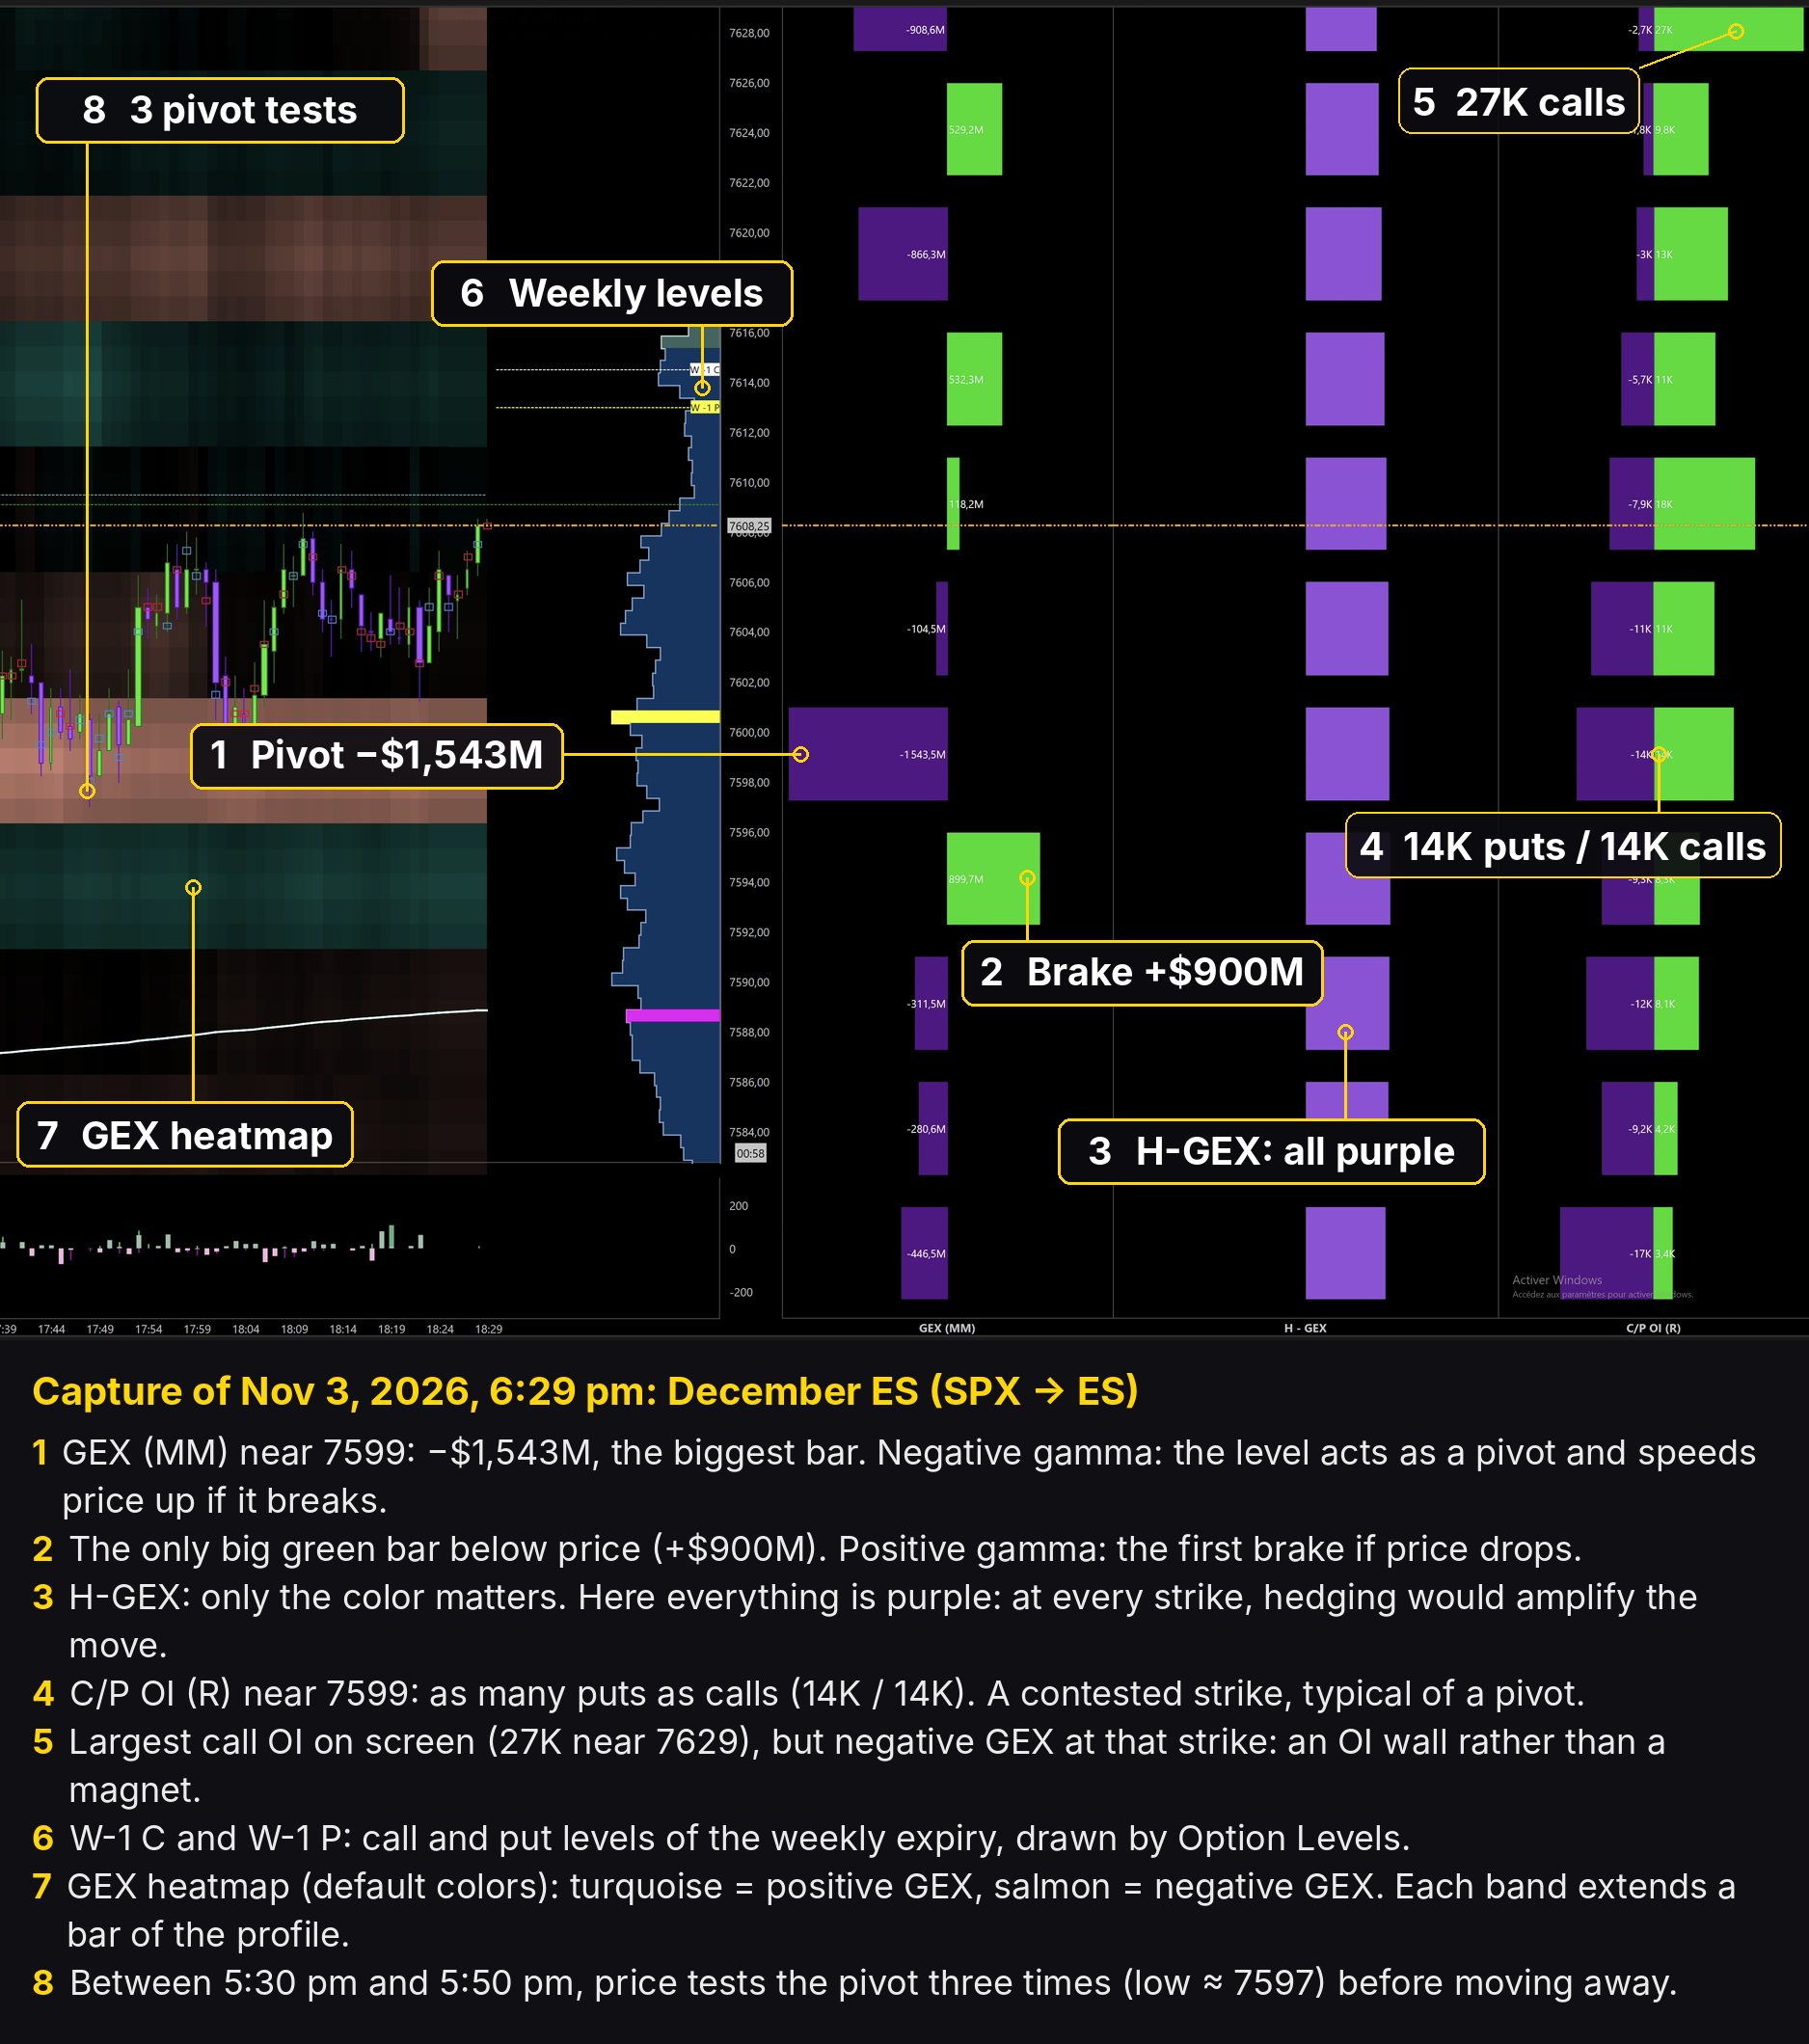
How to read the image. Markers 1 to 5 follow the strike from left to right. Markers 6 to 8 show what the price chart adds. The GEX heatmap (7) is nothing more than the GEX profile projected over time: each turquoise or salmon band extends a bar of the GEX (MM) column, at the same height.
The sequence from 5:30 pm to 6:29 pm. Price drops into the pivot's salmon band (from 7,597 to 7,602), goes back and forth three times (8), then climbs back. It never reaches the turquoise band below, the 7,594 brake (2), which would have been the target of a pivot break.
End of the free lesson
The other 24 lessons of this course, its quizzes and the completion certificate open with the Student role.
It's free: join the Discord, click the Student role, then log in with Discord here to access all courses.
→ GEX (MM): where market makers carry gamma