Published
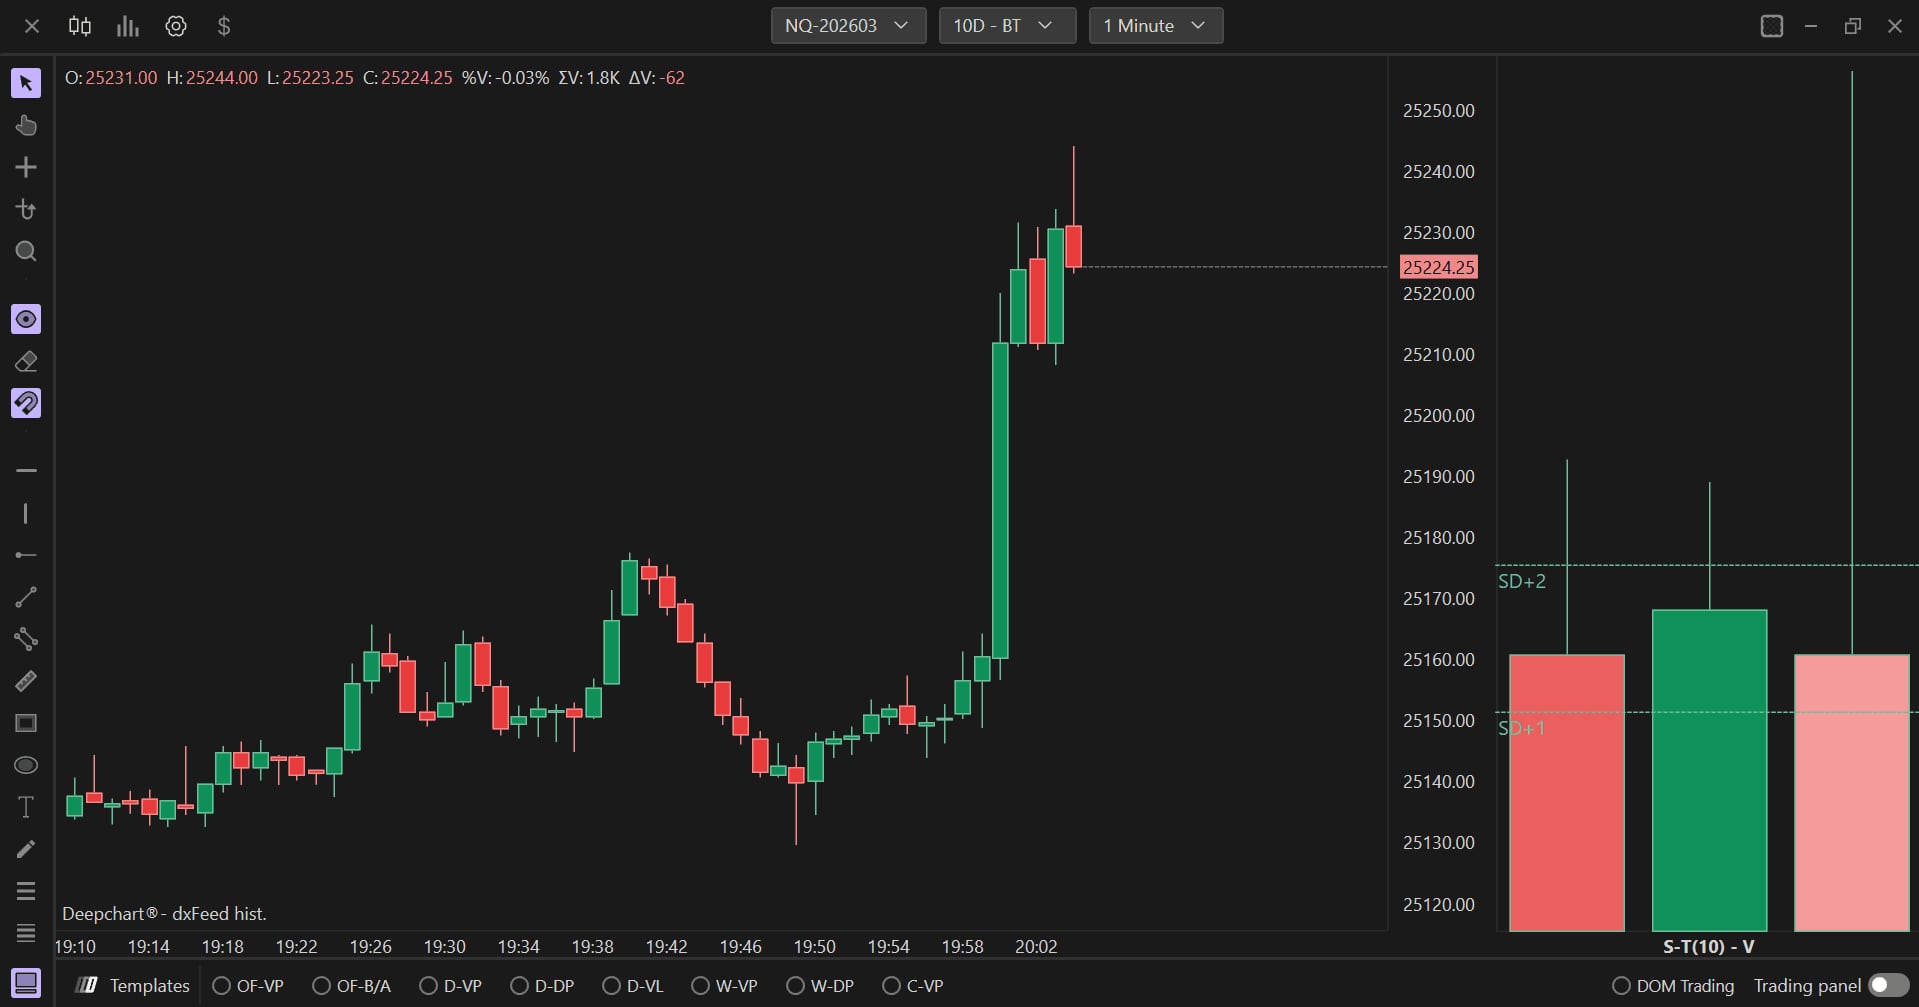
Speed of Tape measures how fast trades are executing, over a rolling time window. It shows up in a separate panel under the price chart, as vertical bars: green or turquoise for positive delta, red or pink for negative delta, with each bar's height showing intensity. This tutorial goes through every configuration tab, with the time window as the central setting the others build around.
- The Speed of Tape indicator added to the chart, in its own panel under the price
Step by step
- 01
Set the Data Settings section (Settings tab)
Input data chooses between Volume and Orders: Volume measures traded contracts, the most direct measure and the recommended default; Orders counts the number of transactions, a different read of the same acceleration. Min filter (one by default) and Max filter (zero by default) bound what enters the calculation, zero on Max filter meaning no limit rather than a zero limit.
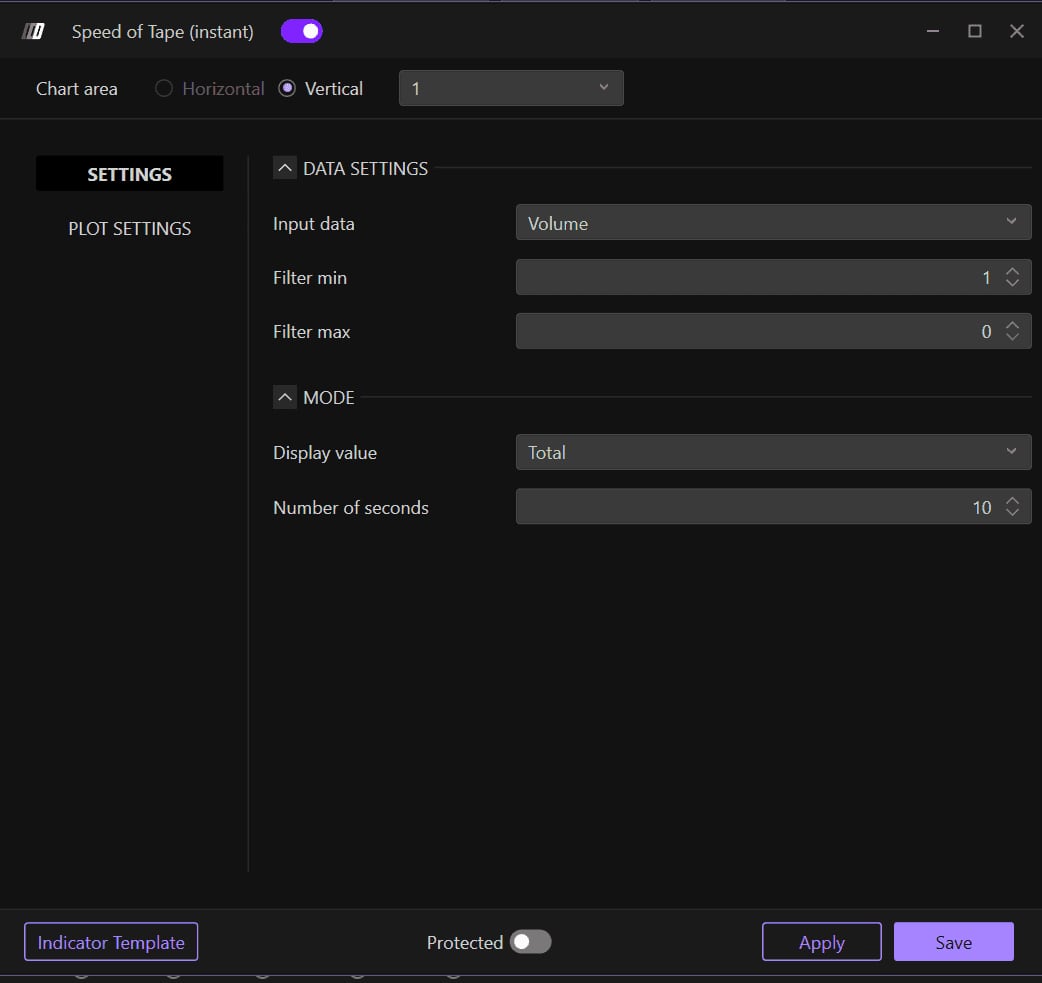
The Data Settings section of the Settings tab, with Input data, Min filter and Max filter.© DeepCharts - 02
Set the time window in the Mode section (Settings tab)
Number of seconds sets the rolling window the speed is calculated over, ten seconds by default. A short window, five to ten seconds, increases reactivity and suits scalping. A longer window, fifteen to thirty seconds, smooths the data and suits swing trading better. Displayed value set to Total aggregates all the window's activity into a single measure.
The Mode section of the Settings tab, with Displayed value and Number of seconds.© DeepCharts - 03
Set the size and scale in the Plot Settings tab
Bars to display sets how many historical bars show, three by default, between one and ten recommended depending on screen width. Min scale value bounds the bottom of the vertical axis, zero by default. Both settings live in the General section of the Plot Settings tab, not in a separate tab of their own.
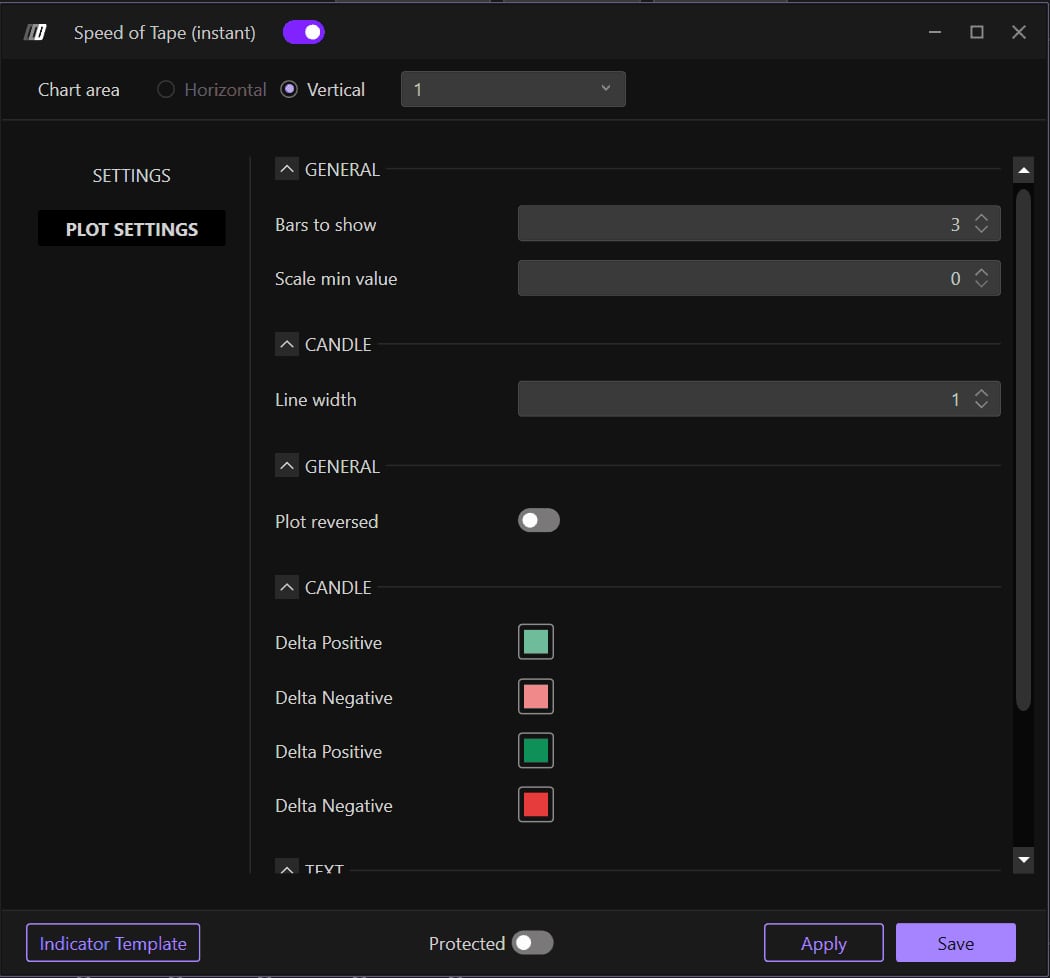
The General section of the Plot Settings tab, with Bars to display and Min scale value.© DeepCharts - 04
Set the appearance in the Plot Settings tab
Still inside Plot Settings, the Candle section sets Line width (one pixel by default), and a second General section further down offers Reversed trace, disabled by default: it flips the vertical orientation of the plot, a display preference with no effect on the calculation. A second Candle section then sets Positive delta and Negative delta, green or turquoise against red or pink by default, each with a secondary variant to tell apart a different intensity within the same side.
The Candle and General sections of the Plot Settings tab, with Line width, Reversed trace and the four delta colors.© DeepCharts
Settings, tab by tab
Volume recommended by default, the most direct measure.
On the capture; bounds the low end of what enters the calculation.
0 means no limit, not a zero limit.
Aggregates all the window's activity into a single measure.
5 to 10 seconds for scalping, 15 to 30 seconds for swing trading.
Between 1 and 10 recommended depending on screen width.
Bounds the bottom of the panel's vertical axis.
Second General section in the same tab; flips the vertical orientation, no effect on the calculation.
Thickness of the plotted bars.
Second Candle section in the same tab; each side has a secondary color to shade intensity.
⚠ Traps to avoid
- Picking too short a window on a thin instrument. The result turns noisy, close to random, for lack of enough trades for the measure to mean anything over just a few seconds.
- Picking too long a window on a very liquid instrument. The excessive smoothing hides the very acceleration you were trying to spot.
- Reading Max filter at 0 as a total exclusion. It is the opposite: 0 means no limit applied, every transaction counts toward the calculation.
Related tool
FAQ
Which time window should I pick?+
Five to ten seconds for scalping, where reactivity matters most. Fifteen to thirty seconds for swing trading, where a bit of smoothing helps ignore short term noise. Number of seconds in the Mode tab sets this window.
Should I use Volume or Orders as input data?+
Volume is recommended by default: it is the most direct measure of activity. Orders counts the number of transactions rather than traded contracts, a different read useful as a complement, not a replacement.
What does Reversed trace do?+
It flips the vertical orientation of the plot. It is a display preference, disabled by default, with no effect on the speed calculation itself.
Want to get better at order flow?
We discuss flow, liquidity and our trades live, every day, on the OrderFlowFutures Discord. Join us, it's free.
Join the Discord for free4 online·38 members·Free · instant access