Published
ADR Target computes an asset's average high to low range over a chosen number of periods, then projects labeled intraday target levels on the chart: Scaling, Primary, Secondary and Extension Tgt. It needs no special data feed. This tutorial covers the calculation period, the length, label display and how to read the levels when placing profit targets and stops.
- DeepChart with a connected data feed and enough history to cover the chosen length
- The ADR Target indicator added to the chart from the indicator list
Step by step
- 01
Understand what ADR measures
The Average Daily Range is the average distance between high and low over the last few periods. If ES usually covers a given range per day, a session that has already traveled that far statistically has less room left to expand. The indicator therefore helps you set realistic targets, spot likely exhaustion zones and avoid forcing one more trade once the day has already delivered its usual range.
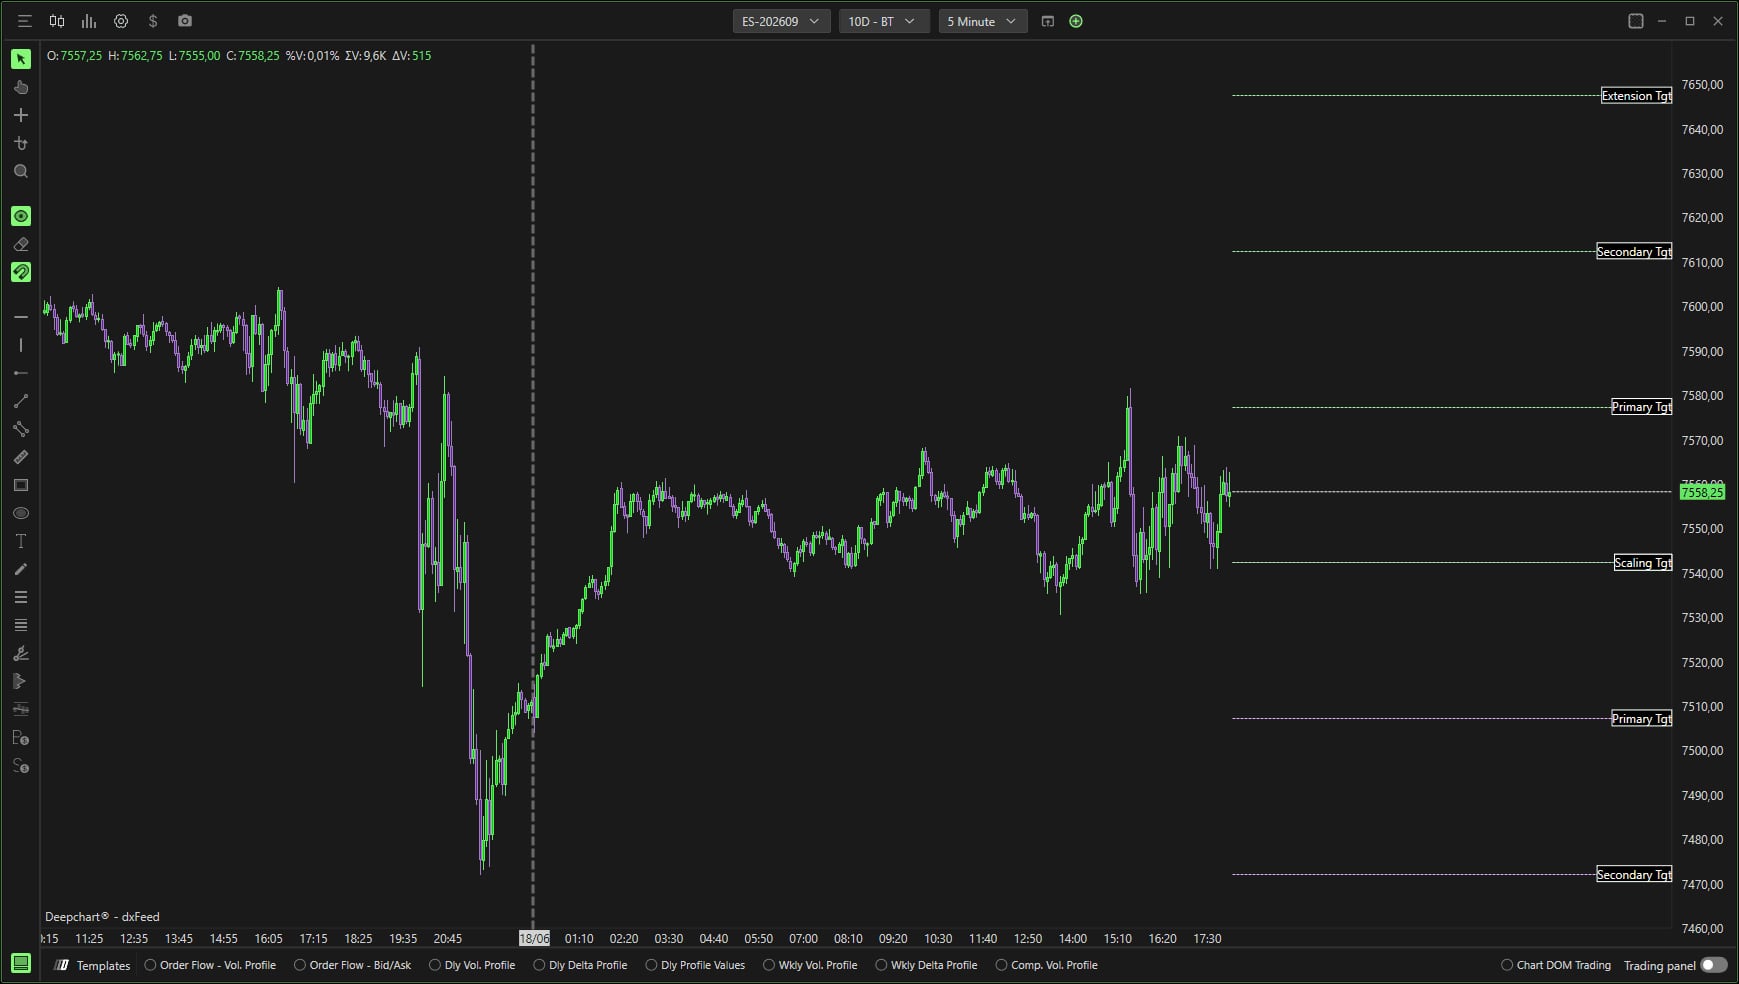
Screenshot to comeA 5 minute ES chart with the Scaling, Primary, Secondary and Extension Tgt levels above and below price.
- 02
Open the General panel
Open the indicator settings. ADR Target has a single tab, General, split into two blocks: Parameters for the calculation and Plot Settings for the labels. At the top, Chart area places the indicator in the chosen chart area, Horizontal by default.
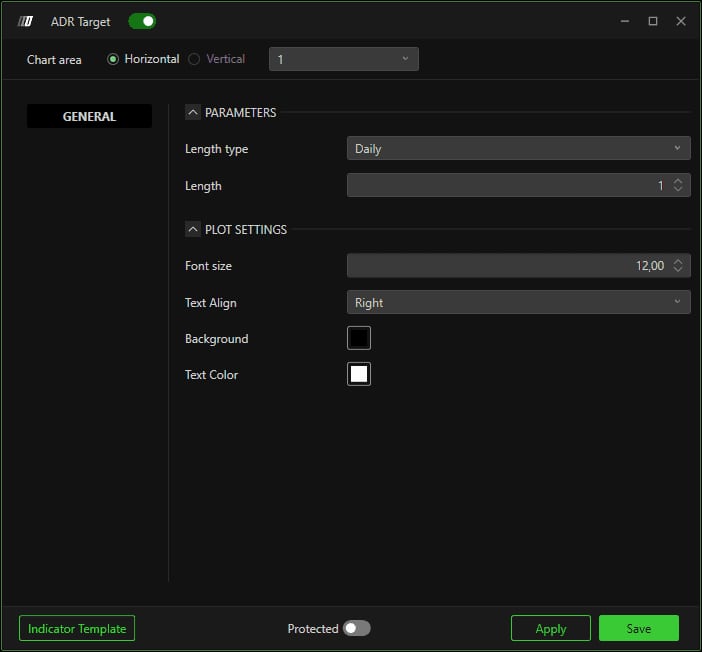
The ADR Target panel with the Parameters and Plot Settings blocks.© DeepCharts - 03
Pick the calculation period (Length type)
Length type sets the bar unit used: Daily computes ADR from daily bars, Weekly and Monthly from weekly and monthly bars. For a day trader on NQ or ES, Daily is the natural choice. Weekly and Monthly are better for placing a swing within the usual weekly or monthly range.
- 04
Set the length (Length)
Length is the number of previous periods in the average: with Daily and Length at 10, the indicator uses the last ten sessions. The screenshot shows 1, the previous session alone, which tracks the current volatility regime closely but reacts to any unusual day. A longer length smooths out outlier sessions such as a CPI release or an FOMC day, at the cost of slower adaptation.
- 05
Style the labels (Plot Settings)
Font size sets the label text size, Text Align aligns labels left or right, Background colors the label box and Text Color its text. On a screen full of footprint numbers or profiles, a solid contrasting background keeps the labels from getting lost.
- 06
Read the levels on the chart
Once saved, the indicator draws lines on both sides of price, each labeled: Scaling Tgt closest, then Primary Tgt, Secondary Tgt and, on the upper side in the screenshot, Extension Tgt. The nearest levels are natural places to scale out, the furthest ones help judge that a move is already stretched. The help center does not detail how they are calculated: treat them as range landmarks, not guaranteed targets.
Settings, tab by tab
Bar unit used to compute the average range.
Number of previous periods averaged. Help center example: 10 for the last ten sessions.
Label text size.
Label text alignment.
Label background color.
Label text color.
⚠ Traps to avoid
- Leaving Length at 1 without realizing it. The previous session's range alone is enough to skew every target after a news day; raise the length for steadier levels.
- Treating Extension Tgt as a target the market must reach. These are statistical range landmarks: price can stall well before them or blow through them on a trend day.
- Mismatching Length type and trading horizon. Weekly levels on a 1 minute scalping chart sit too far away to serve as an intraday target.
FAQ
Does ADR Target need a special data feed?+
No, it averages bar highs and lows. You only need enough loaded history to cover the chosen length.
Which length should I use on NQ or ES?+
The help center uses 10 sessions as its example. A short length follows the recent volatility regime, a long one smooths outlier days: test both on your instrument.
Can ADR Target be used to place a stop?+
The help center presents it as a way to set realistic take profit and stop levels from typical volatility. It remains a statistical landmark to combine with your own read of the market.
Want to get better at order flow?
We discuss flow, liquidity and our trades live, every day, on the OrderFlowFutures Discord. Join us, it's free.
Join the Discord for free9 online·82 members·Free · instant access