Trading ES in order flow with DeepCharts, DeepDom and DeepGamma: the complete course
Reading 1: Deep Prints, the footprint
A classic candle says four things: open, high, low, close. The footprint says, at every price inside the candle, how many contracts were bought aggressively (filled at the ask) and how many were sold aggressively (filled at the bid). It is the difference between seeing that price moved and seeing why. On ES, the footprint is read at the tick, and that is a stroke of luck: every 0.25-point level has its own auction.
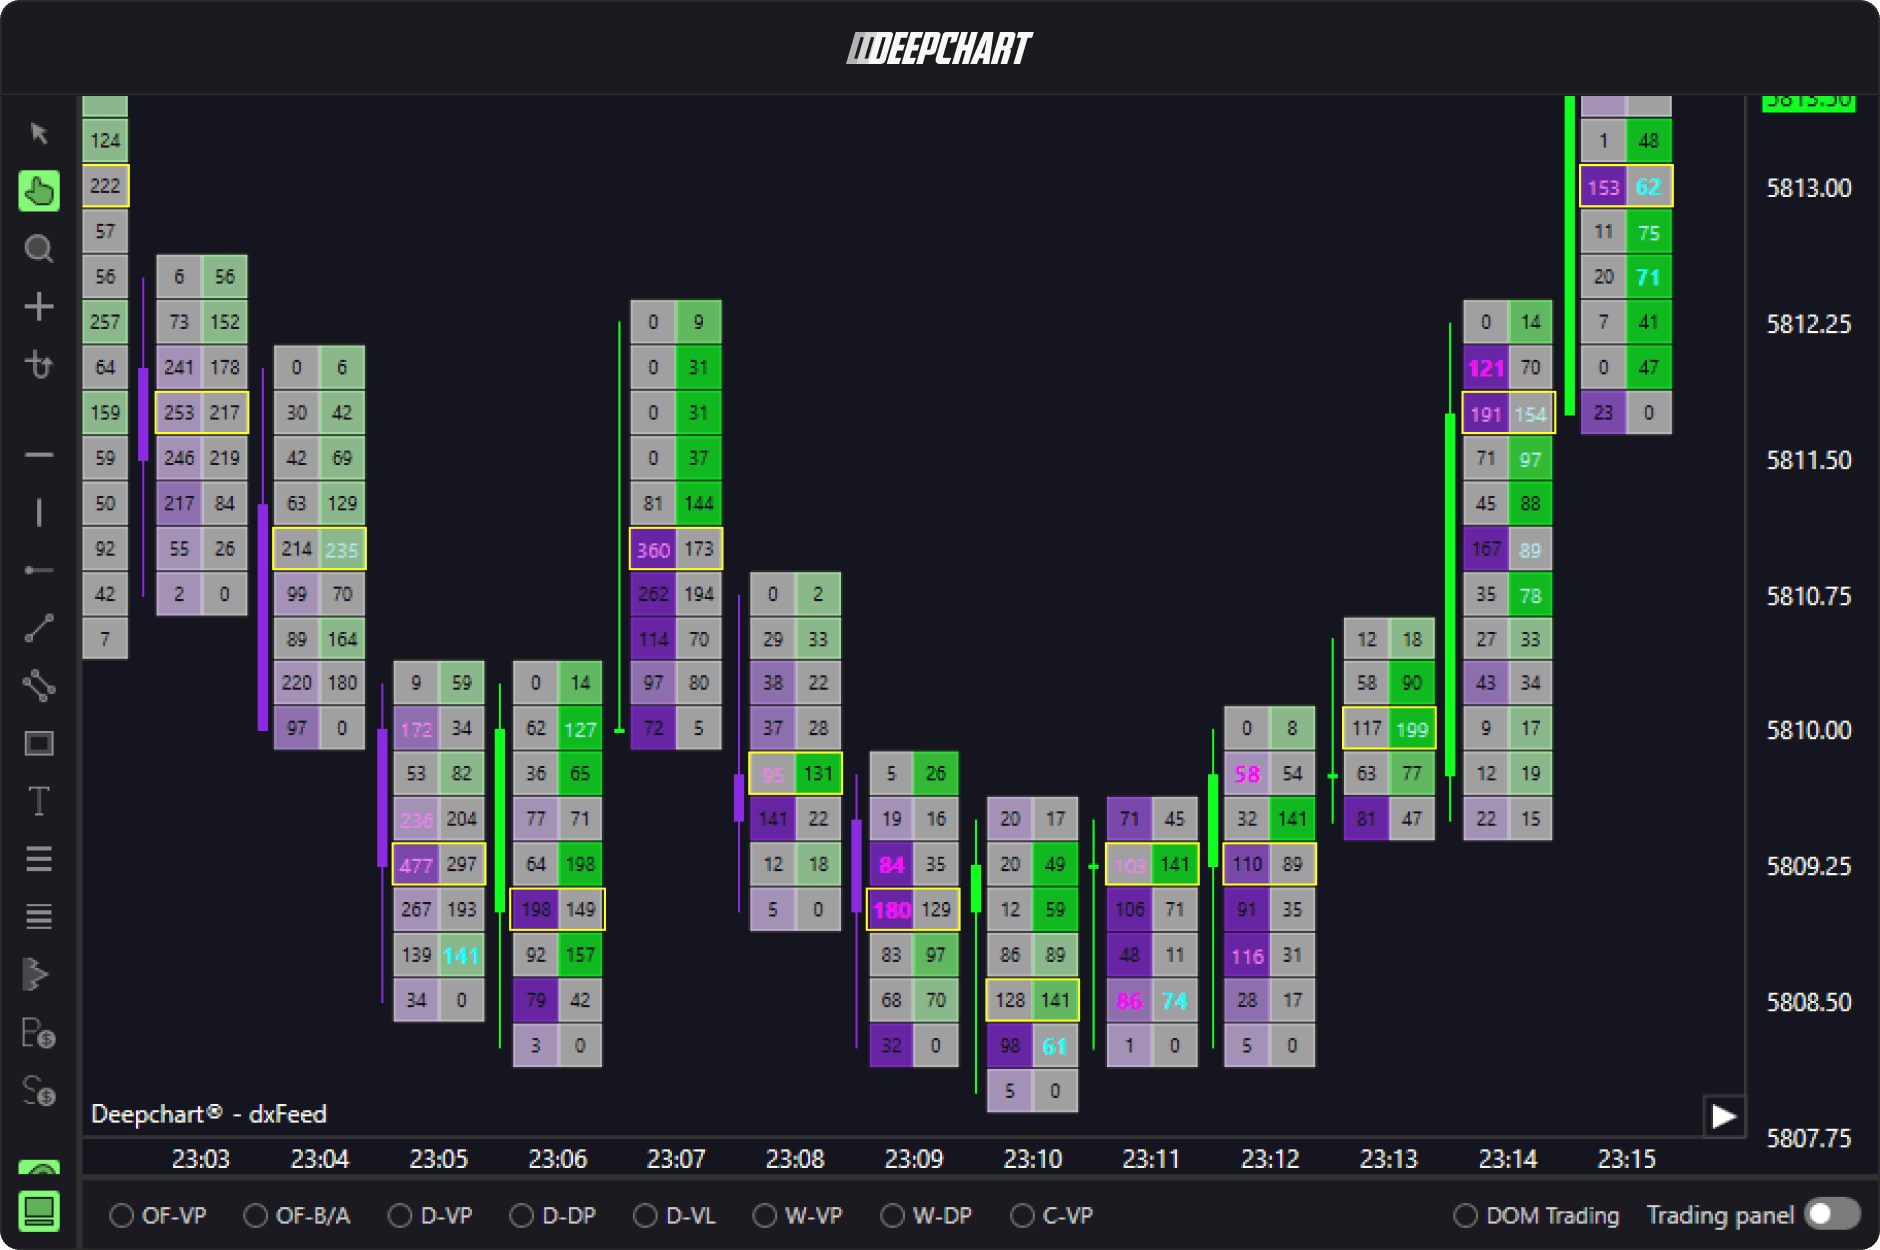
At each price, the left column is the volume sold at the bid, the right one the volume bought at the ask. The highlighted cells are the diagonal imbalances, the yellow frames the bar's maximum volumes.
The rest of this lesson is for students
- The four patterns that matter
- Why the diagonal
- Reading a candle in its context
It's free: join the Discord, click the Student role, then log in with Discord here to access all courses.
→ Reading 2: Deep Stats, effort and result