Getting started with DeepCharts and DeepDom: the beginner course
Module 05 · 5 · DeepDomLesson 19 of 368 min🔒 Students only
The DeepDom screen: the heatmap, the bottom bar and the order book
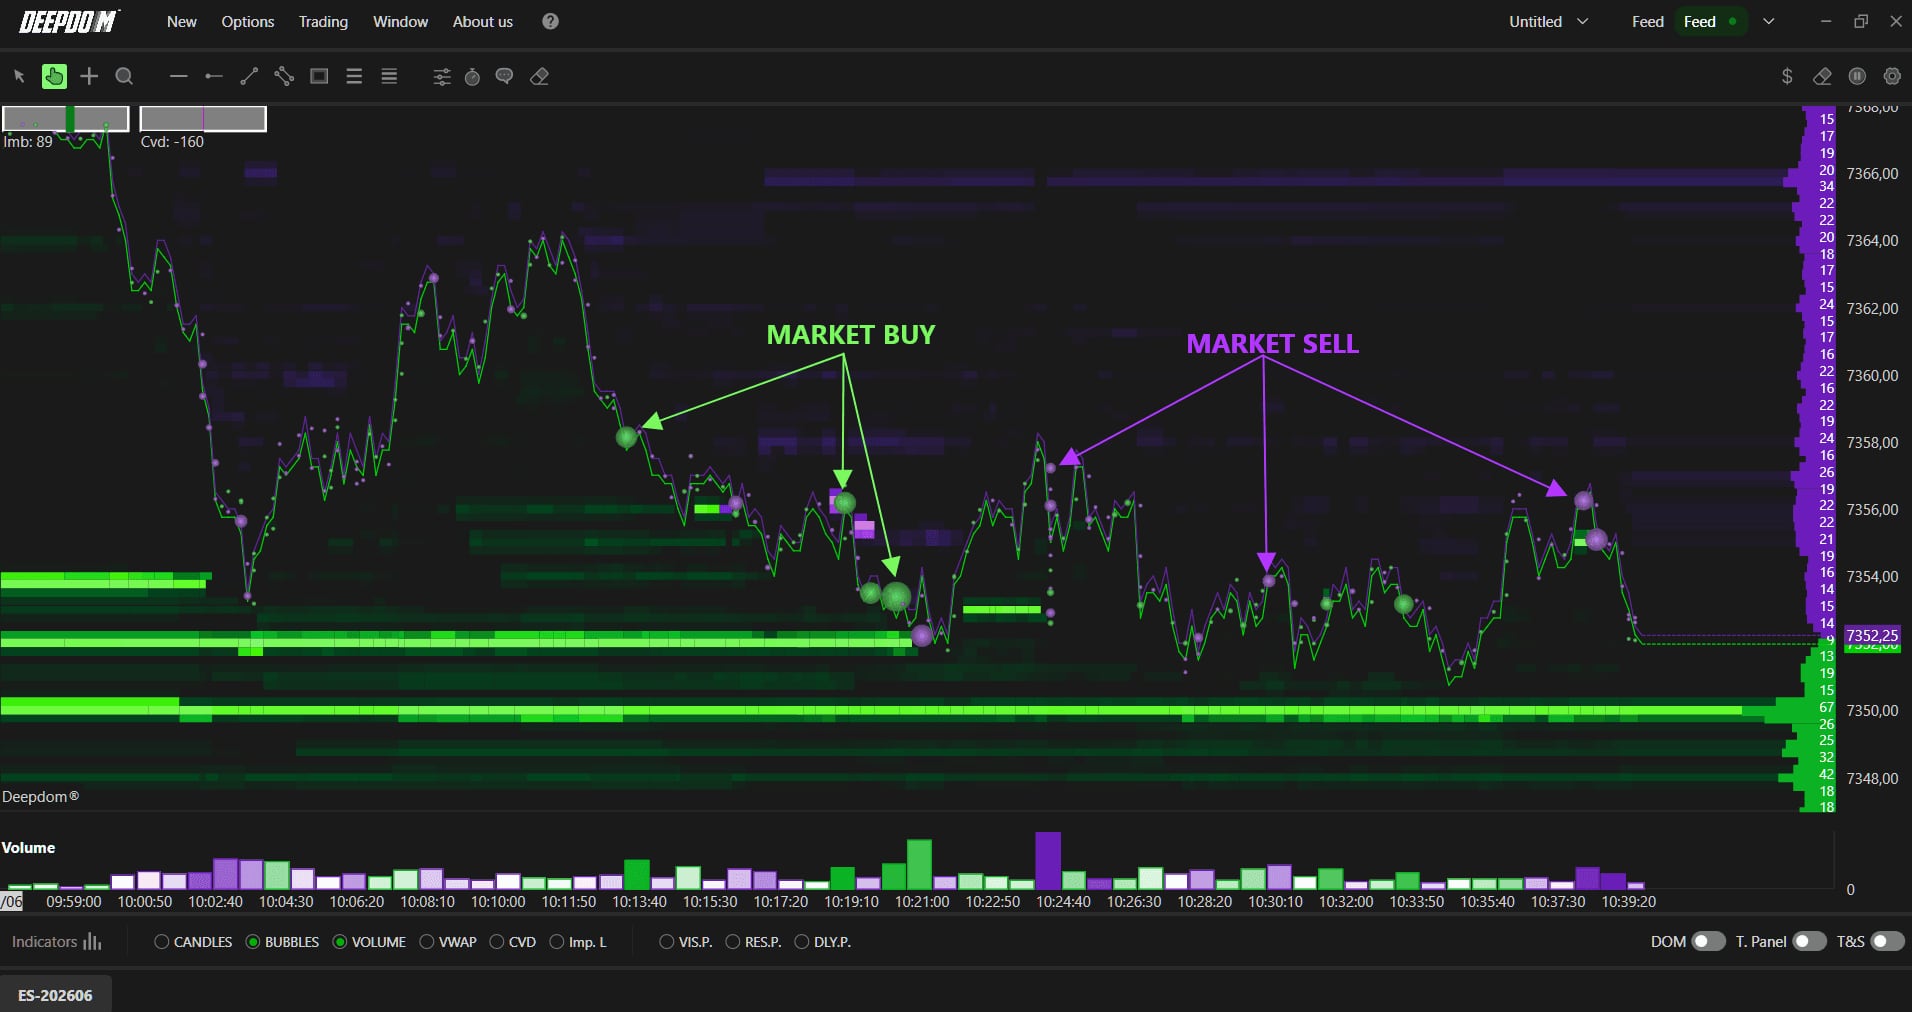
DeepDom is a separate piece of software, with its own window, its own connection and its own menu bar. Its screen brings together the liquidity heatmap, price with its execution bubbles, the advanced DOM and the time & sales. Most of these elements are switched on or off from a single bar at the bottom of the screen: that is the one to learn first.
The course on order flow basics describes the screen zone by zone, on an annotated ES capture; this lesson describes the controls.
Student access · free
The rest of this lesson is for students
Also in this lesson
- At the top
- The bottom bar
- A starting screen
- The colors
It's free: create your account with your email or Discord, and every course opens right away.
→ Setting up the Volume Bubbles