Reading gamma on ES with DeepGamma: one session, step by step
The ES chart: eight tools to read (capture 1)
We work with two complementary charts. The ES candle chart (captures 1 and 2) gives the regime and the gamma map; the "SPX → ES" footprint chart (captures 3 and 4) gives the walls and the execution. When the DeepCharts documentation does not settle a point, it is flagged "to be checked": verify it in your own settings.
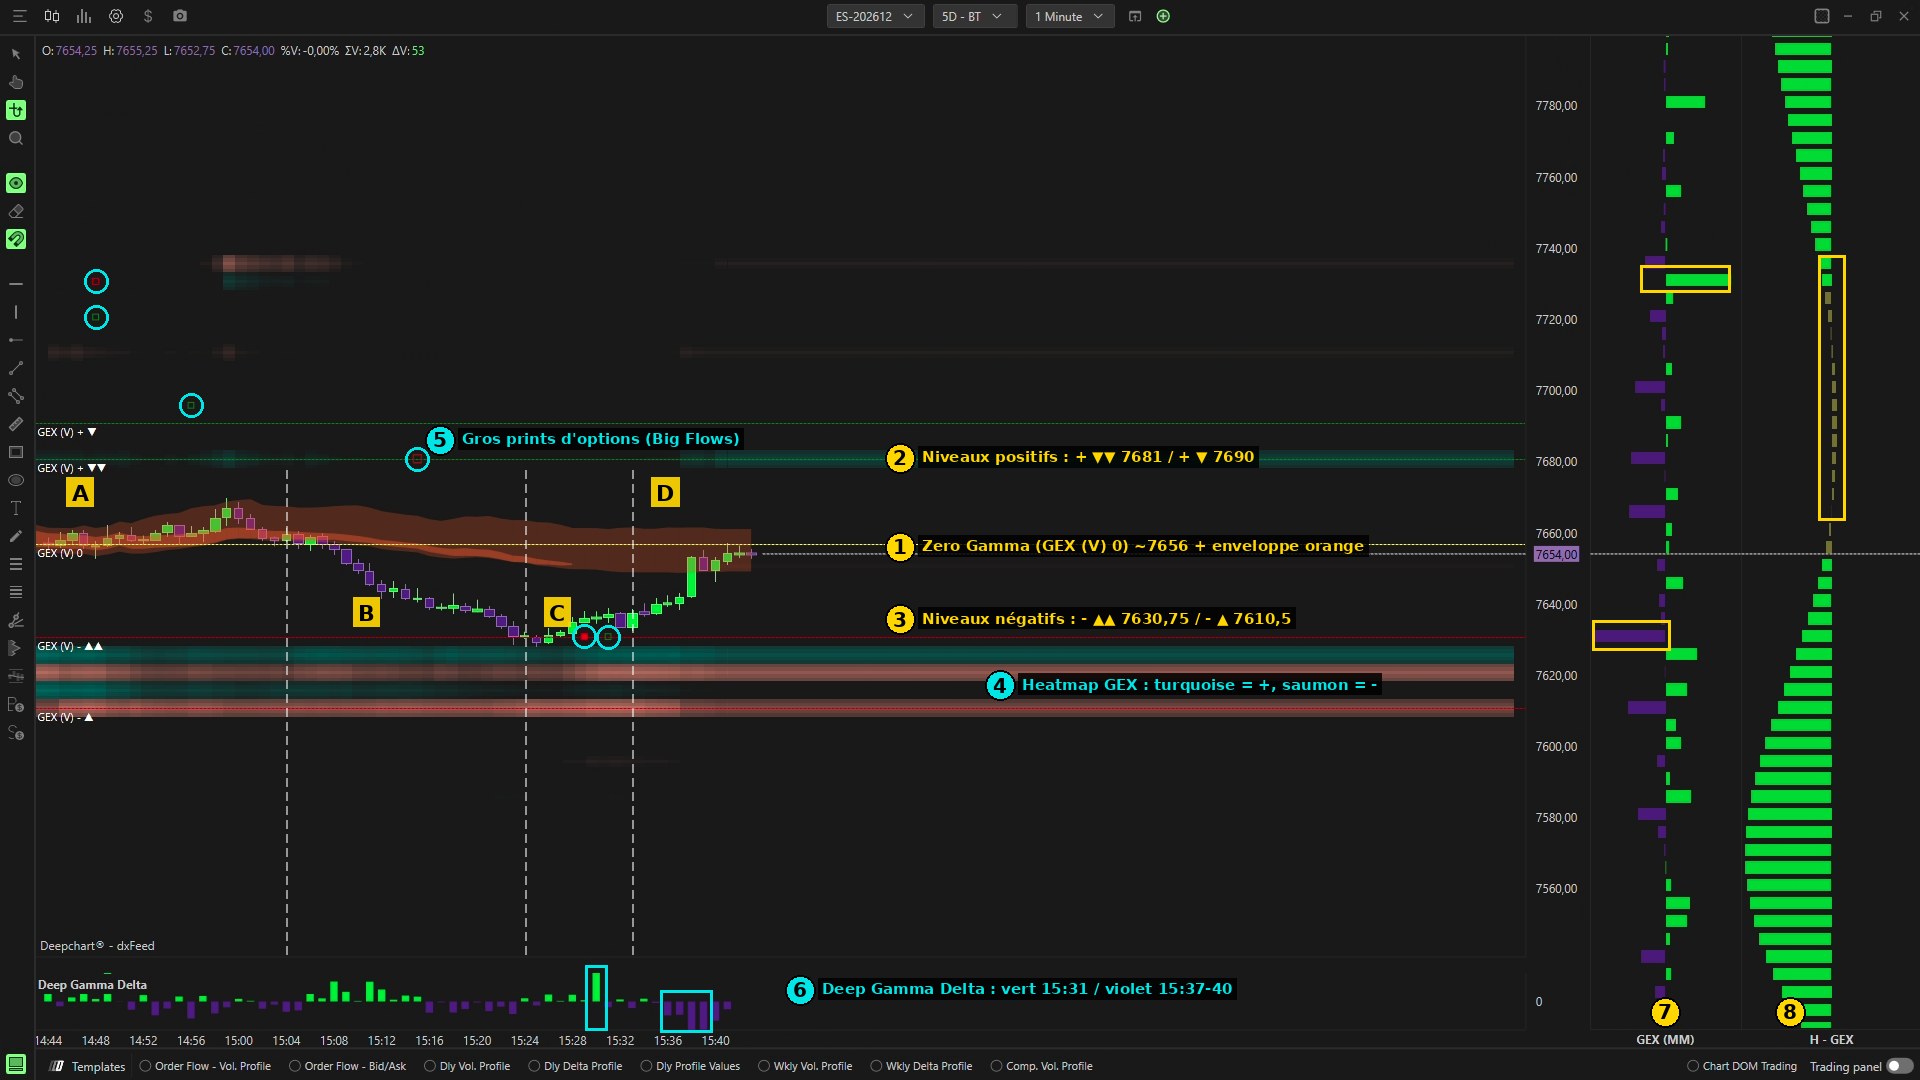
① Zero Gamma and Gamma Envelopes. The yellow "GEX (V) 0" line (≈ 7,656) is the Zero Gamma. The orange cloud around it is the Gamma Envelopes indicator: the zone where the flip sits and how it evolves during the session. The wider the envelope, the blurrier the border between the two regimes.
The rest of this lesson is for students
It's free: join the Discord, click the Student role, then log in with Discord here to access all courses.
→ The "SPX → ES" options chart and its labels