Order flow basics: the beginner course
Module 06 · 6 · The footprintLesson 27 of 659 min🔒 Students only
The footprint: an X-ray of a candle
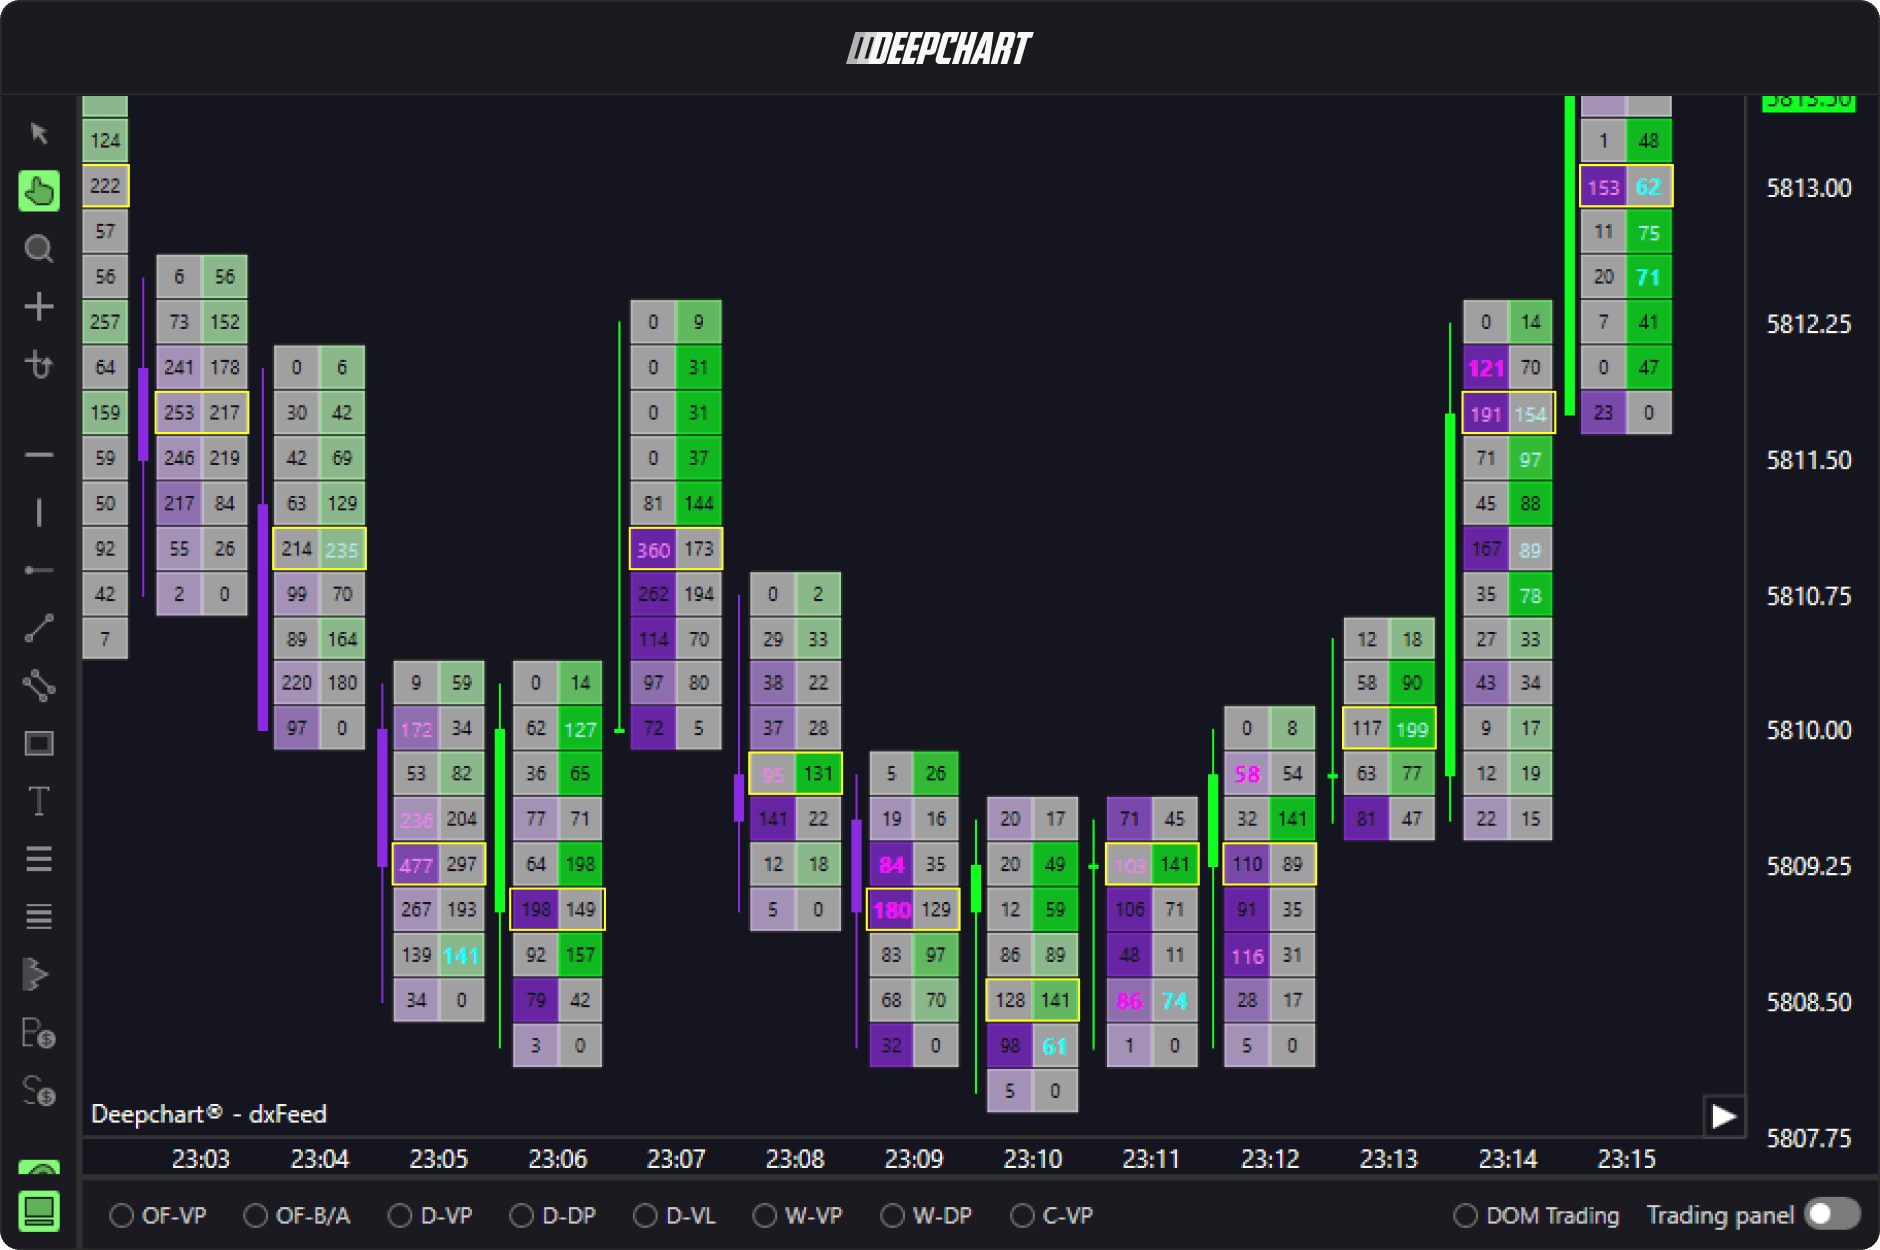
The footprint opens each candle price by price. Instead of four prices and a volume, you see, at every tick of the candle, how many contracts were sold aggressively at the bid and how many were bought aggressively at the ask. It is the X-ray of the candle: its volume skeleton, with the side that took the initiative on every floor.
In DeepChart, the footprint is called Deep Prints. The principle is the same on every platform, but the layout varies; this module relies on the official DeepCharts capture below, which you are going to learn to read cell by cell.
Student access · free
The rest of this lesson is for students
Also in this lesson
- The structure
- What the X-ray shows that the candle hides
- The basic settings
It's free: create your account with your email or Discord, and every course opens right away.
→ Reading a cell, a row, a candle