Updated · first published
What is VWAP and its envelopes?
A standard average treats every candle equally, including the ones where almost nothing traded. VWAP weights each price by the volume traded at that price: it gives the real average price of activity, the one executions clustered around. Envelopes add dispersion: bands computed in standard deviations around the line, turning a vague question, is price expensive, into a measurement, price is this many standard deviations from its volume weighted mean.
Our link opens DeepCharts with code OFF filled in at the Payment step. Black Friday: retype code OFF at the Payment step. Pre-filled by our link it stays at -10%; erased and typed again, it goes to -20%.
What DeepCharts does better
The period mode decides what the line says: Day for the session VWAP, Minutes or Seconds for a rolling window, and an Orders mode that computes over a number of orders rather than over time, which pulls the tool toward order flow logic instead of chart logic. Envelopes compute in standard deviation, so they adapt to volatility, or as a fixed percentage. Three bands are available and toggle independently, the first for the normal volatility range, the second for significant moves, the third for rare excursions. And nothing stops you stacking several VWAPs, a session one and a thirty minute one, to hold the day's fair value and the current hour's in the same glance.
Using it day to day
Two bands are enough in most cases: the first to know whether you sit in the normal zone, the second to spot extension. The third works as a guardrail more than a signal. The technical point to check before anything else is the session anchor: on a European contract like the FDAX, a VWAP restarting at the US open does not measure the day you are trading. Orders mode is worth a try on instruments where volume arrives in waves: the line stops drifting through quiet periods.
Typical mean-reversion case: price reaches the second upper band late morning, cumulative delta flattens and executions at the ask slow down. The zone is expensive and aggression is running out. The entry is not taken on the band, it is taken when order flow confirms the refusal, with VWAP itself as the obvious first target.
⚠ The trap to avoid
The absolute trap is selling the second band because it is the second band. In a well-fed trend price rides the band for hours and every counter-trend attempt dies there. A band says a price is statistically far away, not that it will come back. The second trap is quieter: changing the period mode without noticing, mentally comparing a session VWAP to a thirty minute VWAP, and drawing a conclusion from the difference.
Combine it with
VWAP gives fair value, the volume profile gives acceptance, the footprint gives the trigger. Read the trio in that order: price is expensive against the volume weighted mean, the market never accepted those prices on the profile, and the aggression that pushed them is now being absorbed. A band alone is worth nothing, those three facts aligned are worth a position.
In the glossary: VWAP
FAQ
VWAP versus a moving average?+
A moving average treats every period equally. VWAP weights each price by the volume traded at that price, which gives the real average price of activity rather than an average of quotes.
What do the 1, 2 and 3 standard deviation bands represent?+
The first bounds the usual volatility range, where price spends most of its time. The second marks a significant, rarer move. The third marks extreme excursions. They are distance measurements, not reversal signals.
Can several VWAPs be displayed at once?+
Yes, and it is often the best use: a session VWAP for the day's fair value, a short one in minutes or orders for the current hour. Together they show whether the recent move is leaving or returning to the underlying reference.
What is Reset on RTH for?+
Deciding whether VWAP restarts at the regular session open or runs across the whole electronic session. It arrives off, so the average includes the overnight by default. On a US future, switching it on brings your VWAP closer to the one day participants are watching.
How is VWAP different from a moving average?+
A moving average treats every trade the same. VWAP weights them by volume, so a five hundred lot trade moves the average five hundred times more than a one lot trade. It answers the question of the price at which the market actually traded.
What is the Orders mode for?+
Advancing the calculation at the pace of activity rather than the clock. A window counted in orders stays steady through busy hours and turns cautious in quiet ones, where a window counted in minutes treats an opening minute and a lunchtime minute identically.
How many envelopes should I display?+
The two DeepDom enables by default, at one and two standard deviations. The third, at three standard deviations, arrives off and is only worth having if you explicitly trade volatility excesses.
Tutorial & settingsVWAP and envelopes: the complete setup, section by section
+Calculation period, reset on the regular session, standard deviation or percentage, and three envelopes enabled one by one.
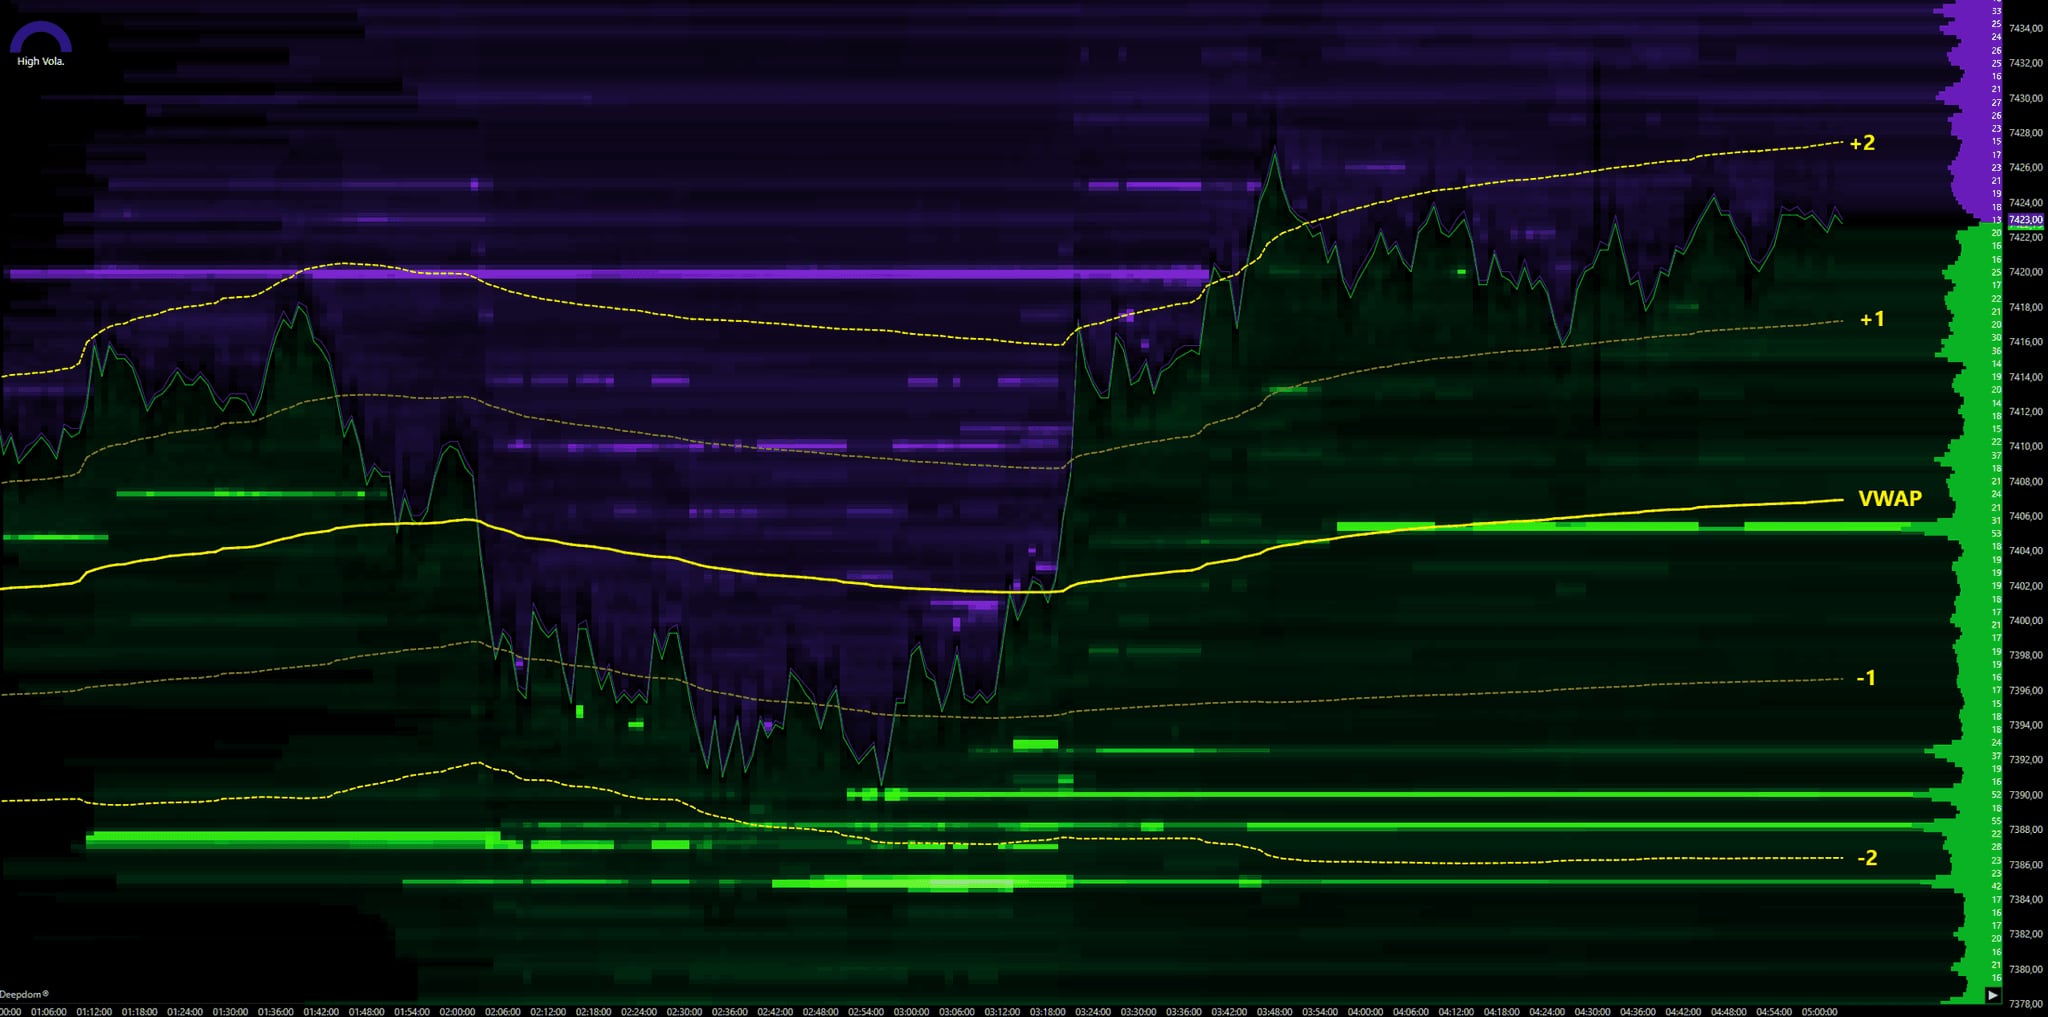
VWAP gives the average price of trades weighted by their volume: unlike a moving average, it does not treat a one lot trade like a five hundred lot one. The envelopes then measure how far price sits from that average, across three steps drawn as dashed lines and labelled +1, +2, -1 and -2 on the chart. Four settings decide what you read, and one of them appears in no article: Reset on RTH, which decides whether the average restarts at the regular session open or runs across the full session.
- An active DeepDom licence and a connected market
- Deciding in advance what you want to measure: a session VWAP and a ten minute VWAP answer different questions
Step by step
- 01
Show VWAP and read its envelopes
VWAP is switched on with the VWAP checkbox in the bar below the chart, and its settings open in a window titled Vwap + Envelopes. A solid line appears through the middle of price, surrounded by its dashed envelopes, labelled +1, +2, -1 and -2 at the right edge. The solid line carries the information, the dashed ones are only a distance measurement: that hierarchy is worth keeping in mind when you set the thicknesses.
Screenshot to comeA DeepDom chart with the VWAP line in solid yellow and its dashed envelopes, labelled +2, +1, -1 and -2.
- 02
Choose the period, and decide about the reset
The GENERAL section holds four fields. Period mode arrives on Daily: VWAP recomputes every session, which is the reference other participants are watching. Minutes and Seconds compute it over a rolling window whose length you set in Period value, 1 by default, which gives a far more mobile reading, suited to scalping and useless as a frame for the day. Orders computes over a number of orders rather than a duration, so at the pace of actual activity rather than the clock. And then there is Reset on RTH, off out of the box and absent from the source article: left OFF, VWAP takes in the whole electronic session, overnight included; switched on, it restarts at the regular session open. On a US future the two versions give two different reference prices, and it is the second one most day participants are watching.
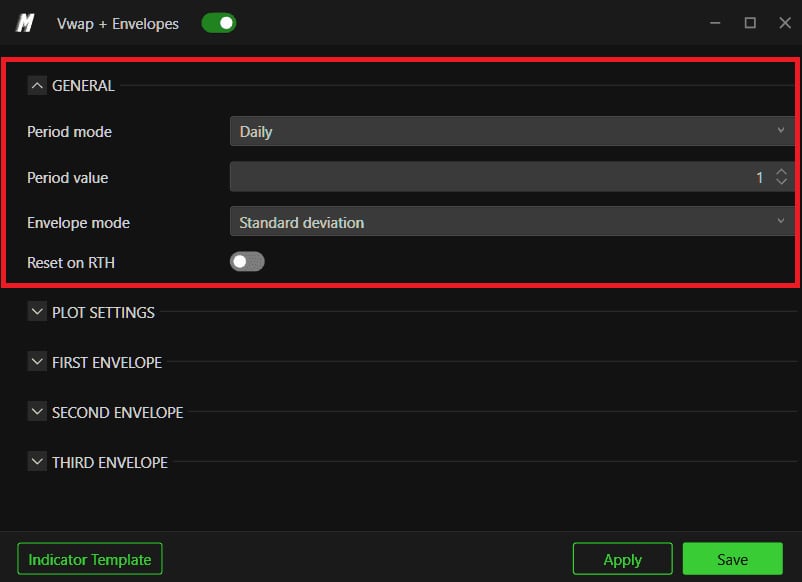
The GENERAL section with Period mode on Daily, Period value at 1, Envelope mode on Standard deviation and Reset on RTH off.© DeepCharts - 03
Choose what the envelopes measure, and style them
Envelope mode, in the same section, decides between Standard deviation, the default, and Percentage. In standard deviation the envelope width adapts to observed volatility: a tight envelope means a quiet market, and touching the second one keeps the same meaning from one session to the next. In percentage the width is fixed, so the reading is simpler and more arbitrary. The PLOT SETTINGS section then deliberately separates the line from its envelopes: Line color in yellow and Line width at 3 for the average, Envelope width at 2 and Envelope style on Dash for the envelopes, with Solid, Dot, Dash dot and Dash dot dot as alternatives. That 3 against 2 is no accident: it is what makes the average stand out.
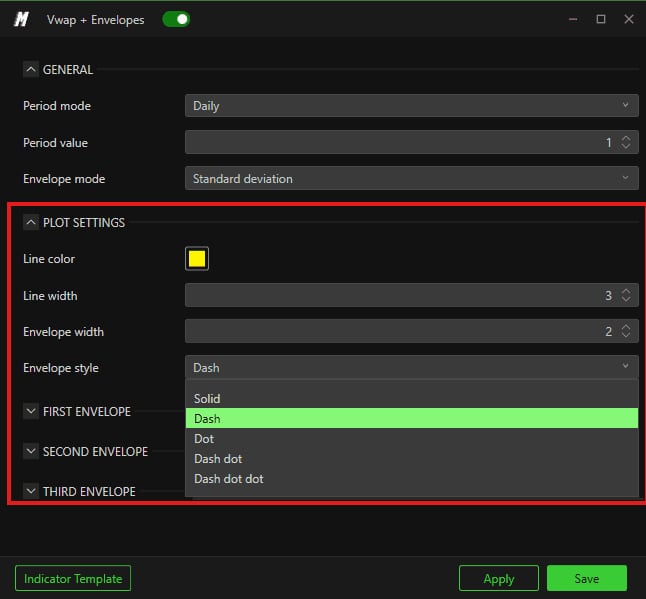
The PLOT SETTINGS section, with the Envelope style list open on its five strokes.© DeepCharts - 04
Enable the envelopes one by one
The three steps live in three separate sections, FIRST ENVELOPE, SECOND ENVELOPE and THIRD ENVELOPE, each with Enable, Dev Val, Up Color and Down Color. The colours are set per side, which lets you tell an upside excess from a downside one at a glance. The defaults are well judged: the first is enabled at 1.00, the second at 2.00, and the third, at 3.00, arrives disabled. That is exactly the configuration to keep at first, the third only being useful if you explicitly trade excesses.
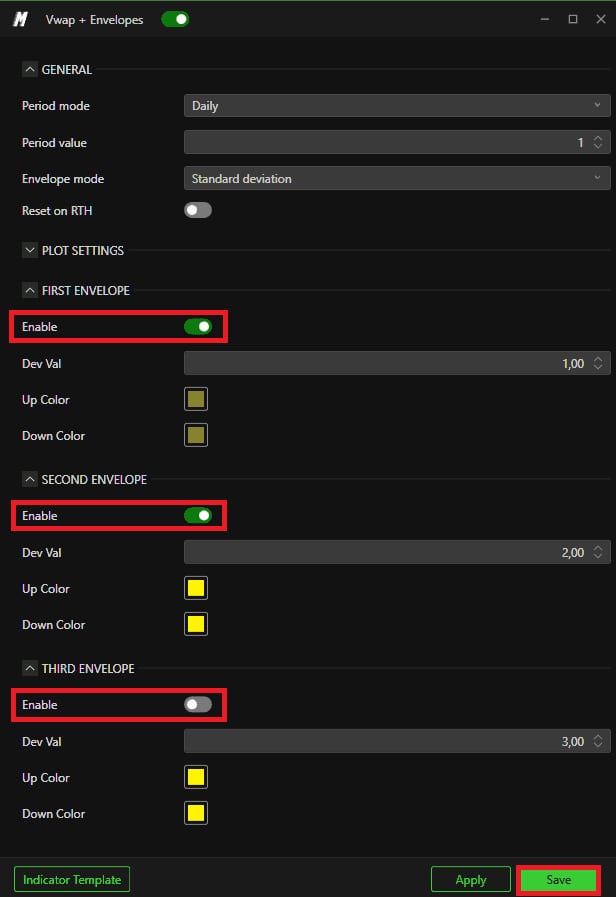
The three envelope sections, with the first and second enabled and the third disabled.© DeepCharts - 05
Stack two VWAPs of different periods
The documentation recommends running several VWAPs at once, and that is indeed where the tool earns its place. Add a second instance of the indicator with a different Period mode, for instance a session VWAP on Daily and a short VWAP on Minutes. The first gives the reference price of the day, the second that of the current hour. Price above both, or between the two, does not describe the same situation, and that divergence is what carries information, not the absolute value of either.
Screenshot to comeTwo VWAPs stacked on the same chart, one for the session and one short.
Settings, tab by tab
The four settings that change the measurement. Everything else is presentation.
Minutes, Seconds and Orders as alternatives. Orders advances the calculation at the pace of activity, not the clock.
Applies to the Minutes, Seconds and Orders modes.
Standard deviation adapts to volatility, Percentage imposes a fixed width.
Absent from the source article. Switched on, VWAP restarts at the regular session open instead of running across the whole electronic session.
Clearly above the envelopes: the line is what carries the information.
Solid, Dot, Dash dot and Dash dot dot as alternatives.
The zone considered normal.
Stronger volatility.
Only switch it on if you explicitly trade excesses.
Rare extremes.
⚠ Traps to avoid
- Ignoring Reset on RTH on a US future. Off, VWAP takes in the whole electronic session, overnight included, and gives a reference price most day participants are not watching.
- Setting Period mode to Minutes and reading the result as a session VWAP. A rolling fifteen minute VWAP hugs price and gives no frame for the day, which is precisely the frame you came to a VWAP for.
- Switching to Percentage because the envelopes move too much. They move because volatility moves, and that is the information. A fixed width makes the chart calmer and the reading less true.
- Enabling the third envelope out of habit. DeepDom ships it off, and that is the right setting: six lines around price, plus the average, on a chart that already carries the heatmap and the bubbles, and nothing is readable any more.
- Taking a touch of the third envelope as a reversal signal. It is a measurement of distance from the average, so a context of excess: the order flow still has to show absorption for that excess to turn.
Latest decoded trading sessions
A real trading day read live on the heatmap and the footprint: macro events, the levels that held, and every read with its DeepCharts screenshot.
- ESFriday, November 20, 2026S&P 500: six straight losses, rotation out of chips ahead of Waller and Michigan
- FDAXFriday, November 20, 2026DAX Outlook, 20 November 2026: FDAX Down 1.2% as AI Sell-Off and German Inflation Hit Frankfurt
- NQFriday, November 20, 2026Nasdaq 100: AI selloff spreads to chipmakers ahead of Waller and Michigan data
Want to get better at order flow?
We discuss flow, liquidity and our trades live, every day, on the OrderFlowFutures Discord. Join us, it's free.
Join the Discord for free20 online·125 members·Free · instant access